B-hydroxybutyrate accumulates in the rat heart during low-flow ischaemia with implications for functional recovery
←
→
Page content transcription
If your browser does not render page correctly, please read the page content below
RESEARCH ARTICLE

                                    b-hydroxybutyrate accumulates in the rat
                                    heart during low-flow ischaemia with
                                    implications for functional recovery
                                    Ross T Lindsay1,2†*, Sophie Dieckmann1, Dominika Krzyzanska1,
                                    Dominic Manetta-Jones1, James A West2, Cecilia Castro2, Julian L Griffin2,3,
                                    Andrew J Murray1
                                    1
                                      Department of Physiology, Development and Neuroscience, University of
                                    Cambridge, London, United Kingdom; 2Department of Biochemistry and Cambridge
                                    Systems Biology Centre, University of Cambridge, London, United Kingdom;
                                    3
                                      Section of Biomolecular Medicine, Systems Medicine, Department of Metabolism,
                                    Digestion and Reproduction, Imperial College London, London, United Kingdom

                                    Abstract Extrahepatic tissues which oxidise ketone bodies also have the capacity to accumulate
                                    them under particular conditions. We hypothesised that acetyl-coenzyme A (acetyl-CoA)
                                    accumulation and altered redox status during low-flow ischaemia would support ketone body
                                    production in the heart. Combining a Langendorff heart model of low-flow ischaemia/reperfusion
                                    with liquid chromatography coupled tandem mass spectrometry (LC-MS/MS), we show that b-
                                    hydroxybutyrate (b-OHB) accumulated in the ischaemic heart to 23.9 nmol/gww and was secreted
*For correspondence:                into the coronary effluent. Sodium oxamate, a lactate dehydrogenase (LDH) inhibitor, increased
rosstlindsay@gmail.com              ischaemic b-OHB levels 5.3-fold and slowed contractile recovery. Inhibition of b-hydroxy-b-
                                    methylglutaryl (HMG)-CoA synthase (HMGCS2) with hymeglusin lowered ischaemic b-OHB
Present address: †Research and
                                    accumulation by 40%, despite increased flux through succinyl-CoA-3-oxaloacid CoA transferase
Early Development,
                                    (SCOT), resulting in greater contractile recovery. Hymeglusin also protected cardiac mitochondrial
Cardiovascular, Renal and
Metabolic Diseases,                 respiratory capacity during ischaemia/reperfusion. In conclusion, net ketone generation occurs in
BioPharmaceuticals R&D,             the heart under conditions of low-flow ischaemia. The process is driven by flux through both
AstraZeneca Ltd, Cambridge,         HMGCS2 and SCOT, and impacts on cardiac functional recovery from ischaemia/reperfusion.
United Kingdom
Competing interest: See
page 13
                                    Introduction
Funding: See page 14                Hepatic ketogenesis plays a vital role in starvation physiology, whereby acetyl-coenzyme A (acetyl-
Received: 15 June 2021              CoA) derived from fatty acid oxidation (FAO) undergoes a stepwise conversion to acetoacetate
Accepted: 23 August 2021            (AcAc) and b-hydroxybutyrate (b-OHB), which in turn act as fuels for the brain and other extrahepatic
Published: 07 September 2021        tissues (Puchalska and Crawford, 2017). Initially, mitochondrial thiolase activity catalyses the forma-
                                    tion of acetoacetyl-CoA (AcAc-CoA) from two acetyl-CoA monomers, before a mitochondrial iso-
Reviewing editor: Arduino A
Mangoni, Flinders Medical
                                    form of b-hydroxy-b-methylglutaryl (HMG)-CoA synthase (HMGCS2) catalyses the condensation of
Centre, Australia                   AcAc-CoA and a further acetyl-CoA to form HMG-CoA. This latter reaction is considered the rate-
                                    limiting step of ketogenesis, with the significant ketogenic capacity of liver attributed to the uniquely
   Copyright Lindsay et al. This
                                    high activity of HMG-CoA synthase in comparison with other tissues (McGarry and Foster, 1976). In
article is distributed under the
                                    the mitochondria, HMG-CoA lyase converts HMG-CoA to AcAc, which in turn is reversibly converted
terms of the Creative Commons
Attribution License, which          to b-OHB under reducing conditions by b-hydroxybutyrate dehydrogenase (BDH1). In extrahepatic
permits unrestricted use and        tissues (Figure 1), BDH1 catalyses the reverse reaction converting b-OHB to AcAc, from which
redistribution provided that the    AcAc-CoA is obtained by the exchange of a CoA through the action of succinyl-CoA:3-oxaloacid
original author and source are      CoA transferase (SCOT). Mitochondrial thiolase activity then yields two acetyl-CoA molecules, which
credited.                           enter the Krebs cycle.

Lindsay et al. eLife 2021;10:e71270. DOI: https://doi.org/10.7554/eLife.71270                                                         1 of 16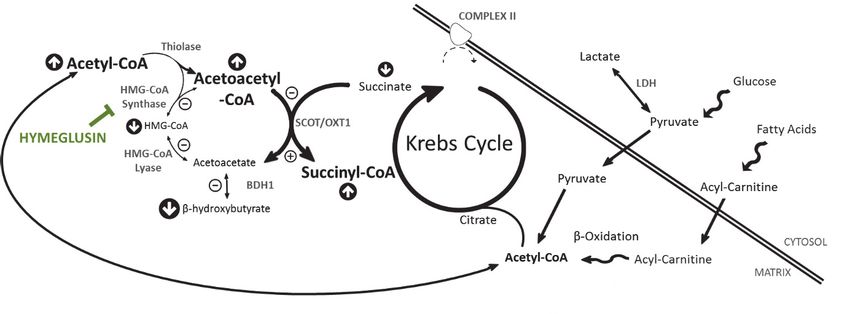
Research article                                                                         Biochemistry and Chemical Biology Cell Biology

Figure 1. b-OHB metabolism. Catabolism of both fatty acids and glucose yields acetyl-coenzyme A (acetyl-CoA), following uptake to the mitochondria
via acyl-carnitines and pyruvate, respectively. In the liver, ketogenesis involves the conversion of acetyl-CoA to acetoacetyl-CoA, b-hydroxy-b-
methylglutaryl-CoA (HMG-CoA), acetoacetate, and then b-hydroxybutyrate in a series of reversible reactions. The enzymes which catalyse this are HMG-
CoA synthase, HMG-CoA lyase, and b-hydroxybutyrate dehydrogenase (BDH1). In extrahepatic tissues, HMG-CoA can be bypassed through conversion
of acetoacetate to acetoacetyl-CoA in conjunction with the conversion of succinyl-CoA to succinate, catalysed by succinyl-CoA-3-oxaloacid CoA
transferase (SCOT). Rather than being oxidised in the mitochondria, under anaerobic conditions such as ischaemia, pyruvate can instead be converted
to lactate by the enzyme lactate dehydrogenase (LDH). For bidirectional enzymes involved in both ketolysis and ketogenesis, the direction of ketogenic
flux is represented by blue arrows, while ketolytic reactions are represented in green.

                                        The heart has a significant capacity for ketone body oxidation (Cotter et al., 2013), but any extra-
                                    hepatic tissue which oxidises ketone bodies also has the capacity to generate ketone bodies
                                    (Puchalska and Crawford, 2017). This was shown to occur in the kidney through the reversible enzy-
                                    matic activity of mitochondrial thiolase and SCOT, and the authors speculated that this may gener-
                                    ally be the case for extrahepatic tissues (Weidemann and Krebs, 1969). In the isolated perfused rat
                                    heart, net production of AcAc and b-OHB has been observed when fatty acids are supplied via the
                                    perfusion medium (Comte et al., 1997; Opie and Owen, 1975). Inclusion of [1-13C]octanoate in the
                                    medium and gas chromatography-mass spectrometry (GC-MS) analysis of ketone body enrichments
                                    in the coronary effluent implicated FAO as a source of this ketone body efflux (Comte et al., 1997),
                                    which may represent a spillover pathway when acetyl-CoA availability exceeds the capacity of the
                                    Krebs cycle. Independent of fatty acid provision, net production of AcAc from acetyl-CoA was seen
                                    in pig heart extracts but only in the presence of succinate (Stern et al., 1953), whilst AcAc and b-
                                    OHB synthesis was seen in isolated rat heart mitochondria respiring with pyruvate and malate
                                    (LaNoue et al., 1970).
                                        The conversion of AcAc to b-OHB by BDH1 is dependent on NADH availability, and accordingly
                                    was found to be increased in the isolated perfused rat heart under anoxic conditions (Opie and
                                    Owen, 1975). Reduction of AcAc was seen in sheep heart homogenates treated with succinate and
                                    the mitochondrial complex I inhibitor amytal (Krebs et al., 1961; Kulka et al., 1961), and complete
                                    reduction of AcAc to b-OHB was reported in isolated rat heart mitochondria respiring with succinate
                                    (Schönfeld et al., 2010). We therefore hypothesised that net cardiac production of b-OHB can occur

Lindsay et al. eLife 2021;10:e71270. DOI: https://doi.org/10.7554/eLife.71270                                                                  2 of 16
Research article Biochemistry and Chemical Biology Cell Biology
under ischaemic conditions, when availability of NADH and acetyl-CoA would be increased and
when succinate accumulates (Chouchani et al., 2014; Laplante et al., 1997; Taegtmeyer, 1978;
Zhang et al., 2018).
Results
b-hydroxybutyrate accumulates in the ischaemic rat heart
The concentration of b-OHB was measured in the left ventricle of rat hearts snap-frozen pre-ischae-
mia, at the conclusion of the ischaemic period, and post-reperfusion, and in the coronary effluent
throughout the perfusion protocol using liquid chromatography coupled mass spectrometry (LC-MS)
(Figure 2A–B). The concentration of b-OHB in left ventricle after 32 min of aerobic perfusion was 0.2
nmol per mg tissue, but following 20 min of low-flow ischaemia (0.56 ml.min 1.gww 1), it accumu-
lated to 23.9 nmol per mg tissue (pResearch article Biochemistry and Chemical Biology Cell Biology
Pre-Ischaemia v Ischaemia v Post-Reperfusion v
A 35 B 0.9
β-OHB Efflux (µmol.min-1gww-11)
30 ** 0.8
LV [β-OHB] (nmol.gww-1)
0.7
25
0.6
20 0.5
15 0.4
0.3
10
0.2
5 0.1
0 0
-0.1 0 4 8 12 16 20 24 28 32 36 40 44 48 52 56 60 64 68
Perfusion Time (min)
C D 8 ****
6
****
[Lactate] in the Coronary Effluent
**
Rela#ve to Pre-Ischaemic Levels
7
5 ****
****
Pre-Ischaemic Levels
6
[Lactate] Rela#ve to
4 5 **
3 4
3
2
2
1
1
0 0
0 4 8 12 16 20 24 28 32 36 40 44 48 52 56 60 64 68
Perfusion Time (min)
E 3.5 F 4.5 G 4.5
3 * 4 **** 4 **
LV [Acetoacetyl-CoA]
3.5 3.5
LV [Acetyl-CoA]
2.5
LV [HMG-CoA]
3 3
2 2.5 2.5
1.5 2 2
1.5 1.5
1
1 1
0.5 0.5 0.5
0 0 0
Figure 2. b-hydroxybutyrate accumulates in the ischaemic rat heart. Concentrations of b-hydroxybutyrate (b-OHB) in rat heart and the coronary effluent
relative to pre-ischaemic levels (A and B), and those of lactate (C and D). Pre-ischaemic, ischaemic, and post-reperfusion concentrations of acetyl-
coenzyme A (acetyl-CoA), acetoacetyl-CoA, and b-hydroxy-b-methylglutaryl-CoA (HMG-CoA) in the heart relative to pre-ischaemic levels (E, F, and G).
All three groups contained n = 7 hearts. Results are displayed as mean ± SEM. *pResearch article Biochemistry and Chemical Biology Cell Biology
Pre-Ischaemia v
Ischaemia v
Post-Reperfusion v
Figure 3. Ischaemic Krebs cycle flux. Concentrations of Krebs cycle intermediates in the left ventricle pre-ischaemia, at the end of the ischaemic period
and post-reperfusion, all relative to pre-ischaemic levels. All three groups comprised n = 7 hearts. Results are displayed as mean ± SEM. *pResearch article Biochemistry and Chemical Biology Cell Biology
A B 2 C 3.5
3 **
**
LV [Pyruvate]
1.5 2.5
LV [Lactate]
2
1
1.5
0.5 1
0.5
** 0 0
** D 2 E 9
**** * 8 ****
LV [Acetoacetyl-CoA]
LV [Acetyl-CoA]
1.5 7
**** 6
5
1
4
3
0.5 2
1
0 0
F * G H
2 6
*** 2.5
*** I 1.2
1.
5 1
LV [Succinyl-CoA]
2
LV [HMG-CoA]
1.5
LV [Succinate]
LV [β-OHB]
4 0.8
1 3
1.5
0.6
****
1
2 0.4
0.5 0.5
1 0.2
0 0 0 0
Control v Sodium Oxamate v
J
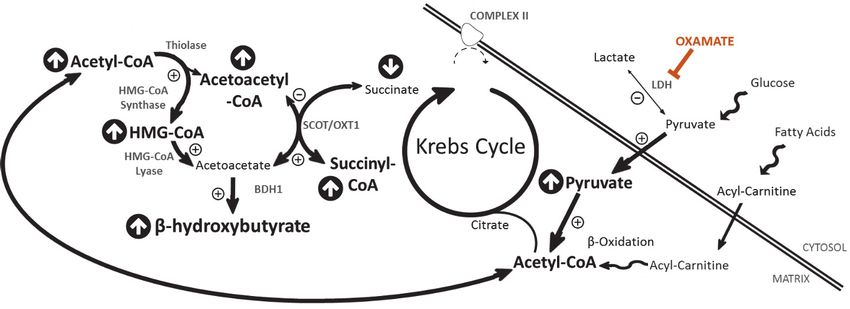
Figure 4. LDH inhibition enhances ketone flux in ischaemia. (A) Coronary effluent lactate levels relative to control pre-ischaemic levels, with and without
delivery of 50 mM of the lactate dehydrogenase (LDH) inhibitor sodium oxamate in the perfusion buffer (two groups of n = 5 hearts). Relative to
Figure 4 continued on next page
Lindsay et al. eLife 2021;10:e71270. DOI: https://doi.org/10.7554/eLife.71270 6 of 16Research article Biochemistry and Chemical Biology Cell Biology Figure 4 continued ischaemic controls, the ischaemic LV concentrations of (B) lactate, (C) pyruvate, (D) acetyl-coenzyme A (acetyl-CoA), (E) acetoacetyl-CoA, (F) b-hydroxy- b-methylglutaryl-CoA (HMG-CoA), (G) b-hydroxybutyrate (b-OHB), (H) succinyl-CoA, and (I) succinate with and without delivery of 50 mM of the LDH inhibitor sodium oxamate in the perfusion buffer (two groups, n = 6 hearts each). (J) Schematic depicting the suggested diversion of pyruvate away from lactate production and into b-OHB synthesis. Bold text and upward pointing arrows indicate metabolites which accumulated to a greater level in the presence of oxamate, downward pointing arrows and smaller text indicate those which accumulated to a lesser extent. Bold arrows suggest pathways where flux may be increased in the presence of oxamate. Results are presented as mean ± SEM. *p
Research article                                                                                                                 Biochemistry and Chemical Biology Cell Biology

                                                                              Hymeglusin administration 12 min before ischaemia resulted in 33% greater recovery of cardiac con-
                                                                              tractile function upon reperfusion, relative to untreated controls (Figure 6A). At 52, 56, and 60 min
                                                                              during the ischaemic period, 40, 43, and 35% lower levels of b-OHB were detected in the coronary
                                                                              effluent from hymeglusin-administered hearts relative to control hearts (Figure 6—figure supple-
                                                                              ment 1; p
Research article Biochemistry and Chemical Biology Cell Biology
oxidative phosphorylation (OXPHOS) capacity (pResearch article Biochemistry and Chemical Biology Cell Biology
myocardial infarction (Whereat and Chan, 1972). More recently, it has been reported that serum
levels of b-OHB and acetoacetate were found to increase systemically in human patients following
balloon-induced coronary ischaemia during elective coronary angioplasty, which was suggested to
reflect the early phase of metabolic adjustment during ischaemia (Di Marino et al., 2018). Mean-
while, myocardial b-OHB utilisation was suppressed during myocardial ischaemia in patients
experiencing angina-like chest pain (Arima et al., 2019).
Efflux of b-OHB is seen shortly after the onset of ischaemia, and its production is therefore likely
to result from altered substrate availability and/or post-translational modifications rather than altered
gene expression. Acetyl-CoA and succinate accumulate during ischaemia, while mitochondrial reac-
tive oxygen species (ROS) are also known to be produced (Chen et al., 2003). Each of these inter-
mediates may post-translationally modify proteins, and thereby support ketone flux. As such, this
could be an interesting avenue to further elucidate mechanisms.
An unexpected finding of our study was that at least some of the b-OHB produced in the ischae-
mic heart occurred via HMGCS2. HMGCS2 is expressed in human heart, albeit at a lower level than
in liver (Mascaró et al., 1995), and whilst activity levels of HMGCS2 and HMG-CoA lyase are,
respectively, 20-fold and 6.8-fold higher in adult rat liver than heart, activity in the myocardium
exceeds that in brain or skeletal muscle (McGarry and Foster, 1976). Although the role of cardiac
HMGCS2 is unknown, it is transiently expressed at a high level in neonatal mouse heart before
declining by postnatal day 23 (Talman et al., 2018) and has been shown to be upregulated in type 1
diabetes following streptozotocin (STZ) treatment in rats (Cook et al., 2017) and mice (Shukla et al.,
2017), as well as in mice when fasted or on a ketogenic diet (Wentz et al., 2010). Meanwhile, a
recent preliminary report suggested that heart-specific overexpression of HMGCS2 resulted in
increased cardiac b-OHB, along with mitochondrial swelling and systolic impairment
(Zenimaru et al., 2018).
In line with this latter report, we found that inhibition of HMGCS2 was associated with protection
of mitochondrial respiratory capacity in the post-ischaemic rat heart and enhanced functional recov-
ery from ischaemia/reperfusion. This protection is unlikely to arise as a direct result of decreased b-
OHB availability; ketone body administration has been shown to be neuroprotective during ischae-
mic stroke injury (Yin et al., 2015) and during renal ischaemia/reperfusion (Tajima et al., 2019).
Whilst the basis for this protection remains unclear, our findings do hint at a number of possible
mechanisms. The increased availability of acetyl-CoA may be protective in supporting Krebs cycle
activity and oxidative phosphorylation upon reperfusion. Alternatively, the inhibition of HMGCS2
supported greater reverse flux through SCOT, thereby lowering the ischaemic accumulation of succi-
nate. Succinate accumulation during ischaemia is associated with ROS production via reverse elec-
tron transfer (RET) to complex I as the succinate becomes oxidised upon reperfusion
(Chouchani et al., 2014; Schönfeld et al., 2010). It has also been demonstrated previously that
reduction of this ischaemic succinate accumulation via dimethyl malonate administration protects
against I/R injury (Chouchani et al., 2014). Inhibition of HMGCS2 may therefore represent a novel
cardioprotective strategy, perhaps of particular relevance to the diabetic heart, where sensitivity to
ischaemia/reperfusion injury (Paulson, 1997) and, at least in the case of type 1 diabetes, expression
of HMGCS2 are both increased (Cook et al., 2017; Shukla et al., 2017).
Conclusions
Ketone body accumulation occurs in the heart under conditions of low-flow ischaemia, and this is
mediated at least in part by HMG-CoA synthase. Inhibition of HMG-CoA synthase by hymeglusin
reduces the accumulation of b-OHB during ischaemia, and protects both cardiac contractile function
and mitochondrial respiratory capacity against damage mediated by I/R. This finding sheds new light
on the role of HMG-CoA synthase in the heart, and provides context for studies reporting altered
cardiac ketone body metabolism under pathological conditions.
Materials and methods
Key resources table
Continued on next page
Lindsay et al. eLife 2021;10:e71270. DOI: https://doi.org/10.7554/eLife.71270 10 of 16Research article Biochemistry and Chemical Biology Cell Biology
Continued
Reagent type
(species) or Source or Additional
resource Designation reference Identifiers information
Reagent type
(species) or Source or Additional
resource Designation reference Identifiers information
Strain, strain Wistar Rat Charles River Strain Code 003; 300–350 g
background RRID:RGD_13508588
(Rattus Norvegicus)
Chemical Hymeglusin Sigma Aldrich SML0301
compound,
drug
Chemical Sodium Oxamate Sigma Aldrich O2751
compound,
drug
Animal studies
Ethical approval
All experiments conformed to UK Home Office guidelines under the Animals in Scientific Procedures
Act and were approved by the University of Cambridge Animal Welfare and Ethical Review
Committee.
Power calculations were performed using a ‘known’ mean of 1, an ‘expected’ mean of 0.8, and a
sigma of 0.18 for a significance of 0.05, generating a suggested sample size of 7 for the initial
experiments. This is consistent with the power and group sizes with which significance has previously
been achieved in similar studies.
Materials and reagents
All reagents were obtained from Sigma Aldrich unless otherwise stated.
Heart perfusion
Male Wistar rats (300–350 g; n = 73) were obtained from a commercial breeder (Charles River, Mar-
gate, UK) and housed in conventional cages with a normal 12-hr/12-hr light/dark photoperiod and
access to normal rodent chow and water ad libitum. Rats were euthanised by rising CO2 levels, with
death confirmed by cervical dislocation. Hearts were excised and perfused in the Langendorff mode
with Krebs-Henseleit (KH) buffer (118 mM NaCl, 4.7 mM KCl, 1.2 mM MgSO4, 1.3 mM CaCl2, 0.5
mM ethylenediaminetetraacetic acid (EDTA), 25 mM NaHCO3, 1.2 mM KH2PO4; pH 7.4) plus sub-
strates as detailed below, gassed with 95% O2-5% CO2. Heart temperature was monitored through-
out and maintained at 38˚C. Functional parameters were measured using a PVC balloon inserted
into the left ventricle; rate-pressure product (RPP) was calculated as the left ventricular developed
pressure (LVDP) x heart rate. Hearts were randomly assigned into the experimental groups for each
experiment. A 1 ml coronary effluent sample was obtained every 4 min throughout each protocol
and frozen for metabolic analysis. Two different perfusion protocols were used, which differed in the
degree of ischaemic insult.
First we used a relatively mild ischaemic protocol to investigate ketone metabolism under condi-
tions which did not induce overt functional impairment upon reperfusion. The perfusate was KH
buffer containing 11 mM glucose and 0.4 mM equivalent triglyceride in the form of Intralipid. The
perfusion protocol entailed a 32-min aerobic perfusion followed by 20 min of low-flow ischaemia
(0.56 ml.min 1.gww 1) and 20 min of reperfusion. The protocol was terminated by snap-freezing the
left ventricle either at the end of the aerobic period, at the end of the ischaemic period before
reperfusion or following reperfusion (n = 7 for each group).
Second, to investigate the impact of altering ketone flux on functional recovery from ischaemia/
reperfusion, we used a perfusion protocol with a more severe ischaemic challenge. Here, the perfus-
ate comprised KH buffer with 11 mM glucose alone, since we observed no difference in ischaemic b-
OHB accumulation in hearts perfused with glucose and Intralipid compared with those perfused with
glucose alone (Figure 2—figure supplement 3). Following 32 min of aerobic perfusion at a constant
Lindsay et al. eLife 2021;10:e71270. DOI: https://doi.org/10.7554/eLife.71270 11 of 16Research article Biochemistry and Chemical Biology Cell Biology
pressure of 100 mmHg, hearts were subjected to 32 min of low-flow ischaemia at 0.32 ml.min 1.
gww 1, followed by 32 min of reperfusion. To manipulate possible pathways driving ketone flux,
either sodium oxamate (50 mM), a competitive inhibitor of LDH (Yoshioka et al., 2012), or hymeglu-
sin (2.5 mM), an inhibitor of HMG-CoA synthase (Le Foll et al., 2014; Skaff et al., 2012), or vehicle
(KH for oxamate or 80 ml dimethyl sulfoxide [DMSO] for hymeglusin) was added to the buffer 12 min
before induction of ischaemia (n = 5 for each group). Hymeglusin was delivered at a concentration
which exceeded that demonstrated to inhibit HMGCS2 in cardiomyocytes (Talman et al., 2018),
whilst oxamate was administered at a concentration previously used in the ex vivo perfused mouse
heart (Yoshioka et al., 2012).
Alongside the hymeglusin- and vehicle-administered hearts, a third group of hearts (n = 5) was
perfused aerobically for 96 min without ischaemia/reperfusion, as a non-ischaemic time-matched
control for mitochondrial respiratory analysis. From each of these three groups, a section of non-fro-
zen left ventricle (~5 mg) was placed in ice-cold BIOPS solution (2.77 mM CaK2-ethylene glycol tetra-
acetic acid [EGTA], 7.23 mM K2EGTA, 6.56 mM MgCl2.6H2O, 20 mM taurine, 15 mM
phosphocreatine, 20 mM imidazole, 0.5 mM dithiothreitol, 50 mM 2-(N-morpholino)ethanesulfonic
acid [MES], 5.77 mM Na2ATP; pH 7.1) for immediate analysis of mitochondrial respiratory capacity
using high-resolution respirometry.
Finally, a further group of hearts perfused with hymeglusin, sodium oxamate, or vehicle (n = 6 per
condition) were snap-frozen at the end of the ischaemic period without reperfusion, for the assess-
ment of myocardial metabolite levels. Metabolite levels were not assessed pre-ischaemia or post-
reperfusion in these experiments owing to the lack of any b-OHB seen pre-ischaemia in the initial
experiments (Figure 2).
Absolute cardiac function was consistent between all groups. For hearts where the functional
recovery is represented as a percentage of pre-ischaemic contractile function, absolute functional
values are detailed in Supplementary files 1–3.
Metabolite extraction from tissue
Metabolites were extracted from frozen LV samples using a methanol/chloroform/water extraction
method (Le Belle et al., 2002). Frozen tissues were added to 600 mL methanol/chloroform (2:1; v/v),
and the samples homogenised with a Tissuelyser (Qiagen, UK) for 5 min at a frequency of 20/s
before 15 min of sonication. Water (200 mL) and chloroform (200 mL) were then added to the samples
prior to centrifugation at 17,000 xg for 7 min. The resulting aqueous and organic phases were col-
lected and the extraction procedure repeated for a second time on the protein pellets. Aqueous
phases were dried down using an evacuated centrifuge, while the organic phase was dried by evap-
oration under a stream of nitrogen. Dried samples were stored at 20˚C until further analysis.
BEH amide LC methodology
Aqueous extract fractions were reconstituted in an acetonitrile: 10 mM ammonium carbonate solu-
tion (7:3 v/v, 100 ml) containing a 10 mM mixture of internal standards (200 mL; phenylalanine d5,
valine d8, leucine d10). The column used was a 1.7-mm BEH amide column (150 x 2.1 mm), coupled
to a Vanquish UHPLC+ series (Thermo Scientific, UK) LC system and a TSQ Quantiva Triple Quadru-
pole Mass Spectrometer (Thermo Scientific). The mobile phase was pumped at 600 ml min 1 with
0.1% ammonium carbonate solution as mobile phase A and acetonitrile as mobile phase B. Mobile
phase A was held at 20% for 1.5 min, linearly increased to 60% over the next 2.5 min, and held at
60% for 1 min, before being decreased back to the initial conditions (20% mobile phase A) in the
next 0.1 min. The total run time was 6 min. Nitrogen at 48 mTorr, 420˚C, was used as a drying gas
for solvent evaporation and the ultra performance liquid chromatography column was conditioned
at 30˚C.
C18pfp LC methodology
Heart sample extracts were reconstituted in a 10 mM ammonium acetate solution/internal standard
mixture (200 mL; phenylalanine d5, valine d8, leucine d10), while coronary effluent samples were
diluted (20 ml plus 80 ml 10 mM ammonium acetate/internal standard mix). All samples were run for
6 min using an ACE Excel-2 C18-PFP 5 mm column (100 A, 150 x 2.1 mm, 30˚C) on either a Thermo
Vanquish LC system coupled to a Thermo Quantiva triple quadrupole mass spectrometer for
Lindsay et al. eLife 2021;10:e71270. DOI: https://doi.org/10.7554/eLife.71270 12 of 16Research article Biochemistry and Chemical Biology Cell Biology
targeted analysis or a Thermo Dionex Ultimate 3000 LC system coupled to a Thermo Elite orbitrap
mass spectrometer for open profiling. Mobile phase A was 0.1% formic acid, while mobile phase B
was acetonitrile plus 0.1% formic acid. The LC gradient was as follows: 0% B for 1.6 min followed by
a linear gradient up to 30% B for 2.4 min. There was a further linear increase to 90% B for 30 s, fol-
lowing which B was held at 90% for 30 s before re-equilibration for 1.5 min. Drying gas was as used
in the BEH amide method.
Detection
The Thermo Elite orbitrap mass spectrometer had run parameters as follows: heater temperature
420˚C, sheath gas flow rate 60 units, aux gas flow rate 20 units, and sweep gas flow rate 5 units. The
spray voltage was 2.5, capillary temperature 380˚C, and S-lens RF level 60%. On the Quantiva,
electrospray voltage switched rapidly between 3.5 kV and 2.5 kV.
b-hydroxybutyrate quantification
To allow quantification of b-hydroxybutyrate, a standard dilution series comprising eight known con-
centrations of b-hydroxybutyrate between 100 mM and 50 nM was run in tandem with the biological
samples using the Thermo Elite orbitrap. b-hydroxybutyrate was measured at m/z = 103.025,
with a retention time of 2.2 min.
High-resolution respirometry
A section of the left ventricle 5 mm above the apex was dissected into bundles of six to eight myofi-
bres and permeabilised with gentle rocking for 20 min at 4˚C in BIOPS with 50 mg.ml 1 saponin
(Pesta and Gnaiger, 2012). Fibre bundles were then washed (3 x 5 min, 4˚C) in respiration medium
(MiR05: 0.5 mM EGTA, 3 mM MgCl2.6H2O, 60 mM K-lactobionate, 20 mM taurine, 10 mM KH2PO4,
20 mM (4- (2-hydroxyethyl) -1-piperazineethanesulfonic acid [HEPES]), 110 mM sucrose, 1 g L 1
defatted bovine serum albumin [BSA], pH 7.1).
Approximately 2 mg of the resulting fibre bundles was immediately added to Oxygraph-O2k
chambers (Oroboros Instruments, Innsbruck, Austria) containing 2 ml MiR05 at 37˚C. Respiratory
capacities were assessed as described previously (Horscroft et al., 2015). Briefly, malate (2 mM)
and octanoyl carnitine (0.2 mM) were added initially to stimulate LEAK respiration, followed by aden-
osine diphosphate (ADP) (5 mM) to stimulate b-oxidation-supported OXPHOS, then pyruvate (20
mM) for a comparison of substrate preference, glutamate (10 mM) to support the N-pathway via
complex I, cytochrome c (10 mM) to assess outer mitochondrial membrane integrity, succinate (10
mM) to activate the S-pathway via complex II, and rotenone (0.5 mM) to inhibit complex I.
Statistical analysis
Measured values were compared to those in pre-ischaemic or non-ischaemic control groups as
appropriate using a two-tailed Student’s t-test. To assess changes in functional recovery, the average
RPP across 4-min sections was compared to the same 4-min section in control hearts using a two-
tailed Student’s t-test. A p-value less than or equal to 0.05 was considered statistically significant.
Supporting data
Data from this study is available at the University of Cambridge Online Data Repository https://doi.
org/10.17863/CAM.72871.
Additional information
Competing interests
Ross T Lindsay: Ross T. Lindsay is affiliated with BioPharmaceuticals R&D, AstraZeneca Ltd. The
author has no financial interests to declare. The other authors declare that no competing interests
exist.
Lindsay et al. eLife 2021;10:e71270. DOI: https://doi.org/10.7554/eLife.71270 13 of 16Research article Biochemistry and Chemical Biology Cell Biology
Funding
Funder Grant reference number Author
British Heart Foundation FS/14/59/31282 Ross T Lindsay
Research Councils UK EP/E500552/1 Andrew Murray
The funders had no role in study design, data collection and interpretation, or the
decision to submit the work for publication.
Author contributions
Ross T Lindsay, Conceptualization, Data curation, Formal analysis, Funding acquisition, Validation,
Investigation, Visualization, Methodology, Writing - original draft, Project administration, Writing -
review and editing; Sophie Dieckmann, Dominika Krzyzanska, Dominic Manetta-Jones, Investigation;
James A West, Cecilia Castro, Formal analysis, Investigation, Methodology; Julian L Griffin, Concep-
tualization, Resources, Supervision, Funding acquisition, Validation, Visualization, Methodology,
Writing - original draft, Writing - review and editing; Andrew J Murray, Conceptualization, Resour-
ces, Supervision, Funding acquisition, Validation, Visualization, Methodology, Writing - original draft,
Project administration, Writing - review and editing
Author ORCIDs
Ross T Lindsay https://orcid.org/0000-0001-7760-613X
Ethics
Animal experimentation: All experiments conformed to UK Home Office guidelines under the Ani-
mals in Scientific Procedures Act, and were approved by the University of Cambridge Animal Wel-
fare and Ethical Review Committee.
Decision letter and Author response
Decision letter https://doi.org/10.7554/eLife.71270.sa1
Author response https://doi.org/10.7554/eLife.71270.sa2
Additional files
Supplementary files
. Supplementary file 1. Pre-ischaemic cardiac function for Figure 2 hearts.
. Supplementary file 2. Pre-ischaemic contractile function for Figure 4—figure supplement 2 func-
tional recovery.
. Supplementary file 3. Pre-ischaemic contractile function for Figure 6 functional recovery.
. Transparent reporting form
Data availability
The datasets generated during the current study are freely available in the University of Cambridge
repository.
The following dataset was generated:
Database and
Author(s) Year Dataset title Dataset URL Identifier
Lindsay R, 2021 -Hydroxybutyrate Accumulates in https://www.repository. Apollo - University of
Dieckmann S, the Rat Heart during Low-Flow cam.ac.uk/handle/1810/ Cambridge
Krzyzanska D, Ischaemia with Implications for 327420 Repository, 10.17863/
Manetta-Jones D, Functional Recovery CAM.72871
West J, Castro C,
Griffin J
Lindsay et al. eLife 2021;10:e71270. DOI: https://doi.org/10.7554/eLife.71270 14 of 16Research article Biochemistry and Chemical Biology Cell Biology
References
Arima Y, Izumiya Y, Ishida T, Takashio S, Ishii M, Sueta D, Fujisue K, Sakamoto K, Kaikita K, Tsujita K. 2019.
Myocardial ischemia suppresses ketone body utilization. Journal of the American College of Cardiology 73:
246–247. DOI: https://doi.org/10.1016/j.jacc.2018.10.040, PMID: 30408507
Chen Q, Vazquez EJ, Moghaddas S, Hoppel CL, Lesnefsky EJ. 2003. Production of reactive oxygen species by
mitochondria: central role of complex III. The Journal of Biological Chemistry 278:36027–36031. DOI: https://
doi.org/10.1074/jbc.M304854200, PMID: 12840017
Chouchani ET, Pell VR, Gaude E, Aksentijević D, Sundier SY, Robb EL, Logan A, Nadtochiy SM, Ord ENJ, Smith
AC, Eyassu F, Shirley R, Hu CH, Dare AJ, James AM, Rogatti S, Hartley RC, Eaton S, Costa ASH, Brookes PS,
et al. 2014. Ischaemic accumulation of succinate controls reperfusion injury through mitochondrial ROS. Nature
515:431–435. DOI: https://doi.org/10.1038/nature13909, PMID: 25383517
Comte B, Vincent G, Bouchard B, Jetté M, Cordeau S, Rosiers CD. 1997. A 13C mass isotopomer study of
anaplerotic pyruvate carboxylation in perfused rat hearts. Journal of Biological Chemistry 272:26125–26131.
DOI: https://doi.org/10.1074/jbc.272.42.26125, PMID: 9334177
Cook GA, Lavrentyev EN, Pham K, Park EA. 2017. Streptozotocin diabetes increases mRNA expression of
ketogenic enzymes in the rat heart. Biochimica et Biophysica Acta (BBA) - General Subjects 1861:307–312.
DOI: https://doi.org/10.1016/j.bbagen.2016.11.012, PMID: 27845231
Cotter DG, Schugar RC, Wentz AE, d’Avignon DA, Crawford PA. 2013. Successful adaptation to ketosis by mice
with tissue-specific deficiency of ketone body oxidation. American Journal of Physiology-Endocrinology and
Metabolism 304:E363–E374. DOI: https://doi.org/10.1152/ajpendo.00547.2012, PMID: 23233542
Di Marino S, Viceconte N, Lembo A, Summa V, Tanzilli G, Raparelli V, Truscelli G, Mangieri E, Gaudio C, Cicero
DO. 2018. Early metabolic response to acute myocardial ischaemia in patients undergoing elective coronary
angioplasty. Open Heart 5:e000709. DOI: https://doi.org/10.1136/openhrt-2017-000709, PMID: 29632675
Griffin JL, White LT, Lewandowski ED. 2000. Substrate-dependent proton load and recovery of stunned hearts
during pyruvate dehydrogenase stimulation. American Journal of Physiology-Heart and Circulatory Physiology
279:H361–H367. DOI: https://doi.org/10.1152/ajpheart.2000.279.1.H361, PMID: 10899076
Horscroft JA, Burgess SL, Hu Y, Murray AJ. 2015. Altered oxygen utilisation in rat left ventricle and soleus after
14 days, but not 2 days, of environmental hypoxia. PLOS ONE 10:e0138564. DOI: https://doi.org/10.1371/
journal.pone.0138564, PMID: 26390043
Krebs HA, Eggleston LV, D’Alessandro A. 1961. The effect of succinate and amytal on the reduction of
acetoacetate in animal tissues. Biochemical Journal 79:537–549. DOI: https://doi.org/10.1042/bj0790537
Kulka RG, Krebs HA, Eggleston LV. 1961. The reduction of acetoacetate to b-hydroxybutyrate in animal tissues.
Biochemical Journal 78:95–106. DOI: https://doi.org/10.1042/bj0780095
LaNoue K, Nicklas WJ, Williamson JR. 1970. Control of citric acid cycle activity in rat heart mitochondria. Journal
of Biological Chemistry 245:102–111. DOI: https://doi.org/10.1016/S0021-9258(18)63427-1
Laplante A, Vincent G, Poirier M, Des Rosiers C. 1997. Effects and metabolism of fumarate in the perfused rat
heart a 13C mass isotopomer study. American Journal of Physiology-Endocrinology and Metabolism 272:E74–
E82. DOI: https://doi.org/10.1152/ajpendo.1997.272.1.E74
Le Belle JE, Harris NG, Williams SR, Bhakoo KK. 2002. A comparison of cell and tissue extraction techniques
using high-resolution 1H-NMR spectroscopy. NMR in Biomedicine 15:37–44. DOI: https://doi.org/10.1002/
nbm.740, PMID: 11840551
Le Foll C, Dunn-Meynell AA, Miziorko HM, Levin BE. 2014. Regulation of hypothalamic neuronal sensing and
food intake by ketone bodies and fatty acids. Diabetes 63:1259–1269. DOI: https://doi.org/10.2337/db13-
1090, PMID: 24379353
Mascaró C, Buesa C, Ortiz JA, Haro D, Hegardt FG. 1995. Molecular cloning and tissue expression of human
mitochondrial 3-hydroxy-3-methylglutaryl-CoA synthase. Archives of Biochemistry and Biophysics 317:385–390.
DOI: https://doi.org/10.1006/abbi.1995.1178, PMID: 7893153
McGarry JD, Foster DW. 1976. Ketogenesis and its regulation. The American Journal of Medicine 61:9–13.
DOI: https://doi.org/10.1016/0002-9343(76)90024-3, PMID: 937374
Opie LH, Owen P. 1975. Effects of increased mechanical work by isolated perfused rat heart during production
or uptake of ketone bodies assessment of mitochondrial oxidized to reduced free nicotinamide-adenine
dinucleotide ratios and oxaloacetate concentrations. Biochemical Journal 148:403–415. DOI: https://doi.org/
10.1042/bj1480403, PMID: 173281
Paulson DJ. 1997. The diabetic heart is more sensitive to ischemic injury. Cardiovascular Research 34:104–112.
DOI: https://doi.org/10.1016/S0008-6363(97)00018-7, PMID: 9217879
Pesta D, Gnaiger E. 2012. High-resolution respirometry: OXPHOS protocols for human cells and permeabilized
fibers from small biopsies of human muscle. Methods in molecular biology 810:25–58. DOI: https://doi.org/10.
1007/978-1-61779-382-0_3, PMID: 22057559
Puchalska P, Crawford PA. 2017. Multi-dimensional roles of ketone bodies in fuel metabolism, signaling, and
therapeutics. Cell Metabolism 25:262–284. DOI: https://doi.org/10.1016/j.cmet.2016.12.022, PMID: 28178565
Schönfeld P, Wieckowski MR, Lebiedzińska M, Wojtczak L. 2010. Mitochondrial fatty acid oxidation and oxidative
stress: lack of reverse electron transfer-associated production of reactive oxygen species. Biochimica et
Biophysica Acta (BBA) - Bioenergetics 1797:929–938. DOI: https://doi.org/10.1016/j.bbabio.2010.01.010,
PMID: 20085746
Lindsay et al. eLife 2021;10:e71270. DOI: https://doi.org/10.7554/eLife.71270 15 of 16Research article Biochemistry and Chemical Biology Cell Biology
Shukla SK, Liu W, Sikder K, Addya S, Sarkar A, Wei Y, Rafiq K. 2017. HMGCS2 is a key ketogenic enzyme
potentially involved in type 1 diabetes with high cardiovascular risk. Scientific Reports 7:1–10. DOI: https://doi.
org/10.1038/s41598-017-04469-z
Skaff DA, Ramyar KX, McWhorter WJ, Barta ML, Geisbrecht BV, Miziorko HM. 2012. Biochemical and structural
basis for inhibition of Enterococcus faecalis hydroxymethylglutaryl-CoA synthase, mvaS, by hymeglusin.
Biochemistry 51:4713–4722. DOI: https://doi.org/10.1021/bi300037k, PMID: 22510038
Stern JR, Coon MJ, Del Campillo A. 1953. Enzymatic breakdown and synthesis of acetoacetate. Nature 171:28–
30. DOI: https://doi.org/10.1038/171028a0, PMID: 13025466
Taegtmeyer H. 1978. Metabolic responses to cardiac hypoxia. Increased production of succinate by rabbit
papillary muscles. Circulation Research 43:808–815. DOI: https://doi.org/10.1161/01.RES.43.5.808, PMID: 70
9743
Tajima T, Yoshifuji A, Matsui A, Itoh T, Uchiyama K, Kanda T, Tokuyama H, Wakino S, Itoh H. 2019. b-
hydroxybutyrate attenuates renal ischemia-reperfusion injury through its anti-pyroptotic effects. Kidney
International 95:1120–1137. DOI: https://doi.org/10.1016/j.kint.2018.11.034, PMID: 30826015
Talman V, Teppo J, Pöhö P, Movahedi P, Vaikkinen A, Karhu ST, Trošt K, Suvitaival T, Heikkonen J, Pahikkala T,
Kotiaho T, Kostiainen R, Varjosalo M, Ruskoaho H. 2018. Molecular atlas of postnatal mouse heart
development. Journal of the American Heart Association 7:1–18. DOI: https://doi.org/10.1161/JAHA.118.
010378
Weidemann MJ, Krebs HA. 1969. The fuel of respiration of rat kidney cortex. Biochemical Journal 112:149–166.
DOI: https://doi.org/10.1042/bj1120149
Wentz AE, d’Avignon DA, Weber ML, Cotter DG, Doherty JM, Kerns R, Nagarajan R, Reddy N, Sambandam N,
Crawford PA. 2010. Adaptation of myocardial substrate metabolism to a ketogenic nutrient environment.
Journal of Biological Chemistry 285:24447–24456. DOI: https://doi.org/10.1074/jbc.M110.100651
Whereat AF, Chan A. 1972. Effects of hypoxemia and acute coronary occlusion on myocardial metabolism in
dogs. American Journal of Physiology-Legacy Content 223:1398–1406. DOI: https://doi.org/10.1152/ajplegacy.
1972.223.6.1398
Yin J, Han P, Tang Z, Liu Q, Shi J. 2015. Sirtuin 3 mediates neuroprotection of ketones against ischemic stroke.
Journal of Cerebral Blood Flow & Metabolism 35:1783–1789. DOI: https://doi.org/10.1038/jcbfm.2015.123,
PMID: 26058697
Yoshioka J, Chutkow WA, Lee S, Kim JB, Yan J, Tian R, Lindsey ML, Feener EP, Seidman CE, Seidman JG, Lee
RT. 2012. Deletion of thioredoxin-interacting protein in mice impairs mitochondrial function but protects the
myocardium from ischemia-reperfusion injury. Journal of Clinical Investigation 122:267–279. DOI: https://doi.
org/10.1172/JCI44927
Zenimaru Y, Suzuki J, Nakaya T, Yamada M, Ichikawa MAI, Sato S, Imagawa M, Kraemer FB, Konosjita T, Ishizuka
T. 2018. Heart-Specific overexpression of HMG-CoA synthase 2 induces mitochondrial Stress—Adaptation via
the ATF4 Pathway. Diabetes 67:1906. DOI: https://doi.org/10.2337/db18-1906-P
Zhang J, Wang YT, Miller JH, Day MM, Munger JC, Brookes PS. 2018. Accumulation of succinate in cardiac
ischemia primarily occurs via canonical krebs cycle activity. Cell Reports 23:2617–2628. DOI: https://doi.org/10.
1016/j.celrep.2018.04.104, PMID: 29847793
Lindsay et al. eLife 2021;10:e71270. DOI: https://doi.org/10.7554/eLife.71270 16 of 16You can also read