BAI-Webinar "Timberland and Farmland - Alternative and Sustainable Investment Choices"

Page created by Benjamin Le
 
CONTINUE READING
BAI-Webinar "Timberland and Farmland - Alternative and Sustainable Investment Choices"
BAI-Webinar „Timberland and Farmland – Alternative and Sustainable Investment Choices"

                                                                                                  Speakers:
                           Hancock Natural Resource Group – a Manulife Investment Management Company:
                                               Keith Balter: Managing Director, Head of Economic Research
                                       Michael Strzelecki, CFA: Managing Director, Senior Portfolio Manager
                                                                                                       June 22, 2021

                                                                       Philipp Bunnenberg
                                                                       Consultant
                                                                       Alternative Markets, BAI e.V.

                                                                       Poppelsdorfer Allee 106
                                                                       53115 Bonn
                                                                       +49 (0) 228 96987-52
                                                                       bunnenberg@bvai.de
BAI-Webinar "Timberland and Farmland - Alternative and Sustainable Investment Choices"
What‘s moving markets?

                         2
BAI-Webinar "Timberland and Farmland - Alternative and Sustainable Investment Choices"
The Speakers from our BAI members

            Keith Balter is responsible for the market analysis supporting investment and operational planning and decision
            making for the Hancock Natural Resource Group (HNRG), a Manulife Investment Management Company.
            Keith’s team maintains informational databases and produces analytical studies and publications addressing trends
            in timber and agricultural commodity markets as well as and the role of timberlands and farmlands in institutional
            investment. Before joining HNRG in 2012, Keith was Senior Economist with Forest Capital Partners LLC, a company
            investing and managing commercial timberland for institutional investors, where he was responsible for market
            analysis, business development and investor support. Prior to his time at Forest Capital Partners, Keith was a
            principal at RISI, a provider of information services and analysis to the global forest products sector. Keith holds an
            MFS in Forest Economics from Yale, and an MBA from the University of Chicago.

            Michael Strzelecki is responsible for business development activities, specifically focused on capital formation for
            Hancock Natural Resource Group (HNRG), a Manulife Investment Management Company, across North America,
            South America and Europe.

            In addition, he manages a number of investment portfolios and large institutional client relationships. Prior to
            joining HTRG in 2017, Michael worked at Global Forest Partners, where he was directly involved in portfolio
            management, valuation analysis, and investment research. Before GFP, Michael was an equity research analyst at
            Merrill Lynch, covering the forest products sector. He holds a B.S. in Finance from the Pennsylvania State University
            and is a CFA® charterholder.

                                                                                                                                      3
BAI-Webinar "Timberland and Farmland - Alternative and Sustainable Investment Choices"
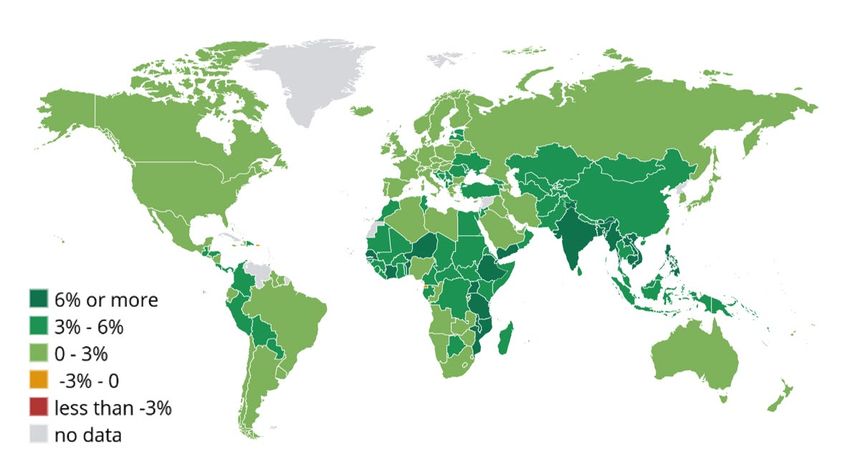
Timberland & Farmland –
Alternative and
Sustainable Investment
Choices
Hancock Natural Resource Group (HNRG), a Manulife
Investment Management Company

Keith Balter
Michael Strzelecki

June 2021

This event is taking place and recorded on June 22, 2021 and is brought to you by Manulife Investment Management. This commentary is for investment
professional use only and is not authorized or intended for use with the public. The commentary reflects the views of the presenters at the time of the event and is
subject to change as market and other conditions warrant. These opinions may not necessarily reflect the views of Manulife Investment Management or its
affiliates. Any holdings, securities, or assets referred to in this commentary may or may not represent a portion of the total portfolio and are intended for
discussion purposes only. Our opinions on any referenced securities or assets are subject to change without notice and are not a recommendation to buy or sell
any security. Any performance and/or characteristics discussed are based on current information [as noted in the material]. Investing involves risks, including the
potential loss of principal. You are encouraged to work with an investment professional before investing. Manulife Investment Management does not provide
investment, legal or tax advice. You should not rely upon any forward-looking statements, as actual results and events may differ materially. Past performance is
not indicative of future results.

                                                     For Institutional/Investment Professional Use Only. Not for distribution to the public. For informational use only.
BAI-Webinar "Timberland and Farmland - Alternative and Sustainable Investment Choices"
Agenda

• Attributes of the asset classes

• Sustainability & climate benefits

• Resilience during COVID-19

• Current market environment and outlook

                                                                                                                                        2

                  For Institutional/Investment Professional Use Only. Not for distribution to the public. For informational use only.
BAI-Webinar "Timberland and Farmland - Alternative and Sustainable Investment Choices"
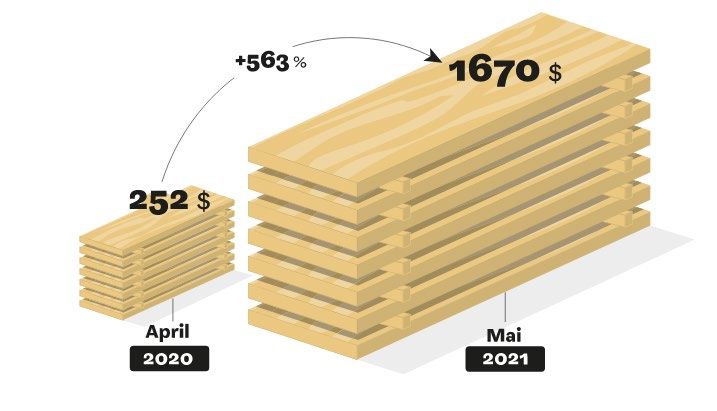
Global, Integrated, Sustainable Timber & Agriculture Investments
Hancock Natural Resource Group, a Manulife Investment Management company, is the
world’s largest timberland¹ and leading agriculture investment manager
 USD
 14.3B
 Total Assets
    Under
 Management

                                                                                                                   Vancouver
                                                                                                                                                          Boston

  5.9M                                                                                                                                                Charlotte
 Total Acres
   Under
 Management

   653
 Employees
 across the
   globe
                                                                                                                                                                   Curitiba
                                                                              Milton
                                                       Melbourne                             Tauranga                                          Valdivia

Over 200
Investors from

    13                      HNRG Headquarters                                       HNRG Managed Asset Locations

  Different                 HNRG Regional Office*                                   Additional Manulife Investment Management Presence
  countries
                            HNRG Field Office

                 As of December 31, 2020
                 * Includes offices associated with client owned operating companies                                                                                          3
                 ¹ Source: Fastmarkets RISI Global Timberland Ownership and Investment Database as of June 30, 2020
                         For Institutional/Investment Professional Use Only. Not for distribution to the public. For informational use only.                                  534625.
BAI-Webinar "Timberland and Farmland - Alternative and Sustainable Investment Choices"
Long History of Stewardship, Sustainability & Responsible Investing
                                      Sustainability & stewardship have been essential strategies to maximize value since inception
                                                                                                                                                                                               2020
                                                                                                                                           2015
                                                                                                                                                                                               Issues its first Climate report, in line with the
                                     1999                                                                                                  Becomes a signatory to the
                                                                                       2005                                                Principles for Responsible
                                                                                                                                                                                               recommendations of the Task Force on
                                     Has its first timber                                                                                                                                      Climate-related Financial Disclosures (TCFD)
                                     property certified to                             Commits to the Equator                              Investment*
                                     Forest Stewardship                                Principles                                                                                                       2018
                                                                                                                                            Almond and pistachio
                                     Council® standards                                                                                     operations complete USDA                                    Becomes a member of the
                                                                                                                                            Good Agriculture Practices                                  Global Impact Investing Network
                                                                                                                                            Certification
                     16,0

                     14,0

                     12,0
Market Value ($ billions USD)

                     10,0

                                8,0

                                6,0

                                4,0

                                2,0
                                                                         HNRG Assets Under Management
                                 -
                                      1999    2000     2001   2002    2003    2004      2005       2006      2007       2008      2009       2010      2011       2012      2013       2014      2015     2016     2017      2018     2019     2020
                                                                                                                              2011                                         2016
                                                                                                                              Formally establishes its                     Plants its 1 billionth tree
                                                       2002                                                                   Sensitive Lands
                                                       Becomes the first timberland                                           Program for preserving                                           2019
                                                       investment manager to have its                                         unique and sensitive
                                                                                                                                                                                               Completes the first third-party audit to
                                                       holdings throughout North America                                      lands
                                                                                                                                                                                               the new Leading Harvest Farmland
                                                       certified under the Sustainable                                                                                                         Management Standard for its entire
                                                       Forestry Initiative®                                                                                                                    direct-operate US farming platform

                                                                         As of December 31, 2020
                                                                         *Manulife Investment Management, the global asset management business of Manulife, is the signatory to the UNPRI which includes HNRG                                  4

                                                                                 For Institutional/Investment Professional Use Only. Not for distribution to the public. For informational use only.                                          534625.
BAI-Webinar "Timberland and Farmland - Alternative and Sustainable Investment Choices"
Attributes of Timberland
and Farmland

                           5
BAI-Webinar "Timberland and Farmland - Alternative and Sustainable Investment Choices"
Why Timberland and Farmland?
Investments in timberland and farmland have historically experienced low volatility and attractive
risk adjusted returns
U.S. Historical Return and Standard Deviation (1996-2020)

                       16%
                                                                                                                      US Private Equity
Annualized Return (%/year)

                       12%
                                                                         Agriculture
                                                                                                                                                               Small Cap Stocks
                                                                          Commercial Real Estate
                             8%                                                                                                          S&P 500
                                                                                                                                                                        Public Forest Products
                                                                          Corporate Bonds
                                               Timberland                                                                                               International Equities
                             4%
                                             Treasury Bills
                             0%                                                                                                                                                      Commodities
                                   0%                 5%                             10%                              15%                               20%                           25%               30%
                             -4%

                                                                                                   Standard Deviation (%/year)

                        Attractive Risk/Return                           Favorable Market                                  Create Long-Term Value                                   Can Deliver Performance
                            Characteristics                               Fundamentals                                                                                                   Sustainably
                             May provide stable total               Increasing consumption                                  Long-lived assets with                                      Sustainability and
                              returns and moderate                trends via global population                             appreciation potential can                               responsible investing can
                             unlevered income with                    and income growth                                   match long-term investment                                enhance value and deliver
                              relatively low volatility                                                                      horizons and provide                                      market rate returns
                                                                                                                                current income

                                                     See sourcing information on page 24                                                                                                                        6

                                                              For Institutional/Investment Professional Use Only. Not for distribution to the public. For informational use only.                             534625.
BAI-Webinar "Timberland and Farmland - Alternative and Sustainable Investment Choices"
Why Timberland and Farmland?
Low correlation with traditional assets and moderate inflation protection in an institutional portfolio

Historical USD Correlations with Agriculture                                                                          Historical USD Correlations with Timber
(1996-2020)                                                                                                           (1996-2020)
                                                             0,67           U.S. Timber/ Agriculture                                                                               0,67
                                          0,22                                         U.S. CPI                                                                    0,23
                                       0,14                                  International Equities                                                              0,16
                       -0,04                                                U.S. Small Cap Stocks                                                -0,05
                       -0,04                                                   U.S. Treasury Bills                                                                        0,43
                   -0,21                                                     U.S. Corporate Bonds                                      -0,27
                                                   0,42                U.S. Commercial Real Estate                                                                              0,55
                       -0,05                                                           S&P 500                                                                   0,14
  -1,0          -0,5           0,0                0,5                 1,0                                      -1,0                 -0,5                   0,0            0,5             1,0

Can Provide Diversification Benefits                              May Help Preserve Value in a                                                Timber and Agriculture Have
          to a Portfolio                                                   Portfolio                                                         Exhibited Moderate Correlation
         Generally uncorrelated with                              May provide inflation protection,                                    Lack of complete correlation can provide
            major asset classes                                  particularly in periods of relatively                                 additional diversification benefits and an
                                                                            high inflation                                            expanded opportunity set within a portfolio

                           Diversification does not guarantee a profit nor protect against loss in any market.
                           See sourcing information on page 24                                                                                                                              7

                                     For Institutional/Investment Professional Use Only. Not for distribution to the public. For informational use only.                                    534625.
Attractive Nominal Total Returns
Acquire and manage timber and agriculture investments to maximize risk-adjusted total
return, generate income, preserve capital investment and realize long-term appreciation

                                                                                 Expected Nominal Total Returns
Appreciation
Real crop and timber price changes
Biological growth                                                                                                                              Permanent
Gains in productivity                                                                                                                          crops       9-11%
Change in land values

Current Income
Rental income from land leases                                                                                                                 Row
Revenue from crop and timber sales                                                                                                             crops    6-10%
Carbon and/or wetland mitigation banking credits
Realizing conservation or higher and better use values

                                                                                                                                               Timber   6-10%

                        For illustrative purposes only. Forecasts are not meant as predictions for any particular asset class, fund or
                        investment vehicle. All expected returns refer to a five+ year horizon and are presented on a nominal
                        basis, unlevered, gross of investment management fees and do not guarantee future results. Actual
                        returns may vary. Potential for profit as well as for loss exists.
                        Source: Forecast from HNRG Research as of December 2020                                                                                    8

                                For Institutional/Investment Professional Use Only. Not for distribution to the public. For informational use only.                534625.
A Hypothetical Combined Timberland and Farmland Portfolio Has Shown
Consistent Return Performance Between 7-11% Over Long Periods of Time
Timberland and farmland tend to perform differently under specific economic and policy conditions

Offsetting each other’s weak performance periods, the simulated blended portfolio produced an average total
return over the three periods of 10.6%
U.S. Real Assets Average Historical Returns
 16,0%     15,2%

 14,0%
                   12,2%
                                                                                                                     11,7% 11,7%                                             11,8%
 12,0%                                                                    11,3%
                                                                                       10,4%
 10,0%                                                                                                                                                                                                9,5%
                                                               8,3%
 8,0%                                                                                                                                          7,3%                                       7,2%

 6,0%
                                4,2%
 4,0%

 2,0%

 0,0%
               U.S. Timber                                         U.S. Agriculture                                    Pro-Forma 50%/50%                                U.S. Commercial Real Estate
                                                                                                                        Timber/Agriculture

                                                                         1976-1990             1991-2009              2010-2020

               The simulation above is theoretical and presented for informational purposes only. The results above are not based on the performance of actual portfolios and do not represent returns any investor actually
               attained. Simulated performance is not an indicator of future actual results. Index data may be indicative of a broad asset class’ historical performance but is not representative of the investment team’s
               methodology or performance.
               Source: Historical annual total return performance for private farmland, timberland and commercial real estate is sourced from the NCREIF property-level indices for U.S. commercial real estate, U.S. farmland,
               and U.S. timberland. Historical timberland performance from 1976 to 1986 is sourced from the Hancock Timber Resource Group (“HTRG”) synthetic indices Hancock Timber Index. Historical farmland
               performance from 1976 to 1986 is constructed and sourced from Morningstar/Ibbotson Associates.
               Pro forma Farmland/Timberland performance is based on aggregate farmland and aggregate timberland assets each representing 50% of the combined portfolio during the entire reported period, and it does not
               include any allocation for “plus” investment-type assets.                                                                                                                                                          9

                                          For Institutional/Investment Professional Use Only. Not for distribution to the public. For informational use only.                                                                     537971.
An Integrated Timberland and Farmland Investment Strategy Expands the
Institutional Investable Universe

Market Value of Investable Core Farmland                                                                   Market Value of Investable Core Timberland
USD1,936 B1                                                                                                USD344 B2
                                Australasia                                                                                                                     Rest of Europe
               Eastern Europe      $72                                                                                           Scandinavia                          $9
                    $80                                                                                                              $20

                                           Brazil
                       Western             $415                                                                                       South America                  US South
                       Europe                                                                                                              $66                         $150
                        $462                                       Canada
                                                                    $90
                                                                                                                Australia
                                                                                                                   $6
                                           United States                                                       New Zealand
                                                                                                                   $13                                  US West
                                               $596                                                                                                       $53
         Other South                                                                                                  Canada
                                                                                                                        $4            US North
          America
                                                                                                                                        $23
            $220

• A combined global investment approach allows greater flexibility in investing capital by taking advantage
   of differences in regional market dynamics
• Regional overlap between the investable universes for timberland and farmland may promote greater
   regional scale, operational, administrative and governance efficiencies
• Uncorrelated markets in expanded investable universe may provide diversification benefits
                            1Sources: HNRG Research as of March 2021 United States: Agriculture Census 2017, USDA Land Values 2020, NCREIF 2020, Canada: Agriculture Census 2016, 2018 Statistics
                            Canada, Australia: ABARES, HNRG 2018, Western and Eastern Europe: Agriculture Census 2017, Eurostat 2019, Brazil: Agriculture Census 2017, Secretary of Agriculture and Supply
                            2020, Argentina Agriculture Census 2018, Savills Global Farmland Index, Uruguay: Agriculture Statistics 2020, New Zealand: Agriculture Census 2017, Reinz January 2021, Stats NZ
                            2017 Chile: Annual Statistics 2019/20, GPS Property 2019, HAIG 2020, ODEPA 2019/2020
                            Australasia includes: Australia, New Zealand; Other South America includes: Argentina, Chile, Uruguay; Western Europe includes: Belgium, Denmark, Germany, Ireland, Greece, Spain,
                            France, Italy, Luxembourg, Netherlands, Austria, Portugal, Finland, Sweden, United Kingdom; Eastern Europe includes: Bulgaria, Czech Republic, Poland, Romania
                            2 Source: HNRG Research as of September 2017. “Rest of Europe” includes Baltics, England, Ireland and Poland. “South America” includes Brazil, Chile and Uruguay. “Scandinavia”
                            includes Finland, Sweden and Norway. “U.S. West” includes U.S. West Coast, West Inland and California. “U.S. North” includes U.S. Northeast and U.S. Lake States.                    10

                                      For Institutional/Investment Professional Use Only. Not for distribution to the public. For informational use only.                                                        537971.
Diversifying Portfolios Can Improve Risk Efficiency
Seek to mitigate risk with an investment strategy focused on building sustainable, diversified
portfolios
 Risks                                                              Mitigating Factors
Timber and agriculture commodity price volatility                   Portfolio diversification, active management
Harvest volume (fire, disease, pest)                                Modern silviculture/farming techniques, species and crop type diversification
Property value/liquidity                                            Disciplined underwriting and comprehensive due diligence
                                                                    Extensive due diligence on water quality and quantity, access to surface
Water availability
                                                                    and subsurface water, asset selection, geographic diversification
Weather                                                             Diversification, modern silviculture/farming techniques and technology
Credit default/lease collection                                     Extensive tenant due diligence, required rental pre-payment, letters of credit

                           No investment strategy or risk management technique can guarantee returns or eliminate risk in any
                           market environment. Diversification does not guarantee a profit nor protect against loss in any market.                      11

                                  For Institutional/Investment Professional Use Only. Not for distribution to the public. For informational use only.   534625.
Sustainability and Responsible Investing
Managing natural resources allows us to focus on areas where meeting environmental and/or
social needs can offer commercial growth opportunities

        Products                                                                                                    Process
          Sustainable Food                                                  Climate Stability                                                           People Empowerment
                                                                            • Create carbon sequestration                                               • Create jobs in rural
          We produce healthy                                                                                                                              communities
                                                                              opportunities
          nutritious foods such as                                                                                                                      • Promote safe and healthy
                                                                            • Invest in renewables and
          nuts, fruit, and vegetables                                                                                                                     working and living
                                                                              energy efficiency
          consistent with planetary                                                                                                                       environments
                                                                            • Sponsor climate change
          health1                                                                                                                                       • Promote diversity, equity,
                                                                              research through MIT2
                                                                                                                                                          and inclusion (DE&I)

          Sustainable Fiber                                                                                                                             Community Prosperity
                                                                             Ecosystem Resiliency
                                                                                                                                                        • Promote community
          We produce sawtimber                                               • Protect sensitive lands,
                                                                                                                                                          engagement through
          used in housing and                                                  biodiversity, threatened &
                                                                                                                                                          volunteering and matching
          pulpwood used in paper &                                             endangered species
                                                                                                                                                          employee donations
          hygiene products                                                   • Create conservation easements
                                                                                                                                                        • Offer recreational land use
                                                                             • Sponsor working lands
                                                                                                                                                        • Implement vendor code of
                                                                               conservation organizations
                                                                                                                                                          conduct and human rights
                                                                                                                                                          focus
                                                                             Watershed Protection
                                                                             • Implement water use efficiency
                                                                               practices
                                                                             • Utilize ground storage to
                                                                               capture rain and flood waters
                                                                             • Healthy forests maintain and
                                                                               may improve water quality

                 As of December 31, 2019
                 Source: United Nations Department of Public Information Sustainable Development Knowledge Platform, https://sustainabledevelopment.un.org
                 1 https://eatforum.org/content/uploads/2019/01/EAT-Lancet_Commission_Summary_Report.pdf
                 2 https://globalchange.mit.edu/sponsors/current
                                                                                                                                                                                        12

                                  For Institutional/Investment Professional Use Only. Not for distribution to the public. For informational use only.                                   537971.
Natural Climate Solutions are critical to achieving net zero goals
Contribution of natural climate solutions (NCS) to stabilizing warming to below 2 °C.

• Annual reductions of 15                                               Total CO2 Mitigation Needed to Stabilize Global
  gigatons or 7.6% every                                                                   Warming
  year to meet a 1.5 °C goal1

• As a comparison, global
  emissions during the
  pandemic fell by 6.4%2                                                                                                            NCS

    Natural climate solutions can provide 37% of cost-effective CO2 mitigation
                               needed through 2030
                   Sources:

                   https://www.wbcsd.org/Programs/Climate-and-Energy/Climate/Natural-Climate-Solutions
                   1 https://unfccc.int/news/cut-global-emissions-by-76-percent-every-year-for-next-decade-to-meet-15degc-paris-target-un-

                   report#:~:text=On%20an%20annual%20basis%2C%20this,the%202%C2%B0C%20goal.
                   2 https://www.nature.com/articles/d41586-021-00090-3                                                                             13

                              For Institutional/Investment Professional Use Only. Not for distribution to the public. For informational use only.        534757
Low-cost climate change solution
Forest carbon and agriculture removals occupy lowest end of carbon sequestration cost curve

Carbon sequestration cost curve (US$/ton MgCO2e) and the GHG emissions abatement potential (TGCO2e/yr)

                                                                                                                                                                                 100

                                            3500
                                                                                                                                                                                 90

                                            3000                                                                                                                                 80
             CO2e sequestration potential

                                                                                                                                                                                 70

                                                                                                                                                                                       $/ton CO2e sequestered
                                            2500
                                                                                                                                                                                 60

                                            2000
                                                                                                                                                                                 50

                                            1500                                                                                                                                 40

                                                                                                                                                                                 30
                                            1000
                                                                                                                                                                                 20

                                             500
                                                                                                                                                                                 10

                                               0                                                                                                                                 0
                                                     Avoided Forest                   Natural Forest                 Cropland Nutrient                  Conservation
                                                      Conversion                      Management                       Management                        Agriculture

                                                          Maximum Additional Mitigation Potential (TgCO2E yr)                                    Cost ($/ton MgCO2e)

                                                   Source: https://www.pnas.org/content/pnas/suppl/2017/10/11/1710465114.DCSupplemental/pnas.1710465114.sapp.pdf                                                14

                                                           For Institutional/Investment Professional Use Only. Not for distribution to the public. For informational use only.                                       534757
Market Outlook
Economic Backdrop
Revived Economic Growth Boosts Commodity Demand, but Rasies Inflation Concerns

U.S. economy remains on track for robust 2021
      • Successful vaccine roll-out, easing of
                                                                                      US experiences a surge in Inflation 2021 Q1
        restrictions and revival of service economy
      • Monetary and fiscal policy remain strongly
        supportive
      • Rising employment and Covid-boosted
        savings
      • 6.4% (annual rate) GDP growth in Q1

Global growth prospects moderated by:
     • Vaccination rates lagging the U.S.
     • Depleted supply chains and logistical
        bottlenecks
     • China’s economic recovery decelerates

U.S. April CPI (4.1% y-o-y), highest since GFC
      • Pent-up, stimulus-enabled demand                                                Source: US Bureau of Labor Statistics
      • Gaps in supply chains
      • Tight job markets and rising wages
      • Weakening USD

                                                                                                                                               16

                         For Institutional/Investment Professional Use Only. Not for distribution to the public. For informational use only.   537971.
Farmland
Snapshot                                  U.S. On-Farm Prices (USD per Bushel)
                                                              Soybeans               Corn            Soybean Forecasts                    Corn Forecasts
                                             $15
After strong gains in Q1 2021,
prices ease:                                 $12
Expanded planting, good weather                $9
conditions, record soybean harvest
in Brazil                                      $6
                                               $3
Recovery in gasoline demand
                                               $-
and prices translate into                           2019 2019 2019 2019 2020 2020 2020 2020 2021 2021 2021 2021 2022
support for corn demand and                          Q1 Q2 Q3 Q4 Q1 Q2 Q3 Q4 Q1 Q2 Q3 Q4 Q1
price in 2021-2022
                                            U.S. Gasoline Consumption (Billion USD)

Broadening improvement in                    400

global economic conditions in
                                             300
2022-2023 will support healthy
demand for ag products
                                             200
Global demand should remain
                                                                                                         2018            2019            2020            2021
strong, despite higher prices
                                             100

                                                0

                                     Sources: USDA NASS April 2021, USDA Bureau of Economic Analysis April 2021, Price forecasts are from Capital Economics and as of
                                     May 2021                                                                                                                           17

                                                                                                                                                                        537971.
Drivers of Agriculture Investment in Current Climate
Agriculture and food sectors poised for robust growth post-COVID

                     Tailwinds
 • Overall demand for food products will benefit
    from strong post-COVID economic recovery                                         Real Per Capita GDP Growth – Annual % Change to 20251

 • Global GDP per capita and per capita income
    to regain forward momentum
     • Stronger GDP and income drive improved
        and more sophisticated diets
 • Limitations on land available for cultivation
    and water resources
 • Sustainable agricultural management
    provides additional incentives for investors

                     Headwinds
 • Global production expansion intensifies
    exports market competition
 • Sporadic African Swine Fever outbreaks
    clouds China’s growing demand for feed
    crops

                      The information in this slide may contain projections or other forward-looking statements regarding future events, targets, management discipline or other
                      expectations, and is only as current as of the date indicated. There is no assurance that such events will occur, and may be significantly different than that
                      shown here.1Source: International Monetary Fund, 2020                                                                                                            18

                               For Institutional/Investment Professional Use Only. Not for distribution to the public. For informational use only.                                     537971.
Timberland
Fundamentals                                                       Monthly Total US Housing Starts (SAAR millions)

Remain Strong
                                        2000
                                                                                      Single      Multi Family
                                        1800
                                        1600
                                        1400
Surge in Construction Activity          1200

Encounters Bumpss in Q2                 1000
                                         800
High prices, limited availability and
                                         600
delayed delivery of building
                                         400
materials and appliances; labor
                                         200
shortages; cost-push adding to              0
rising new home prices                       Jan-15 Jul-15 Jan-16 Jul-16 Jan-17 Jul-17 Jan-18 Jul-18 Jan-19 Jul-19 Jan-20 Jul-20 Jan-21

Forest Product Prices Remain              Source: US Census Bureau as of April 2021

Near All Time Highs
                                                                                  Prices – U.S. Solid Wood Products
Strong profit margins
                                        $1.600
trigger another round of
investment in U.S. South lumber         $1.400
                                                                 Plywood                 OSB             Lumber Index
mills                                   $1.200
                                        $1.000
Impact of Strong Forest                  $800
Product Prices on Timber                 $600
Values Delayed                           $400
Limits on regional mill capacity and
                                         $200
ample timber supplies moderate
2020 timber price increases                 $0

                                               Source: Source: Random Lengths – Lumber Index = RL composite lumber index. $/MBF
                                               Southern Plywood =CDX/S.W. 15/32 3ply R/L, $/MSF
                                               OSB = N. Central 7/16 R/L, $/MSF
                                                                                                                                          19
                                               Data as of 5/20/2021
                                                                                                                                               535734
Drivers of Timber Investment in Current Climate
Timber and forest products less exposed than other sectors to COVID-19 economic down-turn

                             Tailwinds
 • COVID motivated shift to Working From Home                                                       U.S. Housing Markets Poised for a Multi-Year Boom1
   boosts demand for expanded/reconfigured                                                          (SAAR new residential construction in the U.S., millions)

   living-space, particularly in the U.S., resulting                                                   2,5
   in rising demand for lumber, wood panels and
                                                                                                       2,0
   timber
                                                                                                       1,5
 • Record wood product prices, boost profitability
   for producers of building products and trigger                                                      1,0
   investments in expanded mill capacity
                                                                                                       0,5
 • Efforts to reduce greenhouse gas emissions
   favor new wood-based building systems for                                                           0,0
   multi-story construction

                                                                                                              2000
                                                                                                              2001
                                                                                                              2002
                                                                                                              2003
                                                                                                              2004
                                                                                                              2005
                                                                                                              2006
                                                                                                              2007
                                                                                                              2008
                                                                                                              2009
                                                                                                              2010
                                                                                                              2011
                                                                                                              2012
                                                                                                              2013
                                                                                                              2014
                                                                                                              2015
                                                                                                              2016
                                                                                                              2017
                                                                                                              2018
                                                                                                              2019
                                                                                                              2020
                                                                                                              2021
                                                                                                              2022
                                                                                                              2023
                                                                                                              2024
                                                                                                              2025
                            Headwinds

 • Large inventory of saw log timber in U.S. South
 • Spruce-beetle infestation in Europe and
   associated salvage harvests continue to
   elevate regional supply level

               1   Source: Forest Economic Advisors, End Use Quarterly Forecast, Feb 2021
               2 Source:   Random Lengths – Lumber Index = RL composite lumber index. Jan 2021                                                                  20

                                      For Institutional/Investment Professional Use Only. Not for distribution to the public. For informational use only.       537971.
Strong Fundamentals for U.S. Housing Extend into the 2020s
Demographics and Housing Deficit
                                                                   US Population by Age Millions

                   6
                   5
                   4
         Million

                   3                           Peak Age Groups in 2019:
                   2                             28- and 29-Year-Olds
                   1
                   0
                       12
                       15
                       18
                       21
                       24
                       27
                       30
                       33
                       36
                       39
                       42
                       45
                       48
                       51
                       54
                       57
                       60
                       63
                       66
                       69
                       72
                       75
                       78
                       81
                       84
                       87
                       90
                       93
                       96
                       99
                        0
                        3
                        6
                        9

                                          Cumulative Over- / Underbuilding of Conventional U.S. Homes
                                                                   (Millions)
            3
            2
            1                                                       Overbuilding
            0
           -1
           -2                                                                                                            Underbuilding
           -3
           -4
           -5
            1995                           2000                         2005                          2010                         2015                        2020

                       Sources: US Census Bureau as of July 1, 2019, FEA as of September 2020                                                                         21

                                         For Institutional/Investment Professional Use Only. Not for distribution to the public. For informational use only.               535734
Medium and Longer-Term Trends Support Timberland and Farmland
Positive economic fundamentals and shift to a decarbonized world

Return to Global Economic Expansion

   •   Rising per capita income in developing and emerging economies supports expanded demand for
       higher value, healthier foods

   •   Strong fundamentals for U.S. housing based on demographics and deficient stock of housing

Climate Change Mitigation and Adaptation

   •   Significant opportunities to achieve reduced agricultural greenhouse gas emissions and more efficient
       use of limited resources (energy, land, water) by deployment of ag tech, genetics and improved crop
       management

   •   Timberland and Farmland can contribute to climate-change mitigation with carbon capture and storage
       in forests, wood-products, and farmland soils.

   •   Innovative wood-based construction systems open new tiers of demand for wood products, multi-story
       residential and non-residential buildings, and provide a low-carbon alternative to steel/concrete

                Source: HNRG Research June 2021                                                                                                       22

                                For Institutional/Investment Professional Use Only. Not for distribution to the public. For informational use only.   537971.
Thank You!
Michael Strzelecki, CFA      Keith Balter
Managing Director & Senior   Managing Director, Head of
Portfolio Manager            Economic Research
E mstrzelecki@hnrg.com       E kbalter@hnrg.com
T 00 1 617 747 1501          T 00 1 617 747 1682
M 00 1 617 467 8467          M 00 1 857 260 0035
Notes
              Sources
              Slide 6 Sources: Data for Timberland refer to the NCREIF Timberland Index as of 12/31/20. Data for Farmland refer to the NCREIF Farmland Index
              as of 12/31/20. Data for Commercial Real Estate refer to the NCREIF Property Index as of 12/31/20. Data for Small Cap Equities refer to the Ibbotson
              series IA SBBI U.S. Small Stock TR USD as of 12/31/20. Data for Non U.S. Equities refer to the MSCI/EAFE International Equities Index as of
              12/31/20. Data for Corporate Bonds refer to the Ibbotson series IA SBBI U.S. LT Corp TR USD as of 12/31/20. Data for U.S. Treasury Bills refer to
              the Ibbotson series IA SBBI U.S. 30 Day Tbill TR USD as of 12/31/20. Data for the CPI refer to the U.S. Bureau of Labor Statistics as of 12/31/20.
              The S&P 500 series is from Standard & Poor’s Financial Services LLC as of 12/31/20. Data for U.S. Private Equity refers to the Cambridge
              Associates Private Equity Index as of 12/31/19. Data for U.S. Forest Products refer to the S&P Composite 1500 Paper and Forest Products series as
              of 12/31/2020.
              Slide 7 Sources: Data for Timberland refer to the NCREIF Timberland Index as of 12/31/20. Data for Farmland refer to the NCREIF Farmland Index
              as of 12/31/20. Data for Commercial Real Estate refer to the NCREIF Property Index as of 12/31/20. Data for Small Cap Equities refer to the Ibbotson
              series IA SBBI U.S. Small Stock TR USD as of 12/31/20. Data for Non U.S. Equities refer to the MSCI/EAFE International Equities Index as of
              12/31/20. Data for Corporate Bonds refer to the Ibbotson series IA SBBI U.S. LT Corp TR USD as of 12/31/20. Data for U.S. Treasury Bills refer to
              the Ibbotson series IA SBBI U.S. 30 Day Tbill TR USD as of 12/31/20. Data for the CPI refer to the U.S. Bureau of Labor Statistics as of 12/31/20.
              The S&P 500 series is from Standard & Poor’s Financial Services LLC as of 12/31/20.

                                                                                                                                                                        24

MSTR-498701                                       For Institutional/Investment Professional Use Only. Not for distribution to the public. For informational use only.
You can also read