Basics of atmospheric circulation (as a premise to understand oceanic circulation) - Web server per gli utenti dell ...
←
→
Page content transcription
If your browser does not render page correctly, please read the page content below
Basics of atmospheric circulation (as a premise to understand oceanic circulation)
The Earth can be considered as a physical system with an energy budget
that includes all gains of incoming energy and all losses of outgoing energy.
The planet is approximately in equilibrium, so the sum of the gains is
approximately equal to the sum of the losses.

Of the incoming solar energy = 100%, 6% is reflected from the atmosphere
+ 20% is reflected from clouds + 4% is reflected from the ground (including
land, water and ice) + 51%
is absorbed by land and
water, then transferred
into the atmosphere
(different ways) and then
reradiated into space
+ 19% is absorbed by
the atmosphere and
clouds, then reradiated
into space = 100%
outcoming energy.

(Note: this is the net
budget excluding the
greenhouse effect)
Earth’s zonal climate. The energy that reaches the Earth’s surface is
distributed and absorbed/reflected over the globe as function of the angle
L at which sunlight strikes the Earth, which varies by location, time of day,
and season.

           a

      c

c = a / sinL setting a = 1 km
for L = 90°, c = 1 km
for L = 45°, c = 1.4 km
for L = 30°, c = 2 km
This implies that at high latitudes and/or during winter times, the same
amount of solar energy is spread over larger areas than at low latitudes
and/or during summer times.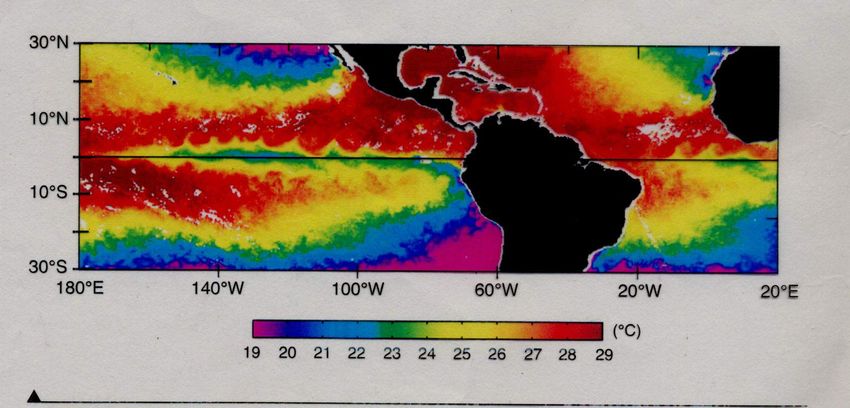
This dependance of the absorbed energy distribution on the angle at which
sunlight strikes the Earth is responsible for higher amounts of annually
absorbed solar energy per unit area at low latitudes (30°S–30°N) than at
high latitudes (blue line). The outgoing terrestrial radiation per unit area varies
less with latitude (it actually decreases slightly at the equator for the reduced
albedo effect of pluvial forests). This creates a positive energy budget at
low latitudes (more solar energy is adsorbed than radiated back to space)
and a negative budget at high latitudes.
The Greenhouse Effect
Of the total amount of energy available at the top of the atmosphere (TOA),
about 50% is absorbed at the Earth's surface and re-radiated upward as
infrared (IR) thermal radiation.

A greenhouse gas (H2O,
CO2) is a gas in an
atmosphere that absorbs and
emits radiation within the
thermal infrared range.

Without CO2, Earth's
greenhouse effect would
collapse as water vapor
would quickly precipitate from
the atmosphere, plunging the
Earth into an icebound state
The 51% of energy that reaches the Earth’s surface and that is
transferred into the atmosphere as IR before being lost to space controls the
thermal state of the lower atmosphere as described by the ideal gas law.

The ideal gas law links pressure, density, and temperature of a gas (e.g., air):
        P = r RspecT
where r is density g/cm3, Rspec = R / M where R is the gas constant =
8.314472 J/mol K and M = molar mass (g/mol) (the mole is defined as the
amount of substance that contains as many elementary entities (e.g., atoms,
molecules) as there are atoms in 12 g of the isotope carbon-12 (12C). Thus,
by definition, one mole of pure 12C has a mass of exactly 12 g.)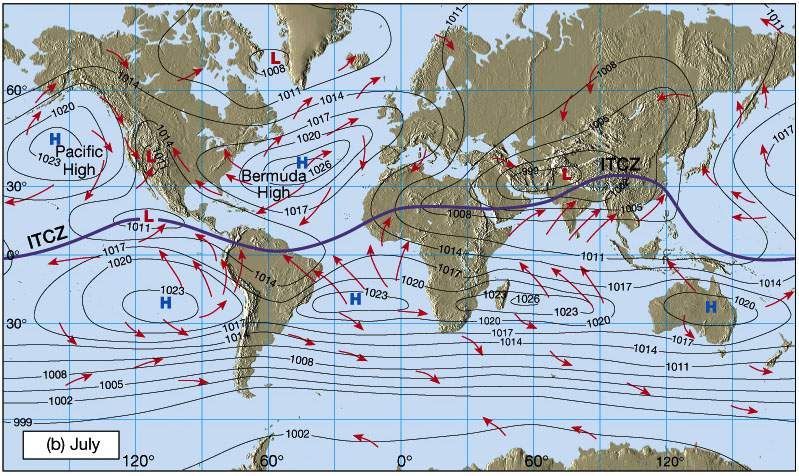
For what we’ve seen before, we would have, on an hypothetical non-
rotating planet, low pressures on the equator and high pressures at high
latitudes causing winds to blow from the poles to the equator on the
surface and from the equator to the poles at higher altitudes

                                                        High pression

                                                            Low pression

                                                       High pression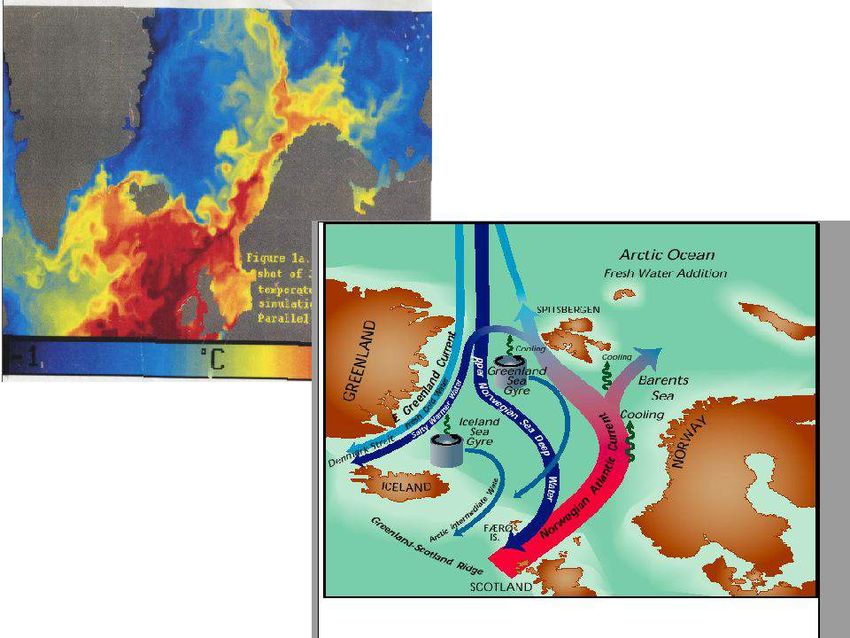
…but the Earth rotates around its axis…

The Coriolis effect arises when Newton's laws are transformed to a rotating
frame of reference. Coriolis force is a consequence of inertia, the resistance
of any physical object to a change in its state of motion or rest, or the
tendency of an object to resist any change in its motion. The Coriolis force
disappears in a non-rotating, inertial frame of reference.

 The Coriolis force causes moving objects on the surface of the Earth to
 appear to veer to the right in the northern hemisphere, and to the left in the
 southern. Rather than flowing directly from areas of high pressure to low
 pressure, as they would on a non-rotating planet, winds and currents tend
 to flow to the right of this direction north of the equator, and to the left of
 this direction south of it. This effect is responsible for the rotation of large
 cyclones
Intuitive explanation
The Earth's rotation causes the surface to move fastest at the equator, and
not at all at the poles. A bird flying from the equator to the north maintains its
faster eastward motion as objects sitting on the equator; as it moves to the
north, it goes east faster than the earth beneath it, and the bird's flight curves
eastward slightly. In general: objects moving away from the equator curve
eastward; objects moving towards the equator curve westward. Flying objects
deflect to the right in the northern hemisphere and to the left in the
southern hemisphere.

In meteorology, a rotating frame (the Earth) with its Coriolis force proves a
more natural framework for explanation of air movements than a
hypothetical, non-rotating, inertial frame without Coriolis forces.
For winds moving N-S:
                                             Where m is the mass of the
                                             particle, v is the velocity of the
               Fc = 2mvwsinf                 particle (m/sec), and w is the
                                             angular velocity of Earth
                                             (7.27*10E-5 rad/sec) and f is the
                                             latitude.
Setting mass m = 1 kg and velocity v = 1m/s:
At the equator (f = 0), Fc = 0; at 45°, Fc = 1.2 *10-4 N; at the Pole, Fc =
1.3*10-4 N. (gravity = 9.8 N). In N hemisphere, Fc is to the right of v; in S
hemisphere, Fc is to the left of v (left hand rule).
The balance between the Coriolis effect and the pressure gradient force produces geostrophic wind. The geostrophic wind is directed parallel to isobars (lines of constant pressure at a given height). This balance seldom holds exactly in nature. The true wind almost always differs from the geostrophic wind due to other forces such as friction from the ground. Thus, the actual wind would equal the geostrophic wind only if there were no friction and the isobars were perfectly straight. Despite this, much of the atmosphere outside the tropics is close to geostrophic flow much of the time and it is a valuable first approximation.
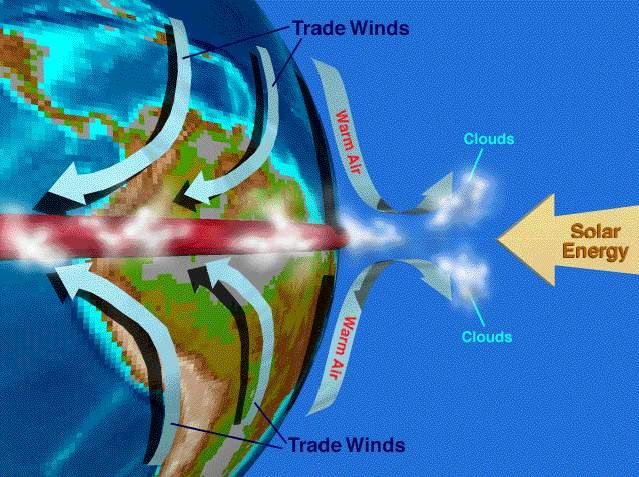
The geostrophic interaction between pressure gradient and Coriolis force
generates zonally distributed trade winds and jet streams arranged in
Hadley cells. Between 30°N and 30°S latitude, atm circulation is relatively
simple, with rising motion near the equator, poleward motion near the
tropopause, sinking motion in the subtropics, and an equatorward return flow
near the surface. Near the tropopause, as the air moves
polewards in the Hadley cell it
is turned eastward by the
Coriolis effect, which turns
winds to the right in the
Northern hemisphere and
to the left in the Southern
Hemisphere, creating the
subtropical jet streams that
flow from west to east.
Analogously, near the
surface, the equatorward
return flow is turned to the
west by the Coriolis effect.
These resulting surface winds
are referred to as the trade winds.
..as the air moves polewards in the Hadley cell it is turned to the right in the
Northern hemisphere and to the left in the Southern Hemisphere, reaching
geostrophic ~balance (little friction at that altitude) and creating the subtropical
jet streams that flow from west to east. Analogously, near the surface, the
equatorward return flow is turned to the west by the Coriolis effect (trade
winds).
The Intertropical Convergence Zone (ITCZ): where the trade
winds of the Hadley cells meet.
The zonal climate
controls the distribution
of ecosystems and
vegetation
The dynamic theory of Monsoon

During the northern Summer (May and June), the ITCZ moves northwards,
along with the vertical sun, towards the Tropic of Cancer. With the ITCZ at the
Tropic of Cancer, the South East Trade winds of the Southern Hemisphere
have to cross the equator to reach the ITCZ.

However, due to Coriolis effect, these South East winds are deflected to the
right in the Northern Hemisphere transforming into South West trades.

These pick up the moisture
while traveling from sea to
land and cause orographic
rain once they hit the
highlands of the Indian
Peninsula.

This results in
the summer Monsoon.
Global atmospheric circulation
Circolazione Oceanica
Sommario
Temperatura e salinità degli oceani

Circolazione superficiale indotta dai venti

Circolazione termoalina profonda

Interazioni oceano-atmosfera
Gli oceani

Oceano Pacifico: 52% dell’oceano totale, profondità media di 4028 metri;
Oceano Indiano: 20% area, profondità media di 3897 m;
Oceano Atlantico: 25% area, profondità media di 3332 m;
Le parti meridionali dei tre oceani costituiscono l’Oceano Meridionale (Southern
Ocean).
Radiazione entrante e uscente
Temperature superficiali
Evaporazione, Precipitazione, Salinità

                                                Dry

                                                      Wet
                                                     Dry

 La circolazione atmosferica definisce le zone E-P
E-P
Salinità superficiale
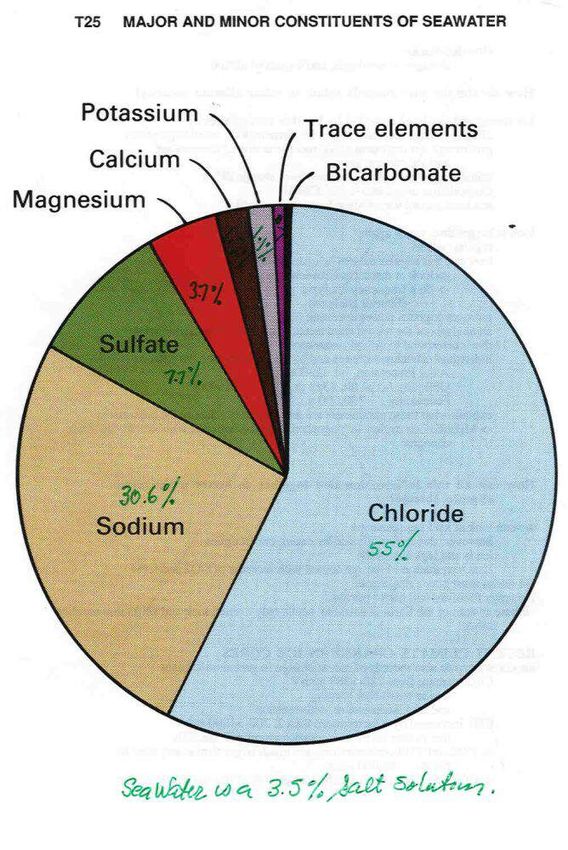
L’acqua marina contiene circa
                                3.49% di sali in soluzione. I
                                costituenti principali sono il Cloro
                                [55%] e il Sodio [30.6%]

La densità dell’acqua
marina è funzione della
temperatura e della salinità.
Densità superficiale
Stratificazione
Acque più calde di 10°C dominano la superficie
fino a ~500 m di profondità. Il decremento di
temperatura in profondità è chiamato termoclino.
Circolazione oceanica
  Esistono due forze che determinano la
  circolazione oceanica:
1. Stress del vento che agisce sulla superficie
   dell’acqua, T = rair Cd W2
  dove rai è la densità dell’aria,, W è la velocità
  del vento a 10 m, e Cd è il “drag coefficient”
2. Variazioni di temperatura e salinità = densità
   (termoalina)
La circolazione indotta dai venti è più
vigorosa di quella termoalina, ma agisce
essenzialmente nel primo km di profondità,
mentre quella termoalina agisce a tutte le
profondità e può causare “overturning” col
quale le acque profonde possono venire a
contatto con l’atmosfera e influenzare
direttamente il clima.

Iniziamo con la circolazione indotta dai venti e poi
passiamo a quella termoalina…
Circolazione superficiale
     indotta dai venti
Venti superficiali
Circolazione
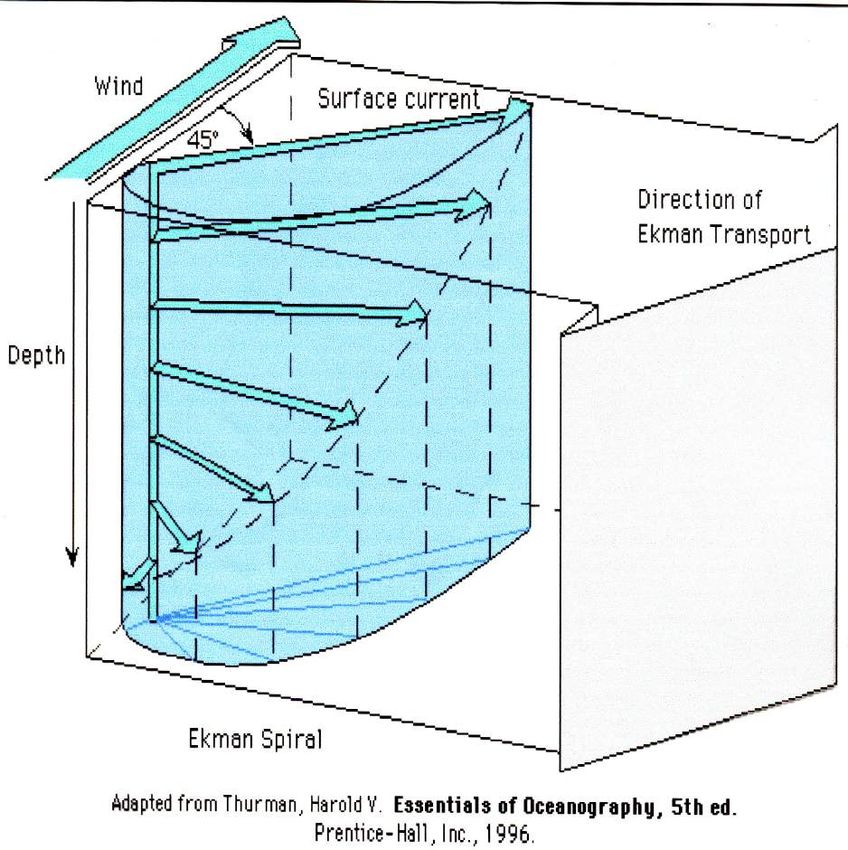
superficialeCome il vento muove l’acqua: La spirale di Ekman
Lo stress del vento
(~velocità del vento2)
agisce sullo strato di
acqua superficiale e
50-200 m
produce trasporto
Ekman L’acqua è
deflessa verso
destra nell’emisfero
N e verso sinistra
nell’emisfero S
PER EFFETTO
DELLA FORZA DI
CORIOLISAnticiclone: ESEMPI EMISFERO NORD area di alta pressione atmosferica. Rotazione oraria dei venti in emisfero nord, antioraria in emisfero sud. Convergenza superficiale+ downwelling Ciclone: area di bassa pressione atmosferica. Rotazione antioraria dei venti in emisfero nord, oraria in emisfero sud. Divergenza superficiale+uwelling
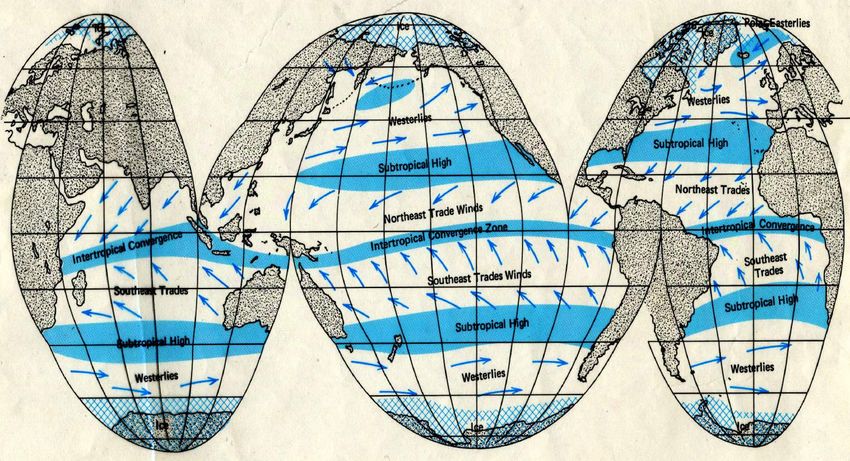
Circolazione oceanica superficiale

    Anticiclone,
    downwelling

             Anticiclone,
             downwelling
“valli” e “rilievi” sulla superficie degli oceani
Gli Alisei (Trade Winds) e la Zona di
          Convergenza Intertropicale
   (Intertropical Convergence Zone, ITCZ)

ITCZ
Upwelling equatoriale. I venti all’equatore provengono da oriente.
Per effetto dell’inversione della forza di Coriolis attraverso
l’equatore, il trasporto di Ekman è verso i poli in entrambi gli
emisferi. In altre parole, la circolazione oceanica superficiale è
divergente all’equatore. Per compensare la divergenza, acqua
profonda fredda viene richiamata in superficie (upwelling).
Trasporto di Ekman
upwelling
X EQ
ventoUpwelling equatoriale
Divergenza di Ekman e temperature superficiali
…Circolazione oceanica superficiale
Anticiclone,
downwelling
Divergenza, upwelling
Anticiclone,
downwelling
Divergenza, upwellingCircolazione oceanica profonda North Atlantic Deep Water (NADW) Antarctic Bottom Water (AABW)
Densità dell’acqua marina
           (dovuta a salinità e temperatura)

Circolazione termoalina dovuta a variazioni di temperatura
e salinità = densità. Le acque più profonde e fredde derivano le
loro proprietà dall’esposizione in superficie alle alte latitudini.
Corrente del Golfo e NADW
Perchè le acque subtropicali sono salate:
                 E-P
Acque superficiali calde e salate si raffreddano muovendosi verso N e affondano, muovendosi quindi verso S a ~2-4 km di profondità
Sezione N-S del bacino atlantico

L’acqua profonda si forma alle alte latitudini settentrionali
e meridionali
Corrente Circumantartica e AABW

   Anticiclone,
   downwelling

    Divergenza, upwelling

            Anticiclone,
            downwelling

        Divergenza, upwelling
Formazione di acque profonde antartiche
The Global Ocean Conveyor
The Great Ocean Conveyor Belt
Sommario
La circolazione profonda (>1 km) risulta da
    cambiamenti di densità delle acque.
Acque calde e salate tropicali si raffreddano
    muovendosi verso N (Corrente del Golfo).
Il raffreddamento di acque salate causa
    aumento di densità e affondamento, e
    movimento in profondità verso S (NADW).
Nell’Oceano Meridionale si ha formazione di
    AABW.
Interazioni Oceano-Atmosfera ENSO El Nino/La Nina North Atlantic Oscillation
El Nino/La Nina
Condizioni ‘normali’
In condizioni normali i venti tropicali (Alisei)
soffiano in direzione ovest causando
risalita di acque fredde profonde ad est
(upwelling) e accumulo di acque calde
superficiali ad ovest. In prossimità
dell’Indonesia la superficie dell’oceano è
circa 0.5 m più alta che non in Perù e la
temperatura superficiale è di circa 8 °C
più elevata ad ovest che ad est. La
piovosità è connessa con la zona a
temperatura più elevata ad ovest, mentre
la zona est è relativamente più secca.

Condizioni El Niño
Nella fase di El Niño gli Alisei si attenuano.
La massa di acqua calda superficiale
precedentemente accumulata ad ovest
migra verso est con conseguente
abbassamento del termoclino, blocco della
risalita di acque fredde profonde ad est
(upwelling) e migrazione della piovosità
con inondazioni in Perù e siccità in
Indonesia e Australia.
Condizioni ‘normali’
•   Prentice Hall Textbook animation link
Condizioni El Nino
•   Prentice Hall Textbook animation link
Condizioni La Nina
•   Prentice Hall Textbook animation link
https://www.youtube.com/watch?v=DbNzw1CCKHo
The positive NAO index phase
                /The positive NAO index
                phase shows a stronger than
                usual subtropical high pressure
                center and a deep than normal
                Icelandic low.
                /The increased pressure
                difference results in more and
                stronger winter storms
                crossing the Atlantic Ocean on
                a more northerly track.
                /This results in warm and wet
                winters in Europe and in cold
                and dry winters in northern
                Canada and Greenland.
                /The eastern US experiences
                mild and wet winter
                conditions.
                               Martin Visbeck 9 May, 2018
The negative NAO index phase
/The negative NAO index
phase shows a weak
subtropical high and weak
Icelandic low.
/The reduced pressure gradient
results in fewer and weaker
winter storms crossing on a
more west-east pathway.
/They bring moist air into the
Mediterranean and cold
weather to northern Europe.
/The US east cost experiences
more cold air outbreaks and
hence snowy winter
conditions.
/Greenland, however, will
have milder winter
temperatures. Martin Visbeck 9 May, 2018Impacts of the NAO in Europe
/Northern Europe experiences
mild and wet winter during the
positive NAO index phase.
/This has dramatic
consequences for hydro-
electric power generation and
heating oil consumption.
/South-Eastern Europe
receives less rain and hence
causes significant problems
with drinking water supply
and reduced stream flow
volume in the Middle East.
/Harvest yield of grapes and
olives have been shown to
depend significantly on the
NAO. Martin Visbeck 9 May, 2018NAO and Energy in Norway
/Norway experience cold
winters during a negative NAO
phase.
/Heating Oil consumption in
Norway varies by 30% in good
(anti) correlation with the
NAO.
/Correlation with precipitation
results in variability in
hydropower generation.
Martin Visbeck 9 May, 2018The North Atlantic Oscillation
Lugano T medie
Davos T medie
Milano T medie
Basel T medie
Temp medie*.KG
20
15
10
5
0
1860 1880 1900 1920 1940 1960 1980 2000The North Atlantic Oscillation
NAO Milano T medie
NaoTemp
2 15.5
1.5 15
1 14.5
0.5 14
0 13.5
-0.5 13
-1 12.5
-1.5 12
1900 1920 1940 1960 1980 2000You can also read