Bathurst Caribou Range Plan Land Use Scenarios and Economic Considerations - Supporting Report
←
→
Page content transcription
If your browser does not render page correctly, please read the page content below
Bathurst Caribou Range Plan

Supporting Report:

Land Use Scenarios and
Economic Considerations

                              January 2018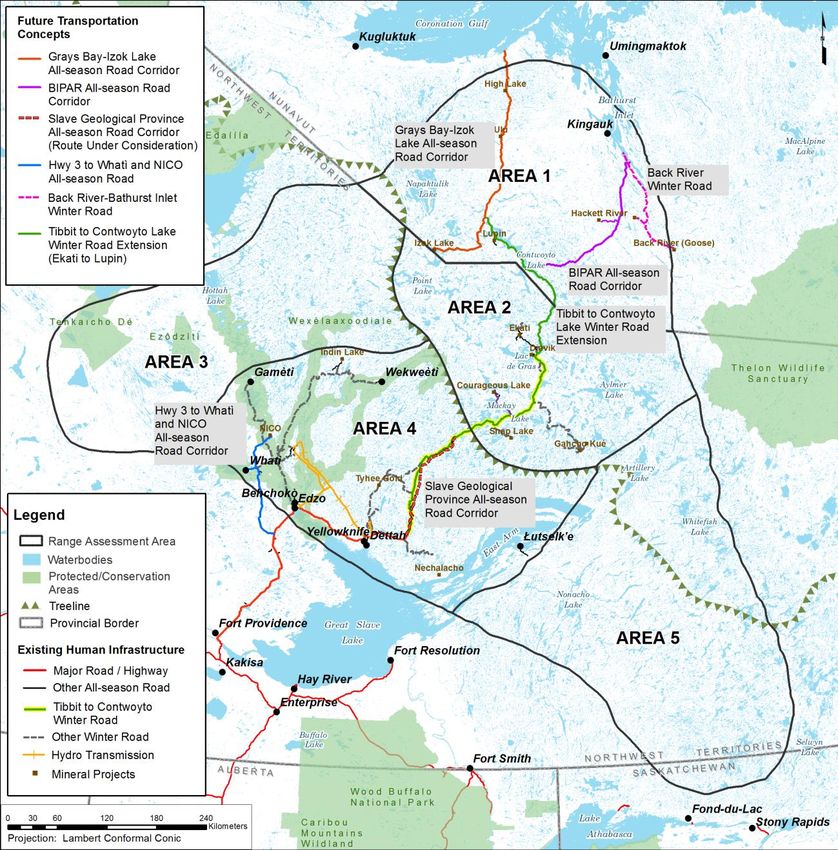
2|Page
Acknowledgements
     The Bathurst Caribou Range Plan (BCRP) Project Team is grateful to community members and
     members of the Working Group who provided generous contributions of time, knowledge,
     insight, guidance, and encouragement. The Project Team is led by Karin Clark (Government of
     the Northwest Territories) and includes Dan Ohlson (Compass Resource Management), Shawn
     Francis (FSR Consulting), John Nishi (EcoBorealis Consulting) and Natasha Thorpe (Trailmark
     Systems/Thorpe Consulting Services).

     The Government of Northwest Territories Department of Environment and Natural Resources is
     serving as overall sponsor of the BCRP. Polar Knowledge Canada is also providing generous
     funding support to the planning process.

Disclaimer
     This is a technical supporting document to the Bathurst Caribou Range Plan (BCRP). It describes
     the methods used and technical information considered or created while developing the BCRP.
     The audience for this report is intended to be technical specialists—a plain language summary
     has not been produced as key information is included in the Plan.

     This report does not represent the results of community engagement nor Government policy
     direction. Separate supporting documents have been created for caribou range assessment
     technical information and traditional knowledge.

     This document should be cited as follows:

             Bathurst Caribou Range Plan, Supporting Report: Land Use Scenarios and Economic
             Considerations. Yellowknife, NT. January 2018.

                                                                                          i|Page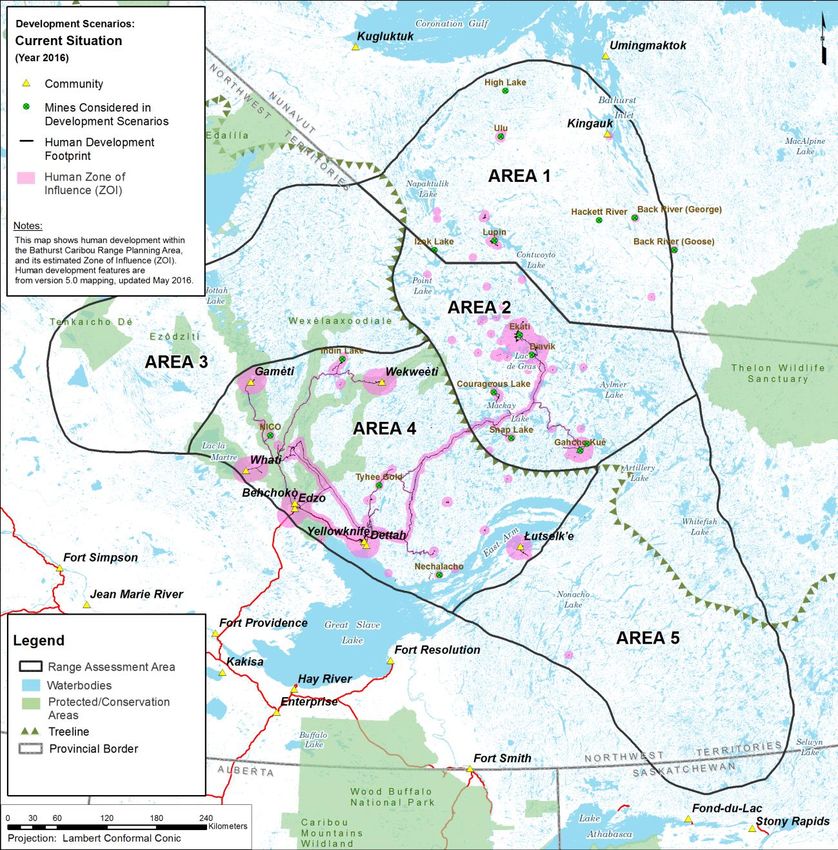
TABLE OF CONTENTS
ACKNOWLEDGEMENTS ........................................................................................................................................... I
DISCLAIMER ............................................................................................................................................................ I
1 INTRODUCTION ............................................................................................................................................. 5
2 APPROACH .................................................................................................................................................... 5
2.1 LAND USE AND DISTURBANCE CONCEPTS...............................................................................................................5
3 CURRENT SITUATION ..................................................................................................................................... 7
3.1 MAJOR LAND USES IN THE BATHURST RANGE .........................................................................................................7
3.1.1 Mineral Exploration and Development ....................................................................................................7
3.1.2 Transportation .......................................................................................................................................12
3.1.3 Hydro Development and Transmission ..................................................................................................12
3.2 CURRENT HUMAN DISTURBANCE .......................................................................................................................14
4 FUTURE SITUATION ..................................................................................................................................... 16
4.1 FUTURE DEVELOPMENT SCENARIOS ....................................................................................................................16
4.2 DISTURBANCE RESULTING FROM FUTURE DEVELOPMENT SCENARIOS ........................................................................19
4.3 ECONOMIC ASSESSMENT OF FUTURE DEVELOPMENT SCENARIOS ..............................................................................21
5 SUMMARY ................................................................................................................................................... 26
5.1 CURRENT SITUATION .......................................................................................................................................26
5.2 FUTURE SITUATION .........................................................................................................................................26
6 REFERENCES ................................................................................................................................................ 27
List of Figures
FIGURE 1: HUMAN DISTURBANCE CONCEPTS—DIRECT FOOTPRINT AND ITS SURROUNDING ZONE OF INFLUENCE (ZOI)............................7
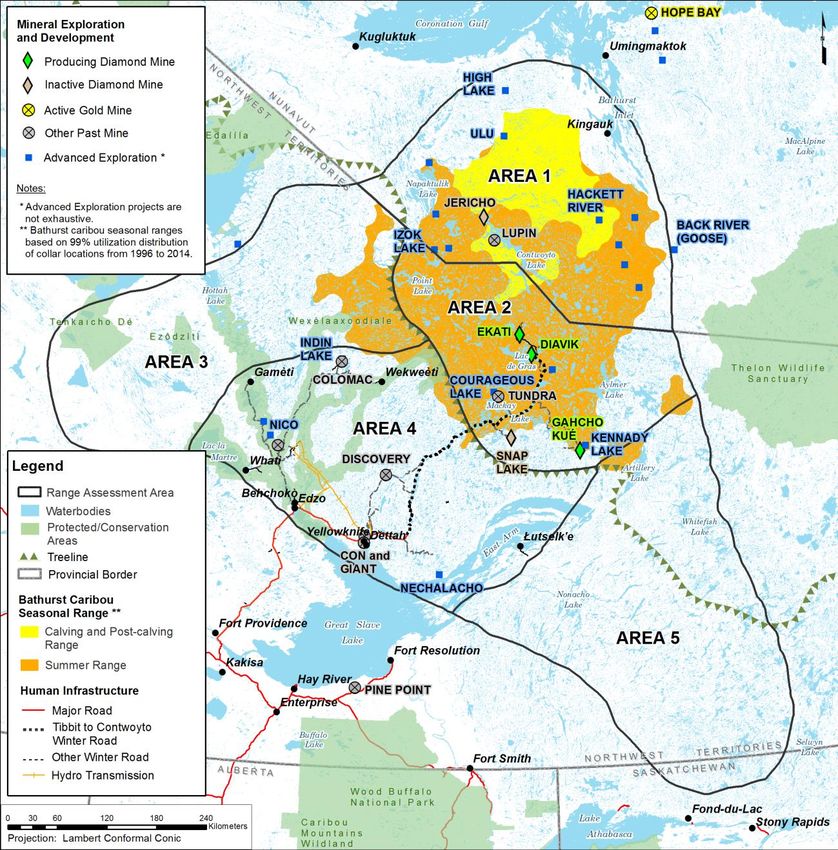
FIGURE 2: PAST MINES, NEW MINES CURRENTLY OPERATING OR UNDER CARE AND MAINTENANCE, AND OTHER ADVANCED EXPLORATION
PROJECTS IN THE BATHURST RANGE. .............................................................................................................................. 9
FIGURE 3: HISTORICAL AND CURRENT MINERAL TENURE ON THE BATHURST RANGE (SOURCE: GOVERNMENT OF NORTHWEST
TERRITORIES, DEPARTMENT OF INDUSTRY, TOURISM AND INVESTMENT, AND NATURAL RESOURES CANADA).................................10
FIGURE 4: THE MINERAL EXPLORATION AND DEVELOPMENT LIFE-CYCLE (SOURCE: GOVERNMENT OF NORTHWEST TERRITORIES,
DEPARTMENT OF INDUSTRY, TOURISM AND INVESTMENT). ..............................................................................................11
FIGURE 5: MAJOR TRANSPORTATION AND HYDRO FACLITIES AND TRANSMISSION LINES IN THE BATHURST RANGE.................................13
FIGURE 6: CURRENT DIRECT AND INDIRECT HUMAN DISTURBANCE IN THE BATHURST RANGE. ...........................................................15
FIGURE 7: DETAILED TIMELINES FOR PROJECTS CONSIDERED IN BCRP FUTURE DEVELOPMENT SCENARIOS. .........................................18
FIGURE 8: POTENTIAL FUTURE HUMAN DISTURBANCE IN THE BATHURST RANGE: CASE 1 (DECLINING DEVELOPMENT), CASE 2
(CONTINUING DEVELOPMENT), AND CASE 3 (INCREASING DEVELOPMENT). ALL MAPS SHOW RESULTS AT YEAR 2040. ................20
FIGURE 9: RAA1 (NUNAVUT) - PROJECTION OF POTENTIAL CHANGE IN GROSS DOMESTIC PRODUCT FOR FUTURE DEVELOPMENT SCENARIO
CASES 1, 2 AND 3. ...................................................................................................................................................22
ii | P a g e
FIGURE 10: RAA1 (NUNAVUT) - PROJECTION OF POTENTIAL CHANGE IN EMPLOYMENT FOR FUTURE DEVELOPMENT SCENARIO CASES 1, 2
     AND 3. ................................................................................................................................................................... 23
FIGURE 11: RAA2 (NWT CENTRAL TUNDRA) - PROJECTION OF POTENTIAL CHANGE IN GROSS DOMESTIC PRODUCT FOR FUTURE
     DEVELOPMENT SCENARIO CASES 1, 2 AND 3. ................................................................................................................. 24
FIGURE 12: RAA2 (NWT CENTRAL TUNDRA) - PROJECTION OF POTENTIAL CHANGE IN EMPLOYMENT FOR FUTURE DEVELOPMENT
     SCENARIO CASES 1, 2 AND 3. ..................................................................................................................................... 24
FIGURE 13: RAA4 (NWT CENTRAL WINTER RANGE) - PROJECTION OF POTENTIAL CHANGE IN GROSS DOMESTIC PRODUCT FOR FUTURE
     DEVELOPMENT SCENARIO CASES 1, 2 AND 3. ................................................................................................................. 25
FIGURE 14: RAA4 (NWT CENTRAL WINTER RANGE) - PROJECTION OF POTENTIAL CHANGE IN EMPLOYMENT FOR FUTURE DEVELOPMENT
     SCENARIO CASES 1, 2 AND 3. ..................................................................................................................................... 25

List of Tables
TABLE 1: OVERVIEW OF BATHURST RANGE PLAN FUTURE DEVELOPMENT SCENARIOS. ....................................................................17

List of Appendices
Appendix A: Land Use Economic Evaluation Methods

                                                                                                                                                              iii | P a g e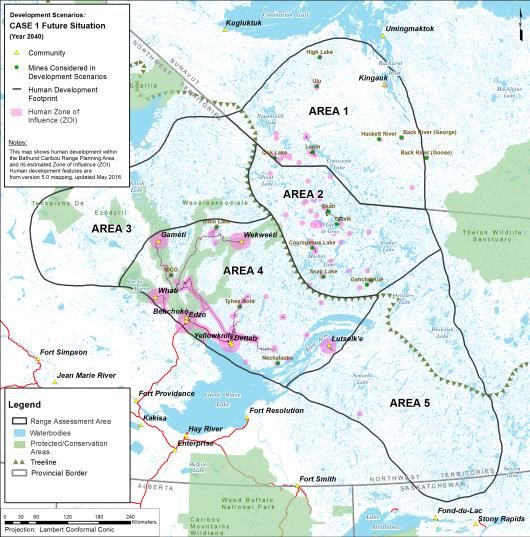
iv | P a g e

1 Introduction

This report is a technical supporting document for the Bathurst Caribou Range Plan (BCRP; the range
plan). It describes the major land uses (mineral exploration and development, transportation and
hydroelectric generation and transmission) in the Bathurst range and their economic considerations.
Both the current and potential future situations are examined. While it is recognized that other
important land uses, such as tourism and recreation, also occur in the Bathurst range, these three land
uses account for the majority of human-caused habitat disturbance outside of communities. Two
companion background documents describe the scientific information (Caribou Range Assessment and
Technical Information Report) and the traditional knowledge (Traditional Knowledge of Caribou and
Caribou People Report) used and considered by the range plan. The Traditional Knowledge Report
provides information on human settlements and traditional economy values.

Current mineral exploration and development activities, and transportation and hydroelectric
generation and transmission infrastructure, were summarized from available literature and mapping.
With the assistance of a Mineral Task Group, the BCRP Working Group defined three future
development scenarios to explore plausible patterns and amounts of development footprint within the
Bathurst range. The purpose of the scenarios was not to attempt to predict the future but to examine
potential levels of range disturbance resulting from different levels of land use activity that could then
be examined as part of the structured decision-making evaluation framework.

2 Approach
The purpose of the BCRP is to recommend measures to reduce caribou habitat disturbance.
Understanding the amount and location of disturbance is therefore important. To provide a baseline
estimate of current human development footprint in the Bathurst range, a human development map
was created from a variety of information sources, including the GNWT Cumulative Impact Monitoring
Program (CIMP) human disturbance database, the National Road Network, and mineral industry-
provided information used to support project assessment and permitting activities. Please see Appendix
A of the Caribou Range Assessment and Technical Information Report for a detailed description of
human development footprint mapping methods. The land use and footprint mapping information was
also used as the basis for creating the future development scenarios.

2.1 Land Use and Disturbance Concepts
Human land use can result in disturbance1 to caribou. Human disturbance effects can be considered as
either direct or indirect. Some land use features, such as roads, settlements or mine sites, have a direct

1
  Disturbance is a temporary or permanent change in environmental conditions that might influence wildlife abundance and
distribution. It is comprised of two aspects: direct disturbance is physical change (e.g. trees cut down or burned) whereas
indirect disturbance is a change to non-physical aspects of the environment (e.g. noise, smell, light, etc.)

                                                                                                                 5|Page
physical footprint that results in habitat loss or alteration. An area of indirect disturbance may exist
around these physical footprints, where noise, dust, smells or other factors influence caribou’s use of
habitat. This area is known as the zone of influence (ZOI). Based on both traditional knowledge and
scientific observation, caribou may avoid these ZOI areas, use them less frequently, or exhibit altered
behavior or have a higher mortality risk from harvest or predation within them.

The ZOI concept can also be understood through the following community perspective:

        The concepts inǫ̀ dè ɂǫ̀ goèhshı̨̀ (the caribou have thrown that land away) is translatable to the
        zone of influence. The forage conditions surrounding the mines are of poor quality and caribou
        chose to avoid the area and instead walk in a different direction, towards areas with no noise
        and better feeding grounds. The TK study for the Diavik Lichen and Soil Sampling Program (TRTI
        2013) concluded that the lichen and vegetation, thus forage areas, were of poor quality for a
        radius of up to 15 kilometres around the mine site of Diavik. Extending from 15 to 30 kilometres,
        the quality of forage improved, but some locations were still impacted by mining activities. The
        amount of caribou activity, such as walking and feeding, increased with further distance away
        from the mine site. The increase in caribou activity correlates with improved caribou forage
        further away from the mine. -- Dedats’eetsa: Tłı̨chǫ Research and Training Institute. May 4 2016:
        63

In GIS mapping, ZOI is estimated as a buffer of a defined distance around the development features
(Figure 1). The ZOI extent around different human development features was estimated based on
literature reviews and values used in recent environmental assessments. ZOI extents assigned to each
human feature type and supporting literature sources are provided in Appendix B of the Caribou Range
Assessment and Technical Information Report.

Figure 1 illustrates concepts for the direct footprint of physical features and its associated ZOI. In this
example the Snap Lake diamond mine is shown; the property is currently under care and maintenance,
and is considered to have a 5 km ZOI surrounding the mine site. Its associated winter road is assigned a
1 km ZOI on either side of the road (2 km total width), which would only be active during the January-
April haul period when the road is in use.

Based on the human development mapping and its associated ZOI extents, the amount of direct and
indirect disturbance within the Bathurst range can be calculated using GIS. How human disturbance
may affect caribou, and the potential effects of different levels of human disturbance on caribou
populations, is explored in both the Caribou Range Assessment and Technical Information Report and
the Traditional Knowledge of Caribou and Caribou People Report.

                                                                                                  6|Page
FIGURE 1: HUMAN DISTURBANCE CONCEPTS—DIRECT FOOTPRINT AND ITS SURROUNDING ZONE OF INFLUENCE
(ZOI).
3 Current Situation
3.1 Major Land Uses in the Bathurst Range
3.1.1 Mineral Exploration and Development
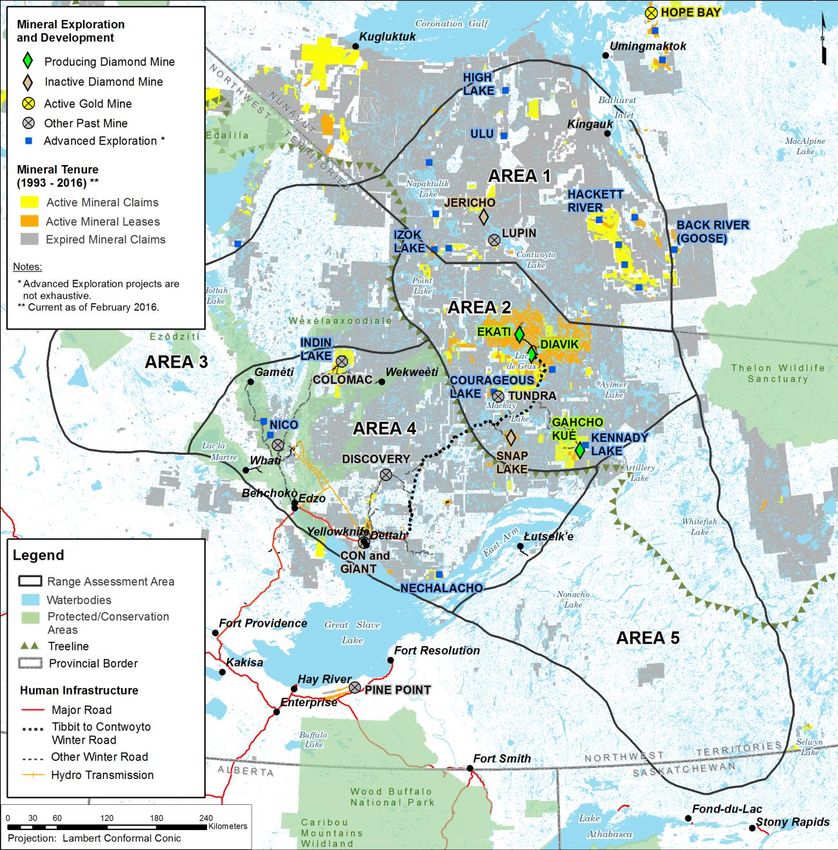
Over the past century, the Bathurst range has experienced a high level of mineral exploration activity
and multiple producing mines. During much of this period, exploration efforts were largely focused on
gold, resulting in the construction of several producing gold mines. These included the Giant and Con
mines near Yellowknife, the Tundra and Colomac mines in other parts of the Bathurst range in
Northwest Territories, and the Lupin mine in Nunavut, near Contwoyto Lake (Figure 2). Silke (2009)
provides a detailed operational history of mines in the Northwest Territories.
However, in 1993, diamonds were discovered in the Lac des Gras region of the Slave Geological Province
in the central Bathurst range, leading to a dramatic increase in the level of mineral exploration in the
central NWT and the Kitikmeot region of Nunavut. A prolonged mineral commodity cycle in the 2000s
also led to increased interest in gold and base metal exploration. During this period from the mid-1990s
to late-2000s, active mineral claims covered most of the central and northern portion of the Bathurst
7|Page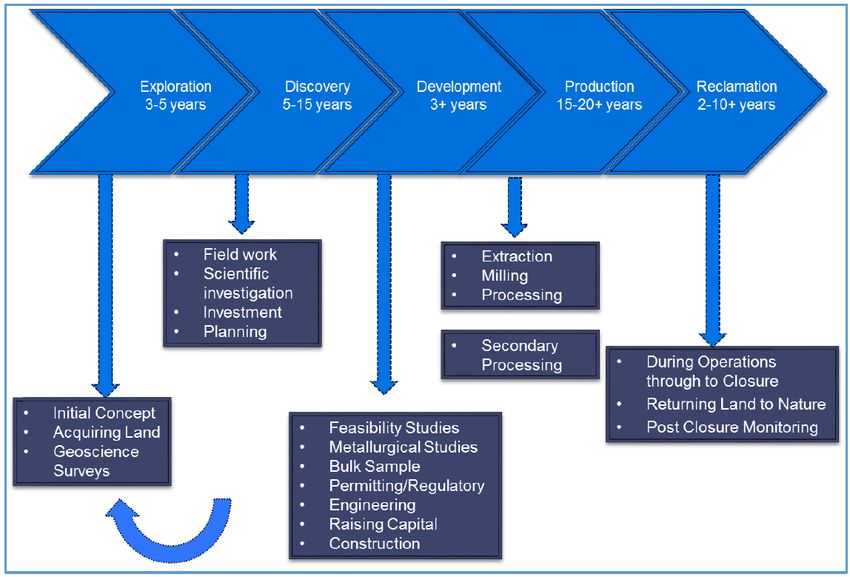
herd range (Figure 3). This large increase in exploration activity was the original source of the
cumulative effects concerns for Bathurst caribou as voiced by community members, regulators and
scientists.

The diamond discoveries resulted in construction of four new diamond mines: Ekati, Diavik and Snap
Lake (all in Northwest Territories), and the Jericho mine in Nunavut (Figure 2). A fifth diamond mine,
Gahcho Kué, also in Northwest Territories, opened in fall 2016. All of these new mines are located
within either the summer or calving and post-calving range of the Bathurst herd. The Jericho diamond
mine in Nunavut operated briefly and is currently abandoned, while the Snap Lake mine was put under
care and maintenance in late-2015. Several advanced exploration properties resulted from this period
including Back River, Hackett River, High Lake and Izok Lake in Nunavut, and Courageous Lake, Indin
Lake and Kennady Lake in Northwest Territories2 (Figure 2).

In recent years, the level of mineral exploration has declined dramatically and active mineral claims and
leases now occupy only approximately 5% of the Bathurst range planning area, with most occurring in
the central Northwest Territories around the three producing diamond mines near Lac de Gras (Figure
3), and specific geological tracts in Nunavut. Given this low level of exploration, and the length of time
needed to bring a mineral property into production, the potential to replace the existing producing
diamond mines with new mines in the near future is uncertain.

2
 Some of these mineral deposits were known for decades but received renewed interest during the extended
2000s commodity mineral cycle.

                                                                                                 8|Page
FIGURE 2: PAST MINES, NEW MINES CURRENTLY OPERATING OR UNDER CARE AND MAINTENANCE, AND OTHER
ADVANCED EXPLORATION PROJECTS IN THE BATHURST RANGE.
9|PageFIGURE 3: HISTORICAL AND CURRENT MINERAL TENURE ON THE BATHURST RANGE (SOURCE: GOVERNMENT OF
NORTHWEST TERRITORIES, DEPARTMENT OF INDUSTRY, TOURISM AND INVESTMENT, AND NATURAL
RESOURES CANADA).
10 | P a g eThe Mineral Exploration and Development Cycle
Mineral exploration and development can be considered a long-term cycle spanning roughly 25-55 years
comprised of five different phases: 1) early exploration, 2) discovery, 3) development/construction, 4)
production, and 5) reclamation (Figure 4). A sustained level of mineral exploration is required to
develop a mine, as fewer than 1 in 1,000 exploration projects generally result in a producing mine, and
the average time to develop a mine is 10 to 15 years from discovery to production. Each stage of the
mineral exploration and development cycle requires different types of jobs and has varying levels of
economic contributions.
FIGURE 4: THE MINERAL EXPLORATION AND DEVELOPMENT LIFE-CYCLE (SOURCE: GOVERNMENT OF
NORTHWEST TERRITORIES, DEPARTMENT OF INDUSTRY, TOURISM AND INVESTMENT).
Economic Contributions
Mineral exploration and development have been important components of the NWT economy and have
contributed a major legacy of infrastructure, including highways, rail lines and hydroelectric facilities.
With the addition of the new major diamond mines, the direct economic benefits of mining account for
over one quarter of the NWT’s Gross Domestic Product. Indirect benefits are also significant, through
spending on transportation, construction, real estate and supporting activities such as monitoring,
assessment and project planning. Mining is the largest private sector employer in the territory. Since
1998, the diamond mines alone have generated nearly $10 billion in NWT business contracts (over $4
billion of which were spent with Aboriginal-owned businesses) and have created over 20,000 total
person years of employment (nearly half of which were Aboriginal employees) (NWT Industry, Tourism
and Investment 2012).
11 | P a g e3.1.2 Transportation
While there are few major roads in the Bathurst range, it is considered to be the most accessible barren-
ground caribou range in Northwest Territories. Almost all roads and trails are located in the west
central part of the winter range (RAA4), around the City of Yellowknife and the Tłįchǫ communities of
Whatì, Wekweètì, Gamètì and Behchokǫ̀ -Edzo, and the YKDFN community of Dettah (Figure 5).
The only major all-season road in the range, Highway 3, runs along the north shore of Great Slave Lake,
connecting the City of Yellowknife and surrounding area to the highway system of southern Canada.
Winter roads, operating seasonally between January and early April, are the most important
transportation features. Winter roads connect the Tłįchǫ communities of Whatì, Gamètì and Wekweètì
to Highway 3, and a number of other winter roads are used periodically to transport materials and fuel
to mineral exploration sites. The most important winter road is the Tibbitt to Contwoyto Lake route
which connects the three operating diamond mines near Lac de Gras to the public highway system
(Figure 5). The Tibbit to Contwoyto winter road was originally constructed in 1982 to service the Lupin
minesite near the Nunavut-NWT border. From its start at the end of Highway 4 (Ingraham Trail) to the
Lupin mine, the Tibbit to Contwoyto Lake winter road spans approximately 600 km, although in recent
years the road has only been constructed as far as the Ekati minesite (a distance of approximately 450
km). Approximately 87% of the road is routed over frozen lakes. In high traffic years, as many as 11,000
freight trucks travel the winter road at a rate of 12 to 15 trucks per hour, 24 hours per day. Three
seasonal maintenance camps are located along the route.
The Tibbit to Contwoyto Lake winter road will likely continue to be constructed and used annually as
long as the operating mines require resupply. GNWT is currently considering a 160 km all-season
overland road (the Slave Geological Province all-season access road) to replace the southern section of
the Tibbit to Contwoyto road, in order to extend the length of winter road operations. An all-season
road from Highway 3, to the southwest of Behchokǫ̀ , to Whatì is also being planned3. In Nunavut, an all-
season road is being considered from Grays Bay to the central Kitikmeot region (the Grays Bay – Izok
Lake corridor) and previously, an all-season road has been proposed between Bathurst Inlet and
Contwoyto Lake (the BIPAR road corridor). Other project specific winter roads may also be built, as
required.
3.1.3 Hydro Development and Transmission
Two major hydroelectric development and transmission systems are located along the western
periphery of the Bathurst range (Figure 5). The Bluefish and Snare hydro systems supply power to the
City of Yellowknife and other North Slave communities. Together they consist of five hydro generators
and approximately 150 km of transmission lines. The Taltson hydroelectric facility, near Fort Smith, is
not within the planning area but uses Nechalacho Lake, to the southeast of Łutsel K’e, as a reservoir,
resulting in fluctuating water levels.
3
As of December 2016, the Behchokǫ̀ to Whatì all-season road was undergoing environmental assessment.
12 | P a g eFIGURE 5: MAJOR TRANSPORTATION AND HYDRO FACLITIES AND TRANSMISSION LINES IN THE BATHURST
RANGE.
13 | P a g e3.2 Current Human Disturbance
Figure 6 shows the location of current direct human footprint and its associated ZOI resulting from land
use. For a detailed description of the current human disturbance within the Bathurst range, see Section
3.5 of the Caribou Range Assessment and Technical Information Report.
Using available mapping, the BCRP Working Group determined that less than 0.05% (179.5 km2) of the
Bathurst annual range is currently affected by direct development footprint. Some of the disturbance is
seasonal. For example, the Tibbit to Contwoyto Lake winter road is only operational between January
and early-April of each year, and crosses frozen waterbodies for much of its length. Settlements (e.g.,
City of Yellowknife) and active mine sites (e.g., Ekati, Diavik and Gacho Kué) are the largest sources of
direct footprint, followed by linear features such as all-season and winter roads, trails and electrical
transmission corridors.
While the direct footprint of human land use in the Bathurst herd range may be very small, in some
areas the total human ZOI is substantial. Using the ZOI assumptions described in Appendix B of the
Caribou Range Assessment and Technical Information Report, the BCRP Working Group estimated that
approximately 5.6% (21,898 km2) of the Bathurst range is currently affected by direct and indirect
human disturbance (direct footprint with associated ZOI). The highest levels of human disturbance
occur in the Northwest Territories, in RAA4 (central winter range), where all of the permanent
settlements and all-season highways are located, and RAA2 (central tundra) where the current operating
diamond mines are located (Figure 6). Although linear features have a relatively small direct footprint,
they are a major contributor to total human ZOI on the Bathurst annual range, and facilitate access for
humans into previously difficult to travel areas.
14 | P a g eFIGURE 6: CURRENT DIRECT AND INDIRECT HUMAN DISTURBANCE IN THE BATHURST RANGE.
15 | P a g e4 Future Situation
4.1 Future Development Scenarios
Future development (land use) scenarios provide insight into the amount of human-caused change that
may occur in different parts of the range in the future. The scenarios were created using information
based on known or reasonably foreseeable future mineral development and transportation projects that
may occur in the next 24 years (2016 to 2040)4. Early-stage mineral exploration (mineral staking and
grass-roots exploration activities) was not addressed in the future development scenarios, but may be
examined in the future. The BCRP considered three potential scenarios:
• CASE 1: Declining development;
• CASE 2: Continuing development; and
• CASE 3: Increasing development.
Table 1 summarizes the major assumptions for each scenario. For each case, a detailed timeline of
construction, operations and reclamation was created for each project considered in the scenario
(Figure 7). CASE 1 represents a situation of declining development, where the existing operating
diamond mines and Tibbit to Contwoyto Lake winter road cease operations by 2040, and no new mines
are brought to production. CASE 2 projects a similar level of development into the future as current,
where the existing diamond mines are replaced by new mineral development projects in the coming
decades, and the southern part of the Tibbit to Contwoyto Lake winter road is replaced by a new all-
season road into the central Slave Geological Province. CASE 3 represents an increasing level of
development with new all-season road infrastructure in Nunavut and several new mines being
developed, both in Nunavut and Northwest Territories.
4
The BCRP Working Group worked closely with the Mineral Task Group to develop assumptions and project
parameters for the three development scenarios.
16 | P a g eTABLE 1: OVERVIEW OF BATHURST RANGE PLAN FUTURE DEVELOPMENT SCENARIOS.
Scenario CASE 1: Declining CASE 2: Continuing CASE 3: Increasing
Assumptions Development Development Development
General CASE 1 assumes the existing CASE 2 assumes that only a few of CASE 3 assumes that many of the
Assumptions producing mines are closed at the the existing advanced mineral existing advanced mineral
end of their projected life-span exploration projects will become exploration projects will become
and no new mines are built, producing mines in the coming 24 producing mines in the coming 24
leading to the discontinuation of years, mineral exploration will years, the level of mineral
the Tibbit to Contwoyto Lake remain similar to current, and exploration may increase, and the
Winter Road. Mineral exploration there will be limited change in amount of transportation
declines or remains similar to current transportation and infrastructure will increase, but
current, with no other changes in electrical utility infrastructure. electrical generation will remain
transportation ore electrical utility similar to current.
infrastructure.
Advanced • Current mineral exploration • Current mineral exploration • Current mineral exploration
Mineral projects. projects are maintained except projects are maintained except
Exploration* those that advance to producing those that advance to producing
mines. mines.
• 3 new Advanced Exploration • 7 new Advanced Exploration
projects projects (CASE 2 plus 4 new)
Mineral 3 active mines: 6 active mines: 12 active mines (CASE 2 plus the
Development following 6):
• 3 producing diamond mines • Back River Project (Goose)
(Ekati, Diavik and Gahcho Kué) • Snap Lake (re-opens) • Izok Lake
• 1 diamond mine under care and • Kennady North • High Lake
maintenance (Snap Lake). • Lupin-Ulu • Hackett River
• NICO • Indin Lake
The 3 producing diamond mines • Courageous Lake • Nechalacho
become past mines as they reach • Tyhee Gold
closure in 10-20 years future. The 3 producing diamond mines
become past mines as they reach
closure in 10-20 years future.
Transportation Current all-season and winter road Current road network maintained Future low scenario plus new
transportation network. except construction of new all- Nunavut minesite access roads:
season roads:
After the Ekati, Diavik and Gacho • IZOK road and port
• Hwy #3 to Whatì (replace • BIPAR road and port (Phase I)
Kué mine sites are closed, the
Tibbit to Contwoyto Winter Road
existing winter road); • Back River utilizes BIPAR road
is no longer used. • NICO to Whatì; and port
• Tibbitt to Lockhart Lake (replaces
approximately 150km southern
section of existing winter road)
Construction of Back River Project
winter road to Bathurst Inlet and
Marine Laydown facility proceeds.
Electrical Current facilities and transmission: No change; current situation is No change; current situation is
Generation and • Snare; maintained. maintained.
Transmission • Bluefish; and
• Taltson
Settlements Current situation No change; current situation is No change; current situation is
maintained. maintained.
*Early-stage mineral exploration (staking and grass-roots exploration) is not currently addressed in the BCRP
Development Scenarios.
17 | P a g eCASE 1 – Declining Development
CASE 2 – Continuing Development
CASE 3 – Increasing Development
FIGURE 7: DETAILED TIMELINES FOR PROJECTS CONSIDERED IN BCRP FUTURE DEVELOPMENT SCENARIOS.
18 | P a g e4.2 Disturbance Resulting from Future Development Scenarios
Figure 8 shows the mapped results of each scenario at year 2040. In all cases, there is very limited new
land use activity projected for RAA3 (NWT Northwest Winter Range) and RAA5 (NWT Southeast Winter
Range. Most of the projected changes in total human disturbance resulting from the three development
scenarios occur in RAA1 (Nunavut), RAA2 (NWT Central Tundra), and RAA4 (NWT Central Winter Range).
For a detailed description of the potential future human disturbance within the Bathurst range under
these future development scenarios, see Section 3.5 of the Caribou Range Assessment and Technical
Information Report.
19 | P a g eCASE 1:
Declining Development
Year 2040
CASE 2:
Continuing Development
Year 2040
CASE 3:
Increasing Development
Year 2040
FIGURE 8: POTENTIAL FUTURE HUMAN DISTURBANCE IN THE BATHURST RANGE: CASE 1 (DECLINING
DEVELOPMENT), CASE 2 (CONTINUING DEVELOPMENT), AND CASE 3 (INCREASING DEVELOPMENT). ALL MAPS
SHOW RESULTS AT YEAR 2040.
20 | P a g e4.3 Economic Assessment of Future Development Scenarios
An economic assessment of the three Future Development Scenarios was conducted to understand the
relative economic outputs associated with each. This first-order assessment is based primarily on the use
of published economic multipliers for Northwest Territories (NWT Bureau of Statistics 2012)5. Using input
of the Mineral Task Group, three economic indicators were calculated for each scenario: Gross Domestic
Product (GDP), Employment and Labour Income. The three indicators were each calculated for the
general project phases of construction, operations and reclamation.6 Values were calculated in annual
time steps based on the detailed project timelines shown in Figure 7.
The intent of economic evaluation within the BCRP range planning exercise is not to make precise
predictions about future economic outputs resulting from potential mineral development and
transportation projects. Instead, its purpose is to understand the relative changes that may occur as a
means to explore the potential economic consequences of different caribou habitat management
strategies that could alter, defer or limit future levels of future land use activity. See Appendix A for a
detailed description of economic evaluation assumptions and methods.
The potential economic implications of the three development scenarios, reported by range assessment
area, are as follows:
5
Similar economic multipliers have not yet been gathered for Nunavut.
6
Note: The multipliers used to date are based on most recent mineral economic development activity in the NWT,
and thus are skewed toward the economics of diamond mining. Research is underway to develop economic
multipliers that better reflect the full spectrum of commodities.
21 | P a g eRAA1 - Nunavut
Figure 9 and Figure 10 show the projected change in GDP ($M/year) and employment (PY/year)
resulting from development Case 1, 2 and 3 for RAA1:
• Case 1: There is no projected development, therefore no GDP or employment.
• Case 2: The Back River (Goose) project begins in 2021 causing a short term increase in
construction related employment up to over 700 PY/Yr and increase in GDP to over 90 $M/Yr.
The Lupin and Ulu projects begin in 2026 causing a decade-long rise in GDP to nearly 200
$M/Yr. Long-term employment opportunities increase up to nearly 700 PY/Yr for 3 years, then
drop to around 300 PY/Yr by 2029 and again down to 150 PY/Yr by 2040.
• Case 3: In addition to Case 2:
▪ The Back River (George) project begins in 2029 causing an increase in in construction
related employment up to nearly 1,300 PY/Yr and increase in GDP to over 300 $M/Yr.
▪ The Izok Lake and High Lake projects begin in 2033 causing a short term increase in
construction related employment up to a peak of nearly 5,700 PY/Yr and increase in GDP
to nearly 950 $M/Yr.
▪ The Hackett River project begins in 2037 causing a second short term increase in
construction related employment up to a peak of over 4,000 PY/Yr and increase in GDP to a
peak of over 1,300 $M/Yr.
▪ Izok and High Lake mines shift to reclamation phase in 2040 causing a drop in employment
and GDP.
▪ Long term non-construction employment hovers around 1,500 PY/Yr from 2033 onward.
FIGURE 9: RAA1 (NUNAVUT) - PROJECTION OF POTENTIAL CHANGE IN GROSS DOMESTIC PRODUCT FOR FUTURE
DEVELOPMENT SCENARIO CASES 1, 2 AND 3.
22 | P a g eFIGURE 10: RAA1 (NUNAVUT) - PROJECTION OF POTENTIAL CHANGE IN EMPLOYMENT FOR FUTURE
DEVELOPMENT SCENARIO CASES 1, 2 AND 3.
RAA2 – NWT Central Tundra
Figure 11 and Figure 12 show the projected change in GDP ($M/year) and employment (PY/year)
resulting from development Case 1, 2 and 3 for RAA2:
• Case 1: There is no projected new development. The current GDP of over 970 $M/Yr
decreases over time to near zero as the current active mines reach reclamation and then
closure. Similarly, the current active employment of 3000 PY/Yr decreases over time to very
low levels.
• Case 2 and Case 3 are the same. In addition to Case 1:
▪ The Snap Lake mine resumes operations by 2023 and along with the new Kennady North
mine there is an increase in GDP to nearly 1,300 $M/Yr in 2023. GDP then drops with the
closure of Diavik, before another increase to nearly 1,100 $M/Yr in 2030 with the
construction of the Courageous Lake mine. Long-term GDP drops to 400 $M/Yr and then
below 300 $M/Yr as the larger existing mines close.
▪ The Snap Lake mine resumes operations by 2023 and along with the new Kennady North
mine there is an increase in employment to over 3,500 PY/Yr in 2023. Employment then
drops with the closure of Diavik, before another short-term increase to nearly 4,000 PY/Yr
in 2030 with the construction of the Courageous Lake mine. Long-term employment drops
to around 700 PY/Yr as the larger existing mines close.
23 | P a g eFIGURE 11: RAA2 (NWT CENTRAL TUNDRA) - PROJECTION OF POTENTIAL CHANGE IN GROSS DOMESTIC
PRODUCT FOR FUTURE DEVELOPMENT SCENARIO CASES 1, 2 AND 3.
FIGURE 12: RAA2 (NWT CENTRAL TUNDRA) - PROJECTION OF POTENTIAL CHANGE IN EMPLOYMENT FOR FUTURE
DEVELOPMENT SCENARIO CASES 1, 2 AND 3.
RAA4 – NWT Central Winter Range
Figure 13 and Figure 14 show the projected change in GDP ($M/year) and employment (PY/year)
resulting from development Case 1, 2 and 3 for RAA4:
• Case 1: There is an increase in GDP (up to over 20 $M/Yr) and employment (up to nearly 180
PY/Yr) during the three-year construction of the Whati road.
• Case 2: In addition to Case 1, the NICO project begins in 2023:
▪ There is a two-year increase in construction related employment up to over 640 PY/Yr.
24 | P a g eLong-term employment opportunities drop to around 80 PY/Yr.
▪ There is a two-year increase in construction related GDP to over 80 $M/Yr. Long-term GDP
drops to around 40 $M/Yr.
• Case 3: In addition to Case 2:
▪ The Nechlacho, Indin Lake and Tyhee projects all begin by 2029.
▪ There is an increase in construction related employment up to over 3,400 PY/Yr for two
years. Long-term employment opportunities drop to around 740 PY/Yr.
▪ There is an increase in long-term GDP to around 470 $M/Yr.
FIGURE 13: RAA4 (NWT CENTRAL WINTER RANGE) - PROJECTION OF POTENTIAL CHANGE IN GROSS DOMESTIC
PRODUCT FOR FUTURE DEVELOPMENT SCENARIO CASES 1, 2 AND 3.
FIGURE 14: RAA4 (NWT CENTRAL WINTER RANGE) - PROJECTION OF POTENTIAL CHANGE IN EMPLOYMENT FOR
FUTURE DEVELOPMENT SCENARIO CASES 1, 2 AND 3.
25 | P a g e5 Summary
This report describes the major industrial land uses (mineral exploration and development,
transportation, and power generation and transmission), their economic considerations and levels of
human-caused disturbance within the BCRP planning area. While other important land uses such as
tourism and recreation also occur in the Bathurst range, these three land uses account for the majority
of human-caused habitat disturbance outside of communities, a situation anticipated to continue into
the future. Both the current and potential future situations were considered.
5.1 Current Situation
• Based on available human disturbance mapping and the ZOI assumptions, approximately 5.6%
(21,898 km2) of the Bathurst range planning area is currently affected by direct and indirect
human disturbance (direct footprint with associated ZOI).
• The highest level of disturbance is in RAA4 (NWT central winter range), where all of the
permanent settlements and all-season highways are located.
• RAA2 (NWT central tundra), with the current operating diamond mines, contains the second
highest level of disturbance.
• RAA4 has the highest level of road and trail access.
5.2 Future Situation
• With the assistance of the Mineral Task Group, three future development scenarios were
created to explore potential levels of future human disturbance in the BCRP planning area.
• The future development scenarios ranged from declining development (CASE 1) to increasing
development (CASE 3).
• In all scenarios, RAA3 and RAA5 were projected to have very low levels of industrial land use.
• RAA1 (Nunavut) has the potential to experience the largest increases in human development
and associated disturbance.
• A coarse-level economic assessment of the three future scenarios indicated the potential
magnitude of economic impacts generated by new mines and transportation infrastructure for
the NWT and Nunavut economies.
26 | P a g e6 References
NWT Department of Industry, Tourism and Investment. 2012. Northwest Territories Mineral
Development Strategy. Prepared by GNWT and NWT and Nunavut Chamber of Mines. Yellowknife.
NWT Bureau of Statistics. 2012. NWT Economic Multipliers—Overview and Results. Government of
Northwest Territories. July 2012. Available online: http://www.statsnwt.ca/economy/multipliers/.
Silke, R. 2009. The operational history of mines in the Northwest Territories, Canada. A historical
research project. Prepared for Northwest Territories Geoscience Office. Yellowknife, Northwest
Territories. Available online: www.nwtgeoscience.ca.
Tłı̨chǫ Research and Training Institute. 2016a. A Summary Report of Tłı̨chǫ Traditional Knowledge of
Ekwò (Barren-ground Caribou) for the Bathurst Caribou Range Plan. Petter Jacobsen May 4, 2016.
27 | P a g eLand Use Scenarios and Economic Considerations
APPENDIX A:
Land Use Economic Evaluation Methods
1 Introduction
This document summarizes methods used to estimate the economic outputs of potential future mineral
sector and transportation projects within the Bathurst range planning area. At this time, only future
potential mineral development and transportation projects have been considered1. Potential economic
outputs of projects included in the BCRP Future Development Scenarios have been estimated based on
known or estimated project parameters.
The goal of economic evaluation within the BCRP range planning exercise is not to make precise
predictions about future economic outputs resulting from potential mineral development and
transportation projects. Instead, its purpose is to understand the relative changes that may occur as a
means to explore the potential economic consequences of different caribou habitat management
strategies that could alter, defer or limit future levels of future land use activity.
The methods and results of this evaluation should be interpreted in the following context:
• The methods and results should be interpreted as relative economic outputs or contributions; the
methods used are not suitable to forecast detailed absolute values; and
• The methods used result in economic outputs specific to the Bathurst range planning area. They
are not intended to provide a detailed economic model for the entire NWT or Nunavut economy,
nor do they consider contributions to the national or global economy.
2 Methods
2.1 General Approach
Different economic models and modeling approaches are available to estimate the economic
contributions of potential future economic development. Potential economic models include Statistics
Canada’s Interprovincial Input-Output Model and the Northwest Territories Economic Impact Model.
However, using such detailed economic models can be time intensive and require high levels of expertise.
The role of economic modeling within the BCRP is not to make precise estimates of economic
contributions resulting from potential future development to the territorial or national economy, but to
understand the relative changes that may occur while exploring different caribou habitat management
strategies.
Recognizing this situation, the BCRP Working Group aimed to estimate the approximate and relative
1
In the future, economic outputs associated with mineral development may be considered.
A1economic outputs associated with a range of potential mineral development and transportation
scenarios in the 2016 to 2040 time period. For each mineral development or transportation project
included in the BCRP Development Scenarios, published economic multipliers from the NWT Bureau of
Statistics (2012) and expert opinion were used to estimate the future economic output of individual
projects, based on known or estimated parameters for construction, operations and reclamation costs for
each project. Detailed methods are described below.
2.2 Economic Multipliers
The NWT Bureau of Statistics (2012) has published tables of economic multipliers that relate a given
amount of economic output within a sector to three different economic indicators: Gross Domestic
Product (GDP), Labour Income, and Employment. As stated by the NWT Bureau of Statistics (2012), such
economic multipliers are considered to be intensity ratios, and are intended to be used as follows:
• The intensity ratios are appropriate for very general assessments of economic impacts.
• When estimating economic impacts, it is preferable to use multipliers to make relative, rather than
absolute, comparisons. Where multipliers are used to estimate the impacts of a single activity, the
results should be treated only as a general estimates, indicating the order of magnitude of the
impacts rather than exact levels.
Economic multipliers are therefore well suited as a means to consider the relative changes in economic
output that may occur while exploring different caribou habitat management strategies. The following
example from NWT Bureau of Statistics (2012) illustrates how economic multipliers can be used to
estimate economic output associated with a specified level of spending in the construction industry.
Example: Construction Industry Expansion
Intensity ratios are often used when all that is known about a project is the gross change in economic
activity. For example, if there were a $50 million increase expected in the output of the territorial
construction industry, then using the construction industry intensity ratios from Table 1, the total direct
and indirect economic effects would be as follows:
GDP at Basic Prices ($): [GDP intensity ratio for Const.] x [Gross output]
[0.46] x [$50 million] = $23 million
Labour Income ($): [Labour income intensity ratio for Const.] x [Gross output]
[0.33] x [$50 million] = $16.5 million
Employment (PYs): ([Gross output] / [1 million]) x [Employment intensity ratio for Const.]
[$50 million/1 million] x [3.5] = 175
Therefore, a $50 million expected increase in the output of the construction industry has a potential GDP
impact of $23.0 million; labour income impact of $16.5 million; and the potential creation of 175 person-
years of employment.
A22.3 Applying Economic Multipliers to Mineral Sector Activity
The two main parts of the mining life cycle (Figure 1), exploration and development, provide a useful
framework to understand activities considered by the BCRP economic evaluation.
Mineral Exploration
Mineral Exploration may include all activities prior to mine development (the Exploration and Discovery
phases of the mining life cycle, as shown in Figure 1). Specific activities may include mineral claim staking
and early investigations, exploration associated with land use permits, and advanced exploration and
deposit appraisal.
Mineral Development
Mineral Development refers to the life cycle phases of mine Development (i.e., construction), Production
(operations) and Reclamation (Figure 1). Mine development results in the construction of long-term
industrial facilities as well as air or ground transportation infrastructure.
At this time, only the mineral development part of the mining life cycle has been considered in the BCRP
economic evaluation.
MINERAL EXPLORATION MINERAL DEVELOPMENT
Figure 1. The mineral exploration and development life-cycle (Source: Government of Northwest Territories,
Department of Industry, Tourism and Investment).
A3The BCRP Working Group has used published NWT economic multipliers to estimate economic output
associated with mineral development and transportation projects included in the BCRP Future
Development Scenarios (see Appendix C). Published economic multipliers relevant to the NWT mineral
exploration and development sectors are listed in Table 12. A similar approach was used in a recent socio-
economic assessment for the Łue Túé Sųlái Candidate Protected Area in southern NWT (Stantec 2015).
Table 1. NWT economic indicators and multipliers, organized by mineral sector exploration and development
activities. Source: NWT Bureau of Statistics (2012).
Mineral Sector NWT Economic Indicators and Economic Multipliers
Activities GDP per Labour Income per Jobs per million dollars
dollar of expenditure dollar of expenditure of expenditure (PYs)
MINERAL EXPLORATION *
Support Activities for Mining and 0.79 0.57 5.5
Oil and Gas Extraction
MINERAL DEVELOPMENT
Construction 0.46 0.33 3.5
Diamond Mining 0.71 0.13 1.1
Truck Transportation 0.55 0.44 5.7
Waste Management and 0.82 0.47 6.7
Remediation Services
* Note: At this time the BCRP economic evaluation focuses on potential future mineral development and
transportation projects.
2.3.1 Estimating Economic Outputs of Mineral Development and Transportation Projects
Considered in the BCRP Development Scenarios
Estimating the potential future economic outputs of mineral development is dependent on the size of the
mine, operating costs, and potentially the level of production and/or mineral commodity. BCRP Working
Group members held meetings with Government of Northwest Territories and NWT and Nunavut Chamber
of Mines representatives between October 2015 and March 2016. During these meetings, and through
subsequent research, known or estimated costs were identified for the construction, operations and
reclamation phases of mineral development projects considered within the BCRP development scenarios.
Table 2 provides a summary of the known or estimated project costs and calculated economic outputs for
three indicators—GDP, labour income and employment—based on NWT published economic multipliers.
Results are shown for the construction and operations phases of each mineral development project.
2
The published NWT economic multipliers are assumed to also be relevant for similar activities in the Nunavut
portion of the Bathurst range planning area.
A4Table 2. Calculated economic outputs (GDP, labour income and employment) resulting from mineral development and transportation projects considered in
the Bathurst development scenarios. Economic outputs are based on published NWT economic multipliers (NWT Bureau of Statistics 2012).
SCENARIO PROJECT PHASE
CONSTRUCTION OPERATIONS
Total Labour Annual Labour
Cost Duration GDP Income Jobs Costs Duration GDP Income Jobs
($M) (years) ($M) ($M) (PY) ($M) (years) ($M) ($M) (PY)
Annual Total Annual Total Annual Total Annual Total Annual Total Annual Total
Ekati 520 4 60 239 43 172 455 1,820 600 14 426 5,964 78 1,092 660 9,240
CASE 1 Diavik 386 3 59 178 42 127 450 1,351 423 7 300 2,102 55 385 465 3,257
Gahcho Kué 1,019 2 234 469 168 336 1,783 3,567 212 12 151 1,806 28 331 233 2,798
Whati Road 190 4 22 87 16 63 166 665 1 18 1 10 0 8 6 103
Snap Lake 0 0 0 0 0 0 0 0 200 10 142 1,420 26 260 220 2,200
CASE 2 Back River (Goose) 415 2 95 191 68 137 726 1,453 121 12 86 1,031 16 189 133 1,597
Kennady North 1,019 2 234 469 168 336 1,783 3,567 212 12 151 1,806 28 331 233 2,798
NICO 357 2 82 164 59 118 625 1,250 59 16 42 670 8 123 65 1,038
Tibbit-Lockhart Rd 230 3 35 106 25 76 268 805 2 14 1 15 1 12 11 160
Lupin and Ulu 470 4 54 216 39 155 411 1,645 150 10 107 1,065 20 195 165 1,650
Courageous Lake 1,520 2 350 699 251 502 2,660 5,320 300 10 213 2,130 39 390 330 3,300
Nechalacho 1,580 2 363 727 261 521 2,765 5,530 300 15 213 3,195 39 585 330 4,950
Indin Lake 250 2 58 115 41 83 438 875 150 13 107 1,385 20 254 165 2,145
Tyhee Gold 250 2 58 115 41 83 438 875 150 10 107 1,065 20 195 165 1,650
CASE 3 Izok Road 400 4 46 184 33 132 350 1,400 4 8 2 18 2 14 23 182
Izok Lake 2,000 2 460 920 330 660 3,500 7,000 600 6 426 2,556 78 468 660 3,960
High Lake 1,000 2 230 460 165 330 1,750 3,500 400 6 284 1,704 52 312 440 2,640
BIPAR Road 170 3 26 78 19 56 198 595 1 3 1 2 0 1 6 17
Hackett River 1,500 2 345 690 248 495 2,625 5,250 600 2 426 852 78 156 660 1,320
TOTALS 12,756 43 2,752 5,868 1,974 4,209 20,937 44,646 3,885 184 2,757 22,832 508 4,208 4,310 35,766
TRANSPORTATION
CONSTRUCTION
ECONOMIC MULTIPLIERS COSTS NOTES
Labour 1. Duration of Operations phase is only showing the number of years prior to end of
Sector GDP Income Jobs (PY) ($ million/km) scenario (2040).
Construction 0.46 0.33 3.5 2.0 2. Values in red indicate estimated costs based on similar-sized projects.
Mining 0.71 0.13 1.1
Transportation 0.55 0.44 5.7
A52.3.2 Estimating Economic Outputs of Transportation Projects Considered in the BCRP
Development Scenarios
An average of $2 million/km was used to represent construction costs associated with a typical northern
all-season road. This value was used based on estimates created for the proposed Whatì all-season road
(NWT Department of Transportation estimates a construction cost of approximately $1.6 million/km).
Table 2 shows calculated economic outputs for potential future transportation projects based on average
construction costs of $2 million/km and published Transportation economic multipliers.
2.3.3 Estimating Economic Outputs Associated with Mine Reclamation
Information regarding the reclamation costs for existing mines is available (Diavik and Gacho Kué). A
coarse level assumption was made to estimate reclamation costs for mines without this type of
information (future conceptual projects). Both Diavik and Gacho Kué’s reclamation costs are in the range
of 20%-35% of annual operating costs. This estimation method assumes that annual operating costs will
be proportional to reclamation costs at a level indicated by available information on the Diavik and Gacho
Kué mine. So as not to overestimate economic outputs associated with reclamation, a value of 25% annual
operating costs was used to estimate reclamation costs for all projects. While this method has a high level
of uncertainty, reclamation costs associated with specific mine sites was found to be a relatively minor
contribution to the total economic outputs associated with the scenarios, relative to Construction and
Operations.
2.3.4 Tracking Economic Contributions of BCRP Development Scenario Projects
A custom-developed spreadsheet was designed to track the economic parameters associated with each
mineral development and transportation project included in the BCRP Development Scenarios, for a period
24-years into the future (2016 to 2040). Appendix B of the Interim Discussion Document (2016) contains
results of the economic assessment by Range Assessment Area.
3 References
NWT Bureau of Statistics. 2012. NWT Economic Multipliers—Overview and Results. Government of
Northwest Territories. July 2012. Available online: http://www.statsnwt.ca/economy/multipliers/.
Stantec. 2015. Łue Túé Sųlái Candidate Protected Area Socio-economic Assessment. Final Report.
September 30, 2015.
A6You can also read