Best Maintenance Tools for PTC Windchill on Microsoft SQL Server 2005
←
→
Page content transcription
If your browser does not render page correctly, please read the page content below
Best Maintenance Tools for
PTC Windchill on Microsoft
SQL Server 2005
Production-proven content and process management software

Microsoft Corporation
Published: May 2010

Author: Ken Lassesen
Reviewers: Tim Atwood (PTC), Victor Gerdes (PTC), Richard Waymire (Solid Quality Mentors)

Abstract
PTC Windchill is the only Product Lifecycle Management (PLM) solution designed from the ground up to
work in an Internet-based, distributed-design environment. Whether you need core product data-
management capabilities, optimization of processes to meet industry-specific requirements, or support
for global product development, Windchill has the capabilities you need for effective management of
global product development teams. Microsoft® SQL Server® provides an ideal database platform for
Windchill. With SQL Server as a foundation, Windchill can further reduce the time and costs related to
managing product development.
This white paper provides best practices for configuring and running Windchill on the SQL Server database
platform. The information in this paper complements the detailed support documentation provided on
the PTC support Web site. Implementing these best practices can help you avoid or minimize common
problems and optimize the performance of Windchill on SQL Server so that you can effectively manage
your resources, reduce operating expenses, increase productivity, and improve employee satisfaction.
Copyright Information
The information contained in this document represents the current view of Microsoft Corporation on the
issues discussed as of the date of publication. Because Microsoft must respond to changing market
conditions, it should not be interpreted to be a commitment on the part of Microsoft, and Microsoft
cannot guarantee the accuracy of any information presented after the date of publication. This white
paper is for informational purposes only. MICROSOFT MAKES NO WARRANTIES, EXPRESS, IMPLIED, OR
STATUTORY, AS TO THE INFORMATION IN THIS DOCUMENT.
Complying with all applicable copyright laws is the responsibility of the user. Without limiting the rights
under copyright, no part of this document may be reproduced, stored in, or introduced into a retrieval
system, or transmitted in any form or by any means (electronic, mechanical, photocopying, recording, or
otherwise), or for any purpose, without the express written permission of Microsoft Corporation.
Microsoft may have patents, patent applications, trademarks, copyrights, or other intellectual property
rights covering subject matter in this document. Except as expressly provided in any written license
agreement from Microsoft, the furnishing of this document does not give you any license to these
patents, trademarks, copyrights, or other intellectual property.
© 2010 Microsoft Corporation. All rights reserved.
Microsoft, SQL Server, Hyper-V, MSDN, and Windows are trademarks of the Microsoft group of
companies. All other trademarks are property of their respective owners.
Table of Contents
OVERVIEW ............................................................................................................................................... 5

   INTRODUCING PTC WINDCHILL: A COMPLETE SOLUTION FOR PLM .......................................................................... 5
   SQL SERVER: AN ENTERPRISE-READY DATABASE PLATFORM FOR WINDCHILL ............................................................. 6
   PTC AND MICROSOFT: A HISTORY OF INNOVATION ............................................................................................... 6
   BETTER TOGETHER: WINDCHILL ON THE SQL SERVER DATABASE PLATFORM .............................................................. 6

BEST MAINTENANCE TOOLS FOR RUNNING WINDCHILL ON SQL SERVER ................................................. 7

   BASIC MAINTENANCE TOOLS ............................................................................................................................. 7

SQL SERVER 2005 MANAGEMENT STUDIO ............................................................................................... 8

   DATABASE TUNING ADVISOR ............................................................................................................................. 8
   SQL SERVER PROFILER ..................................................................................................................................... 8
   CREATING A WORKLOAD USING SQL SERVER PROFILER.......................................................................................... 9
   RUNNING A DTA TUNING SESSION ................................................................................................................... 11
   REVIEWING A DTA TUNING SESSION ................................................................................................................ 15
   INDEX SELECTION CRITERIA ............................................................................................................................. 17
   WHEN TO RUN ADDITIONAL TUNINGS SESSIONS ................................................................................................. 17

SQL SERVER 2005 BEST PRACTICES ANALYZER (BPA) .............................................................................. 18

   EXPECTED WINDCHILL EXCEPTIONS................................................................................................................... 21
   FURTHER SECURING YOUR WINDCHILL DATABASE ............................................................................................... 22

SQL SERVER 2005 PERFORMANCE DASHBOARD ..................................................................................... 22

   PERFORMANCE DASHBOARD REPORTS .............................................................................................................. 23

PERFORMANCE ANALYSIS OF LOGS (PAL) .............................................................................................. 27

SUMMARY ............................................................................................................................................. 30

LINKS FOR FURTHER INFORMATION ...................................................................................................... 33
TABLES
Table 1 - Recommended Frequency of DTA Execution ................................................................. 18
Table 2 - Expected BPA Violations ................................................................................................. 21
Table 3 - Recommended Frequency for Running BPA .................................................................. 22
Table 4 - Recommended Proactive Use of Performance Dashboard ............................................ 26
Table 5 - Recommended Schedule for PAL Reviews ..................................................................... 29
Table 6 - Summary of Recommended Run Schedule for Maintenance Tools ............................... 30
Table 7 - Minimum Frequency of Other Maintenance Tasks ........................................................ 31
Table 8 - Full, Differential, and Transaction Log Backup Plan ....................................................... 31

FIGURES
Figure 1 - The setup.sql script for Performance Dashboard ......................................................... 22
Figure 2 - PAL Summary Page ........................................................................................................ 28
Figure 3 - PAL Drill-down Page ...................................................................................................... 29
Overview
For manufacturers, there is constant pressure today to compete in rapidly changing markets.
Companies must be innovative in keeping costs low while maintaining high-quality results. The
stakeholders involved in the product development process have also changed. Teams today
extend far beyond the central engineering department to include globally dispersed cross-
functional groups working on hundreds of products with thousands of parts. The result is an
enormous amount of data.
To stay ahead of the global competition, companies find that they must create a collaborative
environment that brings together engineering, manufacturing, marketing, and sales teams.
Product Lifecycle Management (PLM) solutions can help manufacturers achieve this
collaboration, while also streamlining operations and keeping costs down.
PLM is the process of managing all phases of product development—from initial concept
through end of life. Effective PLM combines information, methodology, and available resources
for each phase of a product’s lifecycle, improving a manufacturer’s ability to respond swiftly and
effectively to changes, new markets, and competitors.
Introducing PTC Windchill: A Complete Solution for PLM
PTC Windchill provides a complete family of solutions for content and process management,
helping manufacturers efficiently control all information assets related to product development
while optimizing associated business processes. Windchill is the only PLM solution designed
from the ground up to work in an Internet-based, distributed-design environment.
Windchill technology forms a solid foundation for a variety of packages that PTC offers to
address data, change, configuration, and process management; product development
collaboration; project management and execution; and the release of product information to
manufacturing management systems. For example,
Windchill PDMLink consolidates scattered islands of product content into a single
information source, which can help bring order to chaotic product development
processes such as change management and speed the development of new product
configurations.
Windchill ProjectLink creates a virtual workspace that becomes the central access point
for a project, enabling team members to collaborate with access to the same
information. By automating project management activities, Windchill ProjectLink helps
customers better manage all of their programs, project schedules, information, and
processes.
As an integral component of PTC’s Product Development System (PDS), Windchill manages all
product content and business processes throughout a product’s lifecycle. Windchill connects
seamlessly to Pro/ENGINEER for three-dimensional (3-D) computer-aided design (CAD) models,
ProductView® for advanced mock-up and interactive visualization, Mathcad® for engineering
calculations, and Arbortext® for dynamic publishing.SQL Server: An Enterprise-Ready Database Platform for Windchill Microsoft SQL Server provides an ideal database platform for Windchill. SQL Server is a high- performance, integrated database and business intelligence (BI) solution for data management and analysis. This easy-to-implement, easy-to-support foundation provides a multifunctional solution for large-scale online transaction processing (OLTP), data warehousing, and e- commerce applications and a solution for data integration, analysis, and reporting. SQL Server can help companies manage large volumes of mission-critical data and run software applications—such as PTC Windchill—to optimize their business performance. SQL Server can extract and transform data from a variety of sources, including XML data files, flat files, and relational data sources, and then load it into one or more destinations. In addition to rapid data mining, analysis, processing, and reporting capabilities, SQL Server has built-in features that give you a secure, reliable, and productive data management environment that truly protects your data. With its scalable infrastructure, SQL Server has the capability to grow with your business and keep up with your toughest data challenges. PTC and Microsoft: A History of Innovation PTC and Microsoft deliver complementary product development solutions that organizations can use broadly across their infrastructure. With a Microsoft IT infrastructure, you get an open, extensible platform and a simplified user experience. You can take advantage of your existing IT investments for a lower total cost of ownership (TCO). PTC provides full integration with your Microsoft infrastructure, including Microsoft® Office SharePoint® Server, Microsoft® Office Project Server, Microsoft® Office Communications Server, Windows Server®, and SQL Server. The PDS architecture gives you end-to-end solutions for product development and a single source for product and process knowledge. Together, PTC and Microsoft deliver powerful product development solutions that provide tremendous customer value. Better Together: Windchill on the SQL Server Database Platform Running Windchill on SQL Server delivers measureable value by channeling data into manageable, automated processes. This decreases administrative time, improves productivity, reduces costs, and generates greater employee satisfaction. Benchmarking tests confirm that SQL Server scales to meet the performance needs of even the largest enterprise customers, while providing lower initial costs and licensing fees.1 Benchmark test results showed that Pro/ENGINEER and Windchill 9.1 performed up to 50 percent faster on SQL Server 2005 than on a competitor’s database, with an average performance advantage of approximately 10 percent. These results confirm SQL Server 2005 as a superior database choice for Windchill 9.1. 1 “Microsoft SQL Server: Improved Performance for PTC Windchill,” http://www.cio.com/white- paper/588485/Microsoft_SQL_Server_Improved_Performance_for_PTC_Windchill
Best Maintenance Tools for Running Windchill on
SQL Server
This paper looks at tools that automate basic best practices described in the companion white
paper “Best Practices for PTC Windchill on Microsoft SQL Server,” available on the Microsoft and
PTC Alliance Web page. These tools often provide additional analysis and capabilities not
covered in the “Best Practices” white paper.
Best maintenance practices usually include the following aspects:
Corrective maintenance, such as replacing a suspect or failing drive
Preventative maintenance, such as backing up databases and storing them off-site
Predictive maintenance, such as reorganizing files during maintenance windows or
adding disks before running out of disk space
Purchasing, such as ensuring that spares for all critical elements are on site or available
from a vendor within an acceptable Service Level Agreement (SLA)
Proactive maintenance, which is a combination of preventative maintenance and
predictive maintenance; an example is looking at the expected upper and lower bounds
for growth of data files and users in each budget cycle and obtaining appropriate capital
budget for hardware and/or software, such as upgrading a server from SQL Server
Standard Edition to Enterprise Edition
Accountability, such as ensuring that someone is designated and available to deal with
issues at all times
Remember that you need to validate best practices using current standards. Best maintenance
practices for Windchill on SQL Server 2000 or Oracle may not be recommended or relevant for
SQL Server 2005. New software and operating system (OS) patches may also alter the
maintenance tasks you need to do.
This white paper focuses on SQL Server performance monitoring, maintaining a healthy
database, and maintaining a secure system by using tools provided by Microsoft. For more
information about SQL Server administration, see the bibliography at the end of this paper.
Basic Maintenance Tools
The tools discussed in this white paper are all free from the Microsoft Web site or Codeplex,
Microsoft’s open-source community Web site.
PTC recommends the installation and use of the following Microsoft or community products:
Microsoft SQL Server 2005 Management Studio (SSMS)2, which includes:
o SQL Server Database Tuning Advisor
o SQL Server Profiler
Microsoft SQL Server 2005 Best Practices Analyzer
2
SSMS installs with SQL Server as an option. SSMS may also be installed without SQL Server. Codeplex’s SQL Server 2005 Performance Dashboard (source code donated by
Microsoft)
Codeplex’s Performance Analysis of Logs (PAL) tool, which requires the installation of
additional components (covered later in this paper)
Using these tools can greatly reduce the time needed to do maintenance, especially when
compared to manually performing all the best practices tasks required to keep your system in
top shape.
SQL Server 2005 Management Studio
SSMS is an easy-to-use graphical management tool for SQL Server 2005. This tool includes script
editors, graphical tools, and a collection of utilities that can assist with troubleshooting and
tuning. To tune your Windchill database, you can use two of these utilities:
Database Tuning Advisor (DTA)
SQL Server Profiler
SSMS also provides a wizard to automate maintenance tasks.
Database Tuning Advisor
A database changes its nature over time and needs to be tuned for optimum performance. The
DTA is a wizard utility built into SSMS that uses a query optimizer to:
Recommend the best mix of indexes for databases
Recommend aligned or non-aligned partitions for databases
Recommend indexed views for databases
Analyze the effects of the proposed changes, including index usage, query distribution
among tables, and query performance of a workload
Provide reports that summarize the potential effects of implementing the
recommendations for a given workload
The DTA also lets you customize its recommendations by specifying advanced options such as
disk space constraints. (See Database Engine Tuning Advisor Reference and Database Engine
Tuning Advisor Features for more information about using the DTA.)
Usage patterns and loads for Windchill can vary greatly between customers. This variability
prevents extensive pre-tuning of the database before installation. In addition, after you first
install Windchill, an atypical workload occurs from loading documents and establishing projects.
However, after you have the database loaded and an ongoing pattern of additions, updates, and
deletes is established, you have the opportunity to run the DTA and do some tuning.
The key to doing effective tuning is to use SQL Server Profiler with the Tuning template to
capture a workload for the DTA to analyze. This method of creating workloads is the simplest
and works well for capturing ad hoc workloads.
SQL Server Profiler
SQL Server Profiler is a standalone tool that captures SQL Server events from a server and saves
them to a trace file. You can then replay the events and analyze them to see what is happeningon your server. As we noted above, the DTA can also use a captured workload to evaluate the
impact of additional indexes on queries.
Let’s look at how to use Profiler and the DTA to perform the following tasks:
Create a workload
Run a tuning session
Determine what recommendations to implement
Determine when to implement those recommendations
Remember that there can be a great variety of workloads among Windchill customers and
installations, so to get the best performance for your specific workload, you need to tune each
instance of Windchill separately. Fortunately, this is an easy process using tools such as the DTA.
A best practice is to run SSMS, the DTA, and Profiler from your desktop machine and not on the
machine hosting SQL Server.
Creating a Workload Using SQL Server Profiler
You should capture your workload when the system is busy. The captures should include three
types of workloads:
“Opening the week,” which is the first two business hours on a Monday. This period will
give you a profile dominated by people checking out documents.
“Closing the week,” which is the last two business hours of a Friday. This period will be
dominated by people checking in or rolling back documents.
“Typically busy,” which often means between 10-11am or 2-4pm on Tuesdays,
Wednesdays, or Thursdays. This period will be a mixture of check-in and check-out
activity, as well as other typical Windchill operations such as searching, downloading,
running reports, and checking assigned tasks.
The steps for creating a workload are as follows:
1. Open SSMS.
2. On the menu, click Tools and then SQL Server Profiler to open the Profiler application.
3. The resulting Connect to Server dialog box lets you log in to the Windchill instance.4. From the Trace Properties dialog box that appears, click the General tab and select the
Tuning template from the drop-down list.
a. You have two choices for where to save the data: Save to file or Save to table.
PTC recommends saving to a file, which has the advantage of being easy to forward to PTC for
further analysis. Saving to a file also removes load from SQL Server so that your production
environment is minimally impacted.
b. To set the end time for the trace, select the Enable trace stop time check box
and enter the time in the controls to the right of the check box.
5. Next, you need to set the Maximum File Size of the trace. PTC recommends 1GB as a
starting point; you can then increase or decrease the file size with experience.
a. Do not do detail tracing. A single Windchill operation can result in a 2GB trace
log. PTC recommends always limiting the maximum file size to significantly less
than the available space on the drive.b. If the Tuning template produces too much data, you may want to create your
own template starting with captures of the following events only:
RPC:Completed
SQL:BatchCompleted
SP:StmtCompleted
b. For information about building a custom template, see How to: Create
Workloads.
6. You now need to determine when you expect the heaviest load in the period. Do you
expect it at the beginning or the end of the trace period? The trace file may run out of
space, so you need to determine what information you want retained.
a. If you expect the heaviest load toward the end, select Enable File Rollover.
b. If you expect the heaviest load at the beginning, deselect the default Enable File
Rollover.
c. If unsure, leave this option unchecked and revisit later.
7. Leave the Event Selection tab with the default values.
8. Click Run. That is it!
If you follow the above steps, it should take you only a couple of minutes to define a trace that
will give you the workload you want to analyze. Profiler will automatically record the activity
until you stop the recording or reach the specified end time. There is no need to monitor the
capture.
Two additional notes to keep in mind about Profiler:
The longer the trace captures data, the bigger the file produced (up to the limit
specified). Use your first run to estimate MB/minute of data capture for future runs of
Profiler tracing.
The more queries captured by your Profiler trace, the better results you will get using
the trace data with the DTA utility.
For more information about using Profiler, see
How to: Create a Trace (SQL Server Profiler)
How to: Correlate a Trace with Windows Performance Log Data (SQL Server Profiler)
Mastering SQL Server Profiler – Video Training Course
Microsoft’s Patterns & Practices: How to: Use SQL Profiler
MSDN Webcast: Application Performance Tuning Using SQL Server Profiler 2005 (Level
200)
Running Profiler on a Busy SQL Server
SQL Server Profiler Tutorial Video: Profiler 101
Running a DTA Tuning Session
With a workload captured to a file in Profiler, your next step is to use that file as input to the
DTA to determine any tuning recommendations. Preparing the DTA session also takes less than
2 minutes, but the DTA will require some time to perform its analysis and return
recommendations.
Follow these steps for defining a DTA tuning session:
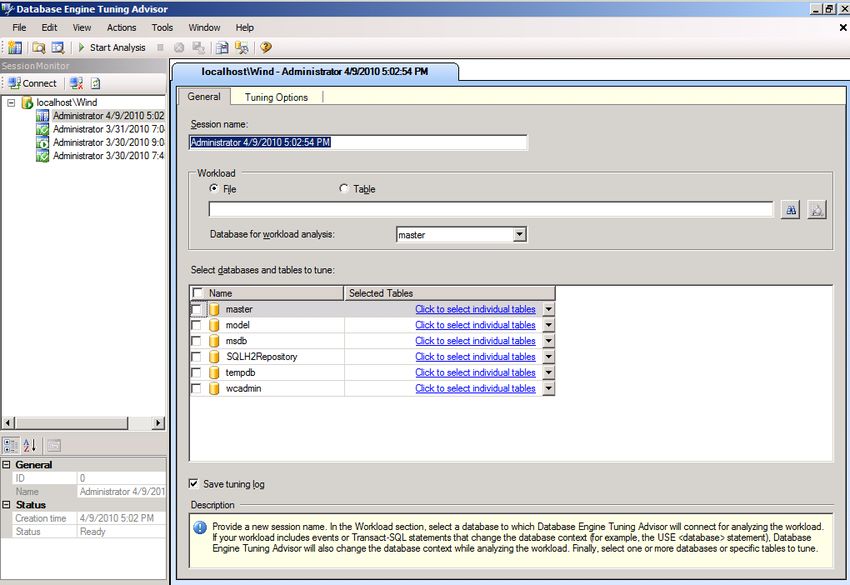
1. Open SSMS.2. On the menu, click Tools and then Database Engine Tuning Advisor to open the application. 3. The Connect to Server dialog box will appear. Enter the appropriate login information and connect. 4. The Database Engine Tuning Advisor will then appear.
5. Select the database you want to tune (wcAdmin in this example) and select the
   Workload file you created. Note that selecting the Windchill (wcAdmin) database will
   automatically select all 763 tables in Windchill.

       a. Next, click the Tuning Options tab. For your first run, select the Indexes, No
           partitioning, and Keep all existing PDS radio buttons.
6. Click Advance Options. Verify the default settings of All recommendations are offline and
   Max. Columns per index: 1023, then click OK.

7. Now estimate how long this machine is going to be unused. Typically, running the DTA is
   an end-of-day activity, so set the time to an hour before you come into work.
8. You’re now ready to click Start Analysis.
9. The screen will immediately start filling up with the captured activity.
10. You will notice a new Progress tab in the DTA. The process can take several hours to
complete if the workload contains a large amount of transactions.11. When the tuning calculations are complete, you will see two additional new tabs:
Recommendations and Reports. Make sure you have a latte or equivalent in hand—you
will be looking at the results for a while.
Reviewing a DTA Tuning Session
Here are some recommendations for reviewing a DTA tuning session.
1. Click the Reports tab to see a summary of the tuning session.2. At the bottom of the tab, click the Select Report combo box to see a list of available
reports.
3. Traverse each of the reports to see what the DTA found. For example, the Statement
cost report shows how much performance improvement you may see for various
statements (in this example, a few statements are predicted to improve by 94%!).
4. Now click the Recommendations tab to see the DTA’s index recommendations.
a. Scroll to the right until you see the Definition column.b. You can then select the index or indexes you want to implement. (The next
section looks at how to determine which index recommendations to accept.)
Index Selection Criteria
If you are familiar with the database, you can use that knowledge to determine the significance
of various indexes. Alternatively, you could simply select all of the DTA’s index
recommendations—but be aware that indexes take resources to build and maintain.
If you have no detailed knowledge of the database, its tables, and their relationships, use the
following heuristic to help determine which indexes to implement:
Find the indexes that have the smallest number of columns (on the first pass, it will be
one column only). In the above example, we have eight (8) indexes that have only one
column out of the 17 suggestions, with a net improvement of 4.7%.
Select those indexes and then click Actions, Apply Recommendations.
Rerun the workload to see how much the added indexes improved performance. Do not
expect the same index recommendations from two different trace logs. The estimations
derive from the index statistics used for each query and the number of times a query
occurs.
Adding an index may decrease the contribution of an index recommendation from another
workload (or the same workload). Existing indexes and index recommendations are often
dependent, frequently with complex interactions.
A good rule of thumb is that if the DTA yields a 5% improvement, then add the indexes with the
lowest number of columns and repeat the workload measurements until the improvement drops
below 5%.
Note: The DTA will always produce recommendations for adding indexes and never for deleting
indexes. See Uncover Hidden Data to Optimize Application Performance for information about
detecting unused or costly indexes, which you may choose to delete. Remember that an unused
index consumes resources and results in poorer performance.
This tuning process may span several days, but the time involved should be less than 10 minutes
a day. Run the DTA before you leave the office, and review the results and select the new
indexes when you come in the next day. The payback to your organization is that users will have
faster access to the data they need to do their jobs.
Caution:
You should not run the DTA when there is any load on the system because the process
may place considerable load on SQL Server. Execute the DTA during off hours or
maintenance periods.
If the size of any of the recommended indexes is large, make sure that you have
adequate available disk space to add them. There is nothing like adding an index and
having a drive run out of space during the work day!
When to Run Additional Tunings Sessions
If there is a change in your business—for example, ramping up of a new major contract—there
may be a significant change in the load on the database. Often this is a good time to perform atuning. In the course of normal operations, PTC recommends executing the DTA as shown in
Error! Reference source not found..
Table 1 - Recommended Frequency of DTA Execution
Time Since Frequency Action
Installation
For first 6 weeks Weekly Run DTA with default settings
First year Monthly Run DTA with indexes and index views; include
filtered indexes
After 1 quarter Quarterly Run DTA with full partitioning
After 1 quarter Quarterly Run DTA with indexes and index views; include
filtered indexes
Note: There is rarely a need for full partitioning. For information about rebuilding indexes, see
“Best Practices for PTC Windchill on Microsoft SQL Server.”
SQL Server 2005 Best Practices Analyzer (BPA)
BPA does a whole system analysis of your SQL Server installation—including Microsoft Windows
and SQL Server configuration and security settings—according to industry standards and best
practices. BPA is very simple to use. It should be executed after the database is first created and
then on a quarterly basis. Make sure you run BPA from your desktop machine and not on the
SQL Server machine. You can use your desktop installation to do analysis of multiple SQL
Servers.
Here’s how to run BPA:
1. After downloading and installing BPA, from the All Programs menu, select SQL Server
2005 BPA and then SQL Server 2005 Best Practices Analyzer to open the application.
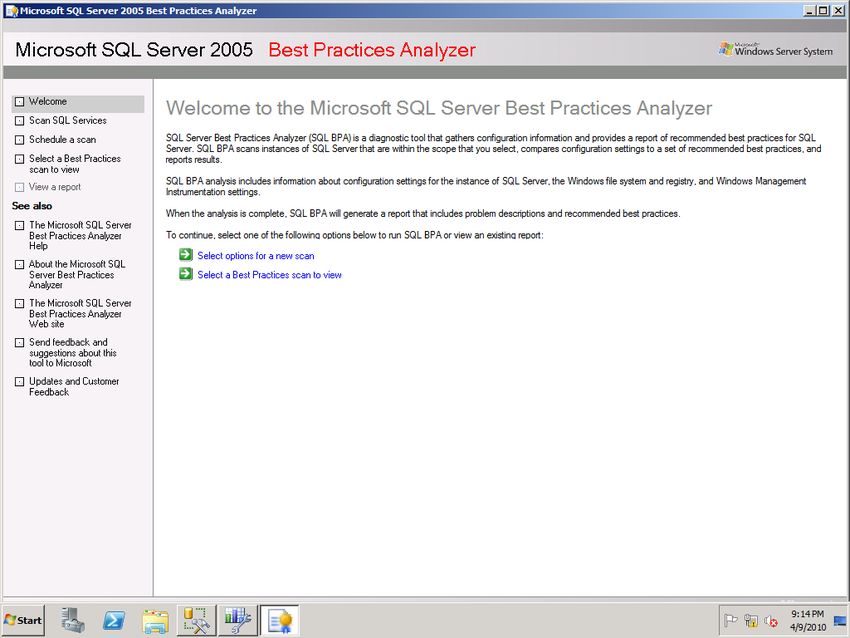
2. The application Welcome screen will appear.3. To begin, click Select options for a new scan. 4. The Start a New Best Practices Scan step will appear.
5. On your first run, select the Detail scan radio button, enter a name for the scan such as
   Initial Install, and then click Scan selected components.

6. A progress step will appear.

7. When the scan completes, a link called View a report of this Best Practices scan will
   appear. Click this link.
8. BPA will build the report and then present it.

Expected Windchill Exceptions
The BPA report may show the exception shown in Error! Reference source not found.; do not
correct it.
Table 2 - Expected BPA Violations

Authentication Mode Violation                    Recommended Action
SQL Login Password Policy Violation by           Do not take any action—by design
Login[wcAdmin]

Either correct all other violations or document the reason for the violation. PTC recommends
running BPA on the frequency shown in Error! Reference source not found..
Table 3 - Recommended Frequency for Running BPA

Time Since               Frequency                 Action
Installation
First day                Once                      Ensure that best practices were followed for the
                                                   installation
After 6 weeks            Quarterly                 Ensure that unauthorized changes have not
                                                   happened

Further Securing Your Windchill Database
The National Institute of Standards and Technology (NIST) created the Security Content
Automation Protocol (SCAP) program with extensive consolidation of best OS and SQL Server
practices. This program lists various vendor products that have passed certification for checking
system security. PTC suggests using a scanner from this list in parallel to BPA.

SQL Server 2005 Performance Dashboard
A joint effort between the support and development teams at Microsoft resulted in the
Performance Dashboard. The goal was to reduce the amount of time spent discovering the
source of a performance problem, allowing efforts to be focused on resolving the problem. The
dashboard reports rely exclusively on SQL Server 2005 dynamic management views (DMVs),
using data that is already captured and always available.

The data represents information gathered since the database started. There is zero
performance impact of using the dashboard except when you actually open/refresh a report.
The recommended schedule for viewing the reports is daily while the system is first stabilizing
after installation or any major change/update, and then weekly thereafter.

After downloading and installing the dashboard, you need to execute a single script to enable
the Performance Dashboard. This setup.sql file will typically be located at C:\Program Files
(x86)\Microsoft SQL Server\90\Tools\PerformanceDashboard after installation of the download,
as Error! Reference source not found. shows. The Performance Dashboard does not consume
additional resources.

Figure 1 - The setup.sql script for Performance Dashboard
Note: You should install the Performance Dashboard on your desktop machine and run it from
there, not on the SQL Server machine.
Performance Dashboard Reports
Here is how to view the Performance Dashboard reports:
1. Open SSMS.
2. Select the wcAdmin database.
3. Right-click and select Reports, Custom Reports…
4. An Open File dialog box will appear. Navigate to the installation folder—C:\Program
Files (x86)\Microsoft SQL Server\90\Tools\PerformanceDashboard—and select
performance_dashboard_main.rdl.5. The Reports menu options will change, with a performance_dashboard_main item added. 6. When the warning dialog box appears, select the Please do not show this warning again box and click Run.
7. The dashboard will now appear.
8. Click any of the hyperlinks to drill down into further reports. For example, Expensive
   Queries – CPU consists of two parts:
       a. A chart of the most expensive queries—in this example, three items consume
           considerably more resources than the others do.

        b. The queries themselves and detail information such as the number of times
           executed.
9. The report that you should pay special attention to is the Missing Indexes report,
located at the bottom of the dashboard page under Miscellaneous Information.
10. When you click the Missing Indexes link, you see the recommendation and the
definition of the proposed new index.
a. These index recommendations usually represent those that can produce the
greatest immediate impact and are preferred over the DTA recommendations
for adding new indexes.
If you hear rumors of slow performance, the Performance Dashboard should be your first plan
of action; you should view all the reports and drill down into the issues. For additional reports
and information about them, see SQL Server Management Studio Standard Reports – The Full
List. In terms of proactive maintenance, PTC recommends following the schedule that Error!
Reference source not found. shows.
Table 4 - Recommended Proactive Use of Performance Dashboard
Time Since Frequency Action
Installation
For first 6 weeks Daily Review for any performance issue exposed
with building load on Windchill
After 6 weeks Weekly Include a few charts in any weekly reports
you send out; it is both good user-
relationship management and ensures that
you are reviewing the reports
Caveat: Collected information is lost whenever SQL Server restarts. If you want to retain this
information, see the following Codeplex project, sponsored by the Microsoft SQL Server
Customer Advisory Best Practices Team: SQL DMVStats 1.01.
For more information about Performance Dashboard, see:
Making the Most Out of the SQL Server 2005 Performance Dashboard
SQL Server 2005 Performance Dashboard Reports
SQL Server 2005 Performance Dashboard Reports—Now Available!Performance Analysis of Logs (PAL) PAL steps outside of the SQL Server world and looks at the ecosystem that SQL Server is running in. PAL reads in a Performance Monitor counter log (any known format) and analyzes it using complex but known thresholds provided in the tool. The tool then generates an HTML-based report, which graphically charts important performance counters and throws alerts showing exceeded thresholds. Microsoft product teams and members of Microsoft Support defined the thresholds. Do not install PAL on the machine running SQL Server but rather download and install it on your desktop machine because it requires installation of several additional components. A best practice is to keep the SQL Server machine as a dedicated machine. Only install what is required for SQL Server to run. When you install PAL, you also need to install: Log Parser 2.2 Microsoft Office 2003 Add-in: Office Web Components Because there is a training video available at Performance Analysis of Logs (PAL) Tool, we will give you just a quick overview of what this tool provides. PAL produces a summary page of the analysis with the number of items found, as shown in Error! Reference source not found..
Figure 2 - PAL Summary Page

Clicking any of the analysis links drills down into the issue, including a link to further reading on
the problem found, as shown in Error! Not a valid bookmark self-reference..
Figure 3 - PAL Drill-down Page
Like the Performance Dashboard reports, PAL is a proactive maintenance tool, and its usage
should follow the same pattern, as shown in Error! Reference source not found..
Table 5 - Recommended Schedule for PAL Reviews
Time Since Frequency Action
Installation
For first 6 weeks Daily Review for any performance issue exposed
with building load on Windchill
After 6 weeks Weekly Include a few charts in any weekly reports
you send out; it is both good user-
relationship management and ensures that
you are reviewing the reports
For more information about Windows ecosystem performance, see
Clint Huffman's Windows Performance Blog
Clint Huffman's Windows Troubleshooting in the Field BlogSummary
The tables below summarize the minimum recommended practices using these maintenance
tools. The critical items listed in Error! Reference source not found. are good items to include as
bullets in weekly reports. The suggested items listed in Error! Reference source not found. are
routine maintenance items that should be included in weekly reports when exceptions occur.
Table 6 - Summary of Recommended Run Schedule for Maintenance Tools
Time from Install Frequency Tools
On install Once BPA
First 6 weeks Daily Dashboard Reports
Daily PAL
Weekly Run DTA with default settings
First year Monthly Run DTA with indexes and index views; include
filtered indexes
After 1 quarter Weekly Dashboard Reports
Weekly PAL
Quarterly Run DTA with full partitioning
Quarterly Run DTA with indexes and index views; include
filtered indexes
Quarterly BPA
You can also consider using additional tools, such as:
SQL Server Health and History Tool (SQLH2)3
o Performance Collector
o Reports
However, these tools often have a high percentage of content overlap with reports available
from the tools we covered and may not provide significant payback for the time required for you
to review the information.
3
http://sqlh2.codeplex.com/ has the latest version; the old version on Microsoft.com may hang on some
machines.Table 7 - Minimum Frequency of Other Maintenance Tasks
At least Tools
Every 45 minutes Transaction log backup
Every 3 hours SQL Server database backup (Differential)
Daily SQL Server database backup (Full)
Check Database Integrity
Weekly SQL Server database backup (Full) and copy to
offsite location
Rebuild Index (does Update Statistics also)
PTC suggests the following task sequence starting at 11pm daily:
1. Check Database Integrity
2. Rebuild Indexes (ALL)
3. Cleanup History
Follow the above tasks with this sequence one or more hours later:
1. Check Database Integrity (DBCC CHECKDB)
2. Backup Database (Full) – with verify backup integrity
3. Maintenance Cleanup Task
PTC suggests a differential database backup and transaction log backup plan such as the one in
Error! Reference source not found. for an 8am-5pm workday.
Table 8 - Full, Differential, and Transaction Log Backup Plan
Time Activity
Midnight DBCC CHECKDB
Full backup
Maintenance Cleanup
8:45 Transaction Log backup
9:30 Transaction Log backup
10:15 Differential backup
11:00 Transaction Log backup
11:45 Transaction Log backup
12:30 Differential backup
13:15 Transaction Log backup
14:00 Transaction Log backup
14:45 Differential backup
15:30 Transaction Log backup
16:15 Transaction Log backup
16:15 Transaction Log backup
23:00 DBCC CHECKDB
Rebuild Indexes
Cleanup History
You can automate some of the above maintenance items through SSMS. In the Object Explorer,
select Server\{Windchill database name}, Management, Maintenance Plans.For information about Maintenance Plans, see:
How to: Create a Maintenance Plan
Information about the Maintenance Plan Wizard in SQL Server 2005 and about tasks
that administrators can perform against SharePoint databases
Maintenance Plan Changes in SQL Server 2005 SP2
Maintenance Plan Wizard
Setting up a Maintenance Plan to Backup Databases
Top Tips for Effective Database MaintenanceLinks for Further Information
PTC Windchill
Microsoft SQL Server: Improved Performance for PTC Windchill
Windchill and Pro/INTRALINK 9.0 and 9.1 Server Hardware Sizing Guidelines – Microsoft
Windows Platform
SQL Server information can be found in Books Online:
SQL Server 2008 Books Online
SQL Server 2005 Books Online
SQL Server Books Online also includes best practice information in the following articles:
Best Practices for Replication Administration
Replication Security Best Practices
Best Practices for Recovering a Database to a Specific Recovery Point
See the SQL Server Best Practices portal for technical white papers, the SQL Server Best
Practices Toolbox, Top 10 Lists, and other resources.
Following is a list of technical white papers that were tested and validated by the SQL Server
development team. These can help you learn more about specific SQL Server topics.
A Quick Look at Serial ATA (SATA) Disk Performance
Benchmark for Microsoft SQL Server 2005 (Version 1.1.1)
Best practices for operational excellence
Best Practices for Running SQL Server on Computers That Have More Than 64 CPUs
Best Practices for Semantic Data Modeling for Performance and Scalability
Checklist: SQL Server Performance
Checksum Problems, Choosing the Correct Recovery Model and More
Comparing Tables Organized with Clustered Indexes versus Heaps
Database Mirroring and Log Shipping Working Together
Database Mirroring Best Practices and Performance Considerations
Database Mirroring in SQL Server 2005
Database Snapshot Performance Considerations Under I/O-Intensive Workloads
DBCC SHOWCONTIG Improvements and Comparison between SQL Server 2000 and SQL
Server 2005
Description of using disk drive caches with SQL Server that every database administrator
should know
Disk Partition Alignment Best Practices for SQL Server
FLASH Disk Opportunity for Server-Applications Generic Database Security Checklist (Version 8, Release 1.3)
How to mirror the system and boot partition (RAID1) in Windows Server 2003
How to use the SQLIOSim utility to simulate SQL Server activity on a disk subsystem
How To: Use SQL Profiler
Identifying and Resolving MDX Query Performance Bottlenecks in SQL Server 2005
Analysis Services
Implementing Application Failover with Database Mirroring
Improving SQL Server Performance
Microsoft SQL Server 2005 Tuning Tips for PeopleSoft 8.x
Microsoft SQL Server Database Engine Input/Output Requirements
Microsoft SQL Server I/O Basics (2005)
Microsoft SQL Server I/O subsystem requirements for the Temp Db database
Monitor and troubleshoot storage performance
Partial Database Availability
Performance of WD 250GB SATA Drives + 3ware Controller
Physical Database Storage Design
Precision Considerations for Analysis Services Users
Pre-Configuration Database Optimizations
Pre-Deployment I/O Best Practices
RML Utilities for SQL Server (x64)
SAP with Microsoft SQL Server 2005: Best Practices for High Availability, Maximum
Performance, and Scalability
SQL Server 2005 Best Practices Analyzer (August 2008)
SQL Server 2005 Deployment Guidance for Web Hosting Environments
SQL Server 2005 Performance Dashboard Reports
SQL Server 2005 Security Best Practices - Operational and Administrative Tasks
SQL Server 2005 Waits and Queues
SQL Server 7.0, SQL Server 2000, and SQL Server 2005 logging and data storage
algorithms extend data reliability
SQL Server Best Practices
SQL Server Best Practices Article
SQL Server Health and History Tool (SQLH2)
SQL Server Replication: Providing High Availability Using Database Mirroring
SQLIO Disk Subsystem Benchmark Tool
Storage Top 10 Best Practices
Support WebCast: How to Effectively Use SQL Server Profiler
Technical Note #28: Common QA for deploying SQL Server ... TEMPDB Capacity Planning and Concurrency Considerations for Index Create and
Rebuild
Top Tips for Effective Database Maintenance
Troubleshooting Performance Problems in SQL Server 2005
Uncover Hidden Data to Optimize Application Performance
Understanding Logging and Recovery in SQL Server
Understanding SQL Server Backups
Windows Server 2003 Security Guide for Member Servers (2.1)
Bibliography
SQL Server MVP Deep Dives (Manning, 2010), Paul Nielsen, Kalen Delaney, et al.
Mastering SQL Server Profiler (Red Gate Books, 2009), Brad McGehee
Professional SQL Server 2005 Performance Tuning (Wiley Publishing, 2008), Steven
Wort, Christian Bolton, et al.
Inside Microsoft SQL Server™ 2005: The Storage Engine (Microsoft Press, 2006), Kalen
Delaney
Professional SQL Server 2005 Administration (Wiley, 2006), Brian Knight, Ketan Patel, et
al.
SQL Server 2005 Bible (Wiley, 2006), Paul NielsenYou can also read