Bitcoin Mining Activity and Volatility Dynamics in the Power Market
←
→
Page content transcription
If your browser does not render page correctly, please read the page content below
?
   Bitcoin Mining Activity and Volatility Dynamics in the Power Market

                               Sayar Karmakara , Riza Demirerb , Rangan Guptac,∗
                                  a University  of Florida, Gainesville, FL, 32611, USA.
                             b Southern Illinois University Edwardsville, IL 62026-1102, USA.
                                   c University of Pretoria,Pretoria 0002, South Africa.

Abstract
Utilizing a measure of the Bitcoin network’s daily electricity load, we document a significant volatility effect
of Bitcoin mining activity in three prominent electricity markets in the U.S. The volatility effect is found to be
increasing over time, particularly with the widespread lockdowns enforced due to the COVID-19 pandemic.
The findings provide novel insight to the non-virtual side of mining and trading of cryptocurrencies and
underscore the need for establishing mechanisms to prevent possible destabilizing effects of this growing
industry, both from a power consumption and carbon emissions perspective.
Keywords: Time-varying, GARCH, Bitcoin, Electricity returns
JEL Codes: C32, C53, Q41

   ? Declarations of interest: none. We would also like to thank the Editor, Professor Max Croce, and an anonymous referee

for helpful comments. However, any remaining errors are solely ours.
   ∗ Corresponding author.

     Email addresses: sayarkarmakar@ufl.edu (Sayar Karmakar), rdemire@siue.edu (Riza Demirer), rangan.gupta@up.ac.za
(Rangan Gupta )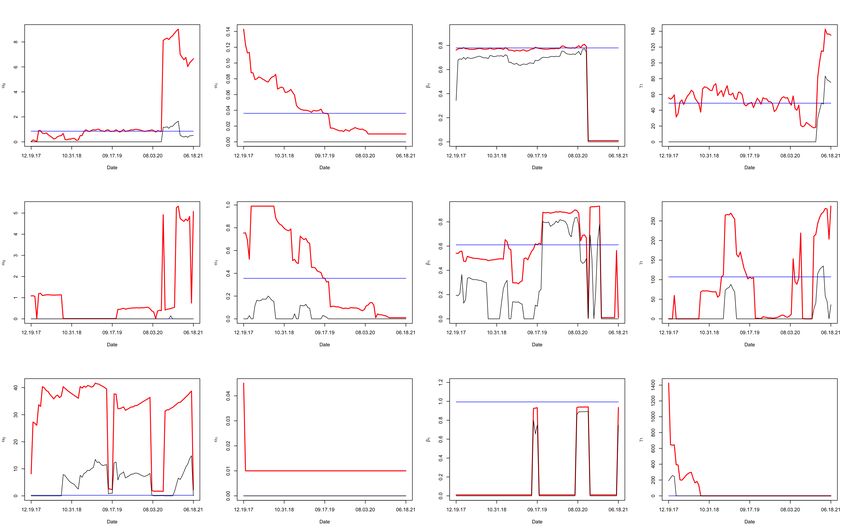
1. Introduction

    The digital gold rush into cryptocurrencies has led to an unprecedented growth in the market value,
trading and mining of these assets, driving total market capitalization in cryptocurrencies from around one
billion USD in early 2013 to close to two trillion USD in September 2021.1 Not surprisingly, cryptocurrencies,
Bitcoin (BTC) in particular, have also attracted increasing attention from academics who examined these
assets from various perspectives including their portfolio diversification and hedging benefits for conventional
investment portfolios (Bouri et al. (2017); Shahzad et al. (2019); Smales (2019)), return and volatility
dynamics (Aalborg et al. (2019)); price efficiency (Urquhart (2016)), return/volatility transmissions with
other asset classes (Bouri et al. (2018)), and liquidity patterns (Scharnowski (2021)), among others. The
fast growth in the mining and financial trading of these assets, however, has been accompanied with a
large carbon footprint fueled by the vast energy consumption due to mining activity. In fact, according
to the Bitcoin Electricity Consumption Index project maintained by the Digital Assets Programme (DAP)
Team at the Centre for Alternative Finance at the University of Cambridge, as of September 2021, bitcoin
mining now consumes around half as much electricity as the U.K., surpassing the total annual electricity
consumption of countries like Sweden, Ukraine and Australia. Against this background, the goal of this
paper is to present novel perspective to the carbon footprint of bitcoin mining by examining, for the first
time in the literature, the effect of mining activity on the price and volatility dynamics in three prominent
U.S. power markets.
    Thanks to the liberalization of the power market towards a competitive setting over the past several
decades, today, electricity can be traded as any other commodity at market driven rates. However, unlike
other commodities, several features of electricity distinguish it from other tradable commodities, which in
turn lead to extreme price volatility and unanticipated spikes in prices. Demand-driven volatility factors
in this market are largely due to the price inelastic and weather or business cycle dependent nature for
electricity demand while, on the supply side, since electricity cannot be stored, consumption has to be
balanced with production due to lack of an inventory planning option (Weron and Misiorek (2008)). From
an investment planning perspective, price uncertainty and extreme volatility in the electricity market is not
only a major operating risk for utility companies, but also crucial for the real economy as electricity price
forecasts have become a fundamental input for corporate decisions (Bunn (2004); Eydeland and Wolyniec
(2002)).In fact, recent studies show that industrial electricity usage growth rate carries predictive ability
over stock returns up to one year (Da et al. (2017))) where the predictive power of industrial electricity usage
is explained by an “industry effect” that is transmitted via the volatility channel (Bonato et al. (2018)). Not
surprisingly, there is a growing literature on the predictability of daily electricity prices with a particular
focus on the price behavior in the day-ahead spot market.2 Surprisingly, however, despite the large number
of works on the predictability of electricity prices, the literature has not yet examined the effect of the
growing energy consumption needed to mine and maintain Bitcoin on the price dynamics and volatility in
electricity prices.
    Utilizing daily spot price data for three prominent U.S. power markets, namely Northern Illinois hub
(NI), Western Hub (West) and New England hub (NE), and the Cambridge Bitcoin Electricity Consumption
Index, developed by the Centre for Alternative Finance at the University of Cambridge, as a measure of
the Bitcoin network’s daily electricity load, we document a significant volatility effect of bitcoin mining
activity in the electricity market. While our tests suggest insignificant price effects, we observe significant
forecasting gains over the volatility patterns in electricity prices due to Bitcoin mining activity. Further
extending the test to a time-varying setting, we find that the impact of the Bitcoin consumption index
on electricity market volatility is increasing over time in parallel with the unprecedented growth in the
mining and trading of these assets. The rising trend in the volatility effect of Bitcoin mining activity indeed
corresponds to the COVID-19 pandemic period during which an increase in trading volume and volatility
in Bitcoin futures is documented, driven by an increase in the belief dispersion due to the pandemic related

  1 https://coinmarketcap.com.
  2 See   Weron (2014) for a detailed review of this literature.

                                                                   2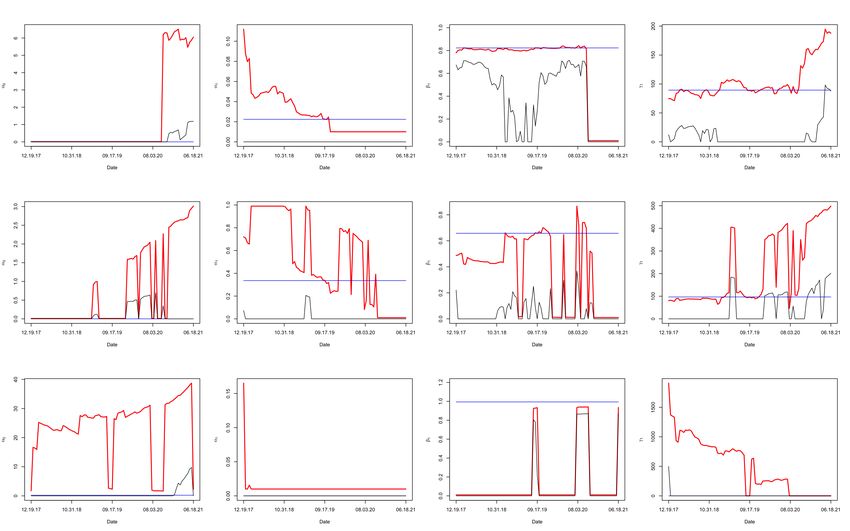
market uncertainty (Guzmán et al. (2021), Park (2022)). The findings provide novel insight to the non-
virtual side of mining and trading of cryptocurrencies and underscore the need for establishing mechanisms
to prevent possible destabilizing effects of this growing industry, both from a power consumption and carbon
emissions perspective. The remainder of the paper is organized as follows. Section 2 describes the data and
the time-varying Regression+ GARCHX in volatility model utilized in our tests. Section 3 presents the
empirical findings and Section 4 concludes with further discussion.

2. Impact of BTC energy consumption on mean and volatility of electricity pricing

2.1. Data
    In this exposition, we choose our response variable to be the electricity pricing returns in three different
prominent U.S. markets, namely Northern Illinois hub (NI), Western Hub (West) and New England hub
(NE). Daily spot price data over the period Dec. 19, 2017- June 18, 2021 is obtained from Commodity
Systems Inc. and the Cambridge Bitcoin Electricity Consumption Index is used to measure the Bitcoin
network’s daily electricity load.3 . Because the exact electricity consumption value cannot be determined, a
hypothetical range consisting of a lower bound, upper bound and best-guess estimate is computed where the
lower (upper) bound is based on the assumption that all miners always use the most (least) energy-efficient
equipment available on the market. The best-guess estimate is based on the more realistic assumption that
miners use a basket of profitable hardware rather than a single model. Understandably, the sample period
is governed by the availability of the Bitcoin consumption index series.

2.2. Method for Time-varying estimation
   Let yt stand for the return on the t-th day on a particular electricity market. We wish to regress the
mean and variance of yt on three different bitcoin consumption index series (BCI henceforth) available, i.e.
max , min and guess based on the upper/lower bounds and the best-guess estimate, respectively. This yields
9 different scenarios given 3 choices each for the response and the covariate. Considering that our sample
period covers the COVID-19 pandemic and the evidence that associates pandemic lockdowns with increasing
trading activity in cryptocurrencies including Bitcoin (e.g. Guzmán et al. (2021), Park (2022)), we utilize
the following time-varying Regression+ GARCHX in volatility model (see Francq et al. (2019); Sucarrat
(2021)) formulated as

   yt ∼ N (µ0 (t/n) + µ1 (t/n)Xt , σt2 ) with σt2 = α0 (t/n) + α1 (t/n)yt−1
                                                                        2              2
                                                                            + β1 (t/n)σt−1 + γ(t/n)|Xt |,   (2.1)

where Xt stands for the covariate used at time-stamp t. Note that the log-returns of the covariates are
employed in the model in order to make them stationary.
   For a suitable choice of kernel K and bandwidth bn ∈ [0, 1] we use, for the parameter estimation of θ.
                                                 n
                                                 X
                             θ̂bn (t) = argmin         K((t − i/n)/bn )`(yi , Xi , θ)   t ∈ [0, 1].         (2.2)
                                         θ∈Θ     i=1

where `(·) is the corresponding negative log-likelihood or quasi log-likelihood for estimating the GARCH
parameters. In particular, we use the rectangular kernel here for the choice of K so as to be able to
use the standard lm and garchx routine. Moreover, as we describe later, forecasting future observations
even in a time-varying model requires a stationary in-sample estimation so we wanted to remain consistent
throughout. Note that, under some mild smoothness conditions, the final implications should not differ too
much for using a specific kernel as discussed in Karmakar et al. (2021). This reduces the estimation at
time-point t with the parameters assuming there is a stationary model for time-stamps max{1, t − nbn } to
min{n, t + nbn }.

  3 For   further details, see: https://cbeci.org/.

                                                                 3
3. Empirical findings
Towards estimating θ(·) = (µ0 (·), µ1 (·))0 in the context of (2.1), we choose the following Gaussian log-
likelihood:
`(yi , Xi , θ) = (yi − µ0 − µ1 Xi )2 .
Our results are robust even when we implemented a GARCH(1,1) error specification instead of the rather
simplistic homoscedastic likelihood as above. We plot the pointwise confidence band for all the cases in
Figure 1. In each of these cases, one can see the horizontal line of nullity passing through the confidence
bands for both coefficients, establishing the insignificance of the covariate in regressing electricity pricing
returns. Thus, we observe largely insignificant effects of the BTC energy consumption indices on the mean
of electricity returns.
In the light of insignificant mean effects, we proceed with simply modeling price volatility using the
garchx R package. In the context of the time-varying model in (2.1), we choose the following likelihood
function to estimate θ0 (·) = (α0 (·), α1 (·), β1 (·), γ(·))0 ,
1
`(yi , Xi , θ0 ) = − log σ 2 + yi2 /σ 2 with σ 2 = α0 + α1 yi−1
2 2
+ β1 σi−1 + γ|Xi |.
2
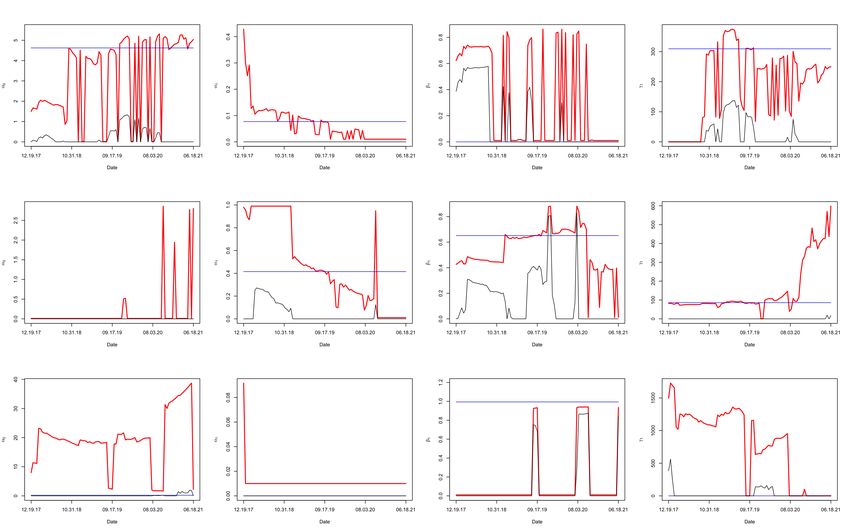
We present the time-constant estimates, the estimated four coefficients (as function of time) and their
lower intervals based on one-sided confidence intervals in Figures 2, 3 and 4. These confidence intervals are
constructed based on θ̂ − 1.645se(θ̂) following the pointwise central limit theory from Karmakar et al. (2021)
for a time-varying specification. Further detail on the method to compute these estimates is provided in
Francq et al. (2019). It is well-known in the GARCH literature that for GARCH(1,1) models, the ARCH
and GARCH effects are small and large, respectively. Our confidence bands show that the volatility effects
and the covariate effects were significant in most of the time-spectrum when it was estimated to be positive.4
Towards gauging the behavior of these estimates over time, it is clear that except for the NE market,
the effect of covariates are generally increasing from the second half of 2020 until the end of the sample,
indicating the increasing impact of covariates over time. Thus, while the findings point to the presence of
a volatility effect of Bitcoin mining activity in the electricity market, we also find that the effect is indeed
increasing over time, particularly starting with the second half of 2020. The rising pattern in the volatility
effect, particularly during the period when the pandemic has become more widespread with lockdowns
enforced globally, is in line with the evidence in several recent studies including Guzmán et al. (2021) and
Park (2022) that investors became active participants during the COVID-19 pandemic period and traded
more bitcoins on days with low mobility associated with lockdown mandates. While Park (2022) suggests
that the increase in trading volume and volatility in BTC futures is induced by the increase in belief
dispersion due to the pandemic related market uncertainty, Divakaruni and Zimmerman (2021) show that
the wealth shock induced by the U.S. government’s economic impact payment program in 2020 has led to a
significant increase in Bitcoin buy trades, particularly among individuals without families and at exchanges
catering to nonprofessional investors. Nevertheless, it is interesting that the volatility effect on the electricity
market due to the Bitcoin consumption index becomes particularly significant during the pandemic period
that is associated with herding behavior in global financial markets (Bouri et al. (2021)) and increased
trading activity in cryptocurrencies. Further extending the analysis to a forecasting context, additional
tests corroborate the importance of the choice of covariates by providing evidence that the inclusion of the
Bitcoin consumption index provides significant forecasting gains as well. These gains are viewed through
the lens of CW tests, the statistical hypothesis tests from Clark and West (2007) adapted for log-returns
variance. In particular, given that both the intercept and slope for the covariates are found to be insignificant
in Section 2, we simply use yt2 as our target forecast and the fitted variance from two models, σ̂t2 and σ̂t0 2
(without covariate) as the two competing forecasts.
4 Based on the suggestions of an anonymous referee, we also estimated asymmetric GARCH models, and consistent with the
symmetric version of the same, we found that our basic findings are qualitatively similar, i.e., the predictors fail to have any
statistically significant effect on electricity returns, but increases its volatility in a statistically signficant fashion. Complete
details of these results are available upon request from the authors.
4Table 1 presents the forecasting gains for nahead days based on the full model that includes the bitcoin
indexes and the benchmark model that does not include the covariates. Note that m is our in-sample length,
in other words, we choose an in-sample of yt−m+1 , · · · , yt to fit a stationary GARCHX using the garchx
package in R. This allows us to use the predict routine to obtain predictions for nahead steps. As was
discussed in Karmakar et al. (2021), a time-varying forecast remains difficult to be properly defined given
the popular in-fill asymptotics culture in the time-varying literature and a stationary fit for the last m
observations along with rolling this window provides the best possible time-varying estimation. The choice
for nahead was made to predict the one-day, one-week and one-month ahead forecasts. For brevity, we present
in Table 1 the results for m = 200 only, but when we extend the analysis to other values of m such as 400
or 600, we obtain similar results. We also report in the table the ratio of MSPE (Mean-square prediction
errors) for the two models. We observe that most of the p-values are small and the MSPE values for the
augmented model that includes the Bitcoin consumption index are generally smaller in most cases and
almost similar in few cases. This ascertains the predictive information captured by the Bitcoin consumption
index over the subsequent volatility patterns in the electricity market. Considering that the literature on
the predictability of daily electricity prices generally focuses on the price behavior in the day-ahead spot
market (Weron (2014)), our finding present a novel opening on the predictive role of Bitcoin mining proxies
to improve the accuracy of electricity forecasting models.
4. Conclusion
Utilizing the Bitcoin Electricity Consumption Index, developed by by the Digital Assets Programme
Team at the Centre for Alternative Finance at the University of Cambridge, we document a significant
volatility effect of Bitcoin mining activity in three prominent electricity markets in the U.S. While the re-
sults do not yield a significant impact on mean electricity returns, we observe an increasing volatility effect
in electricity spot prices, particularly starting with the global lockdowns enforced due to the COVID-19
pandemic. The rising pattern in the volatility effect, particularly during the period when the pandemic has
become more widespread with lockdowns enforced globally, is in line with the evidence in recent studies
including Guzmán et al. (2021) and Park (2022) that investors became active participants in the cryp-
tocurrency market during the COVID-19 pandemic period and the evidence of herding behavior in global
financial markets driven by the pandemic induced market uncertainty (Bouri et al. (2021)). Nevertheless,
the evidence of significant forecasting gains due to Bitcoin mining activity presents an opening to better
model and monitor price fluctuations in the power market with significant hedging and investment planning
implications. In future research, it will be interesting to employ alternative dynamic models including the
full-fledged flexible kernel-based time-varying fit or the Bayesian time-varying GARCH estimation technique
proposed in Karmakar and Roy (2021) in order to check the robustness of the volatility effect observed. Nev-
ertheless, the findings provide novel insight to the non-virtual side of mining and trading of cryptocurrencies
and underscore the need for establishing mechanisms to prevent possible destabilizing effects of this growing
industry, both from a power consumption and carbon emissions perspective.
References
Aalborg, H.A., Molnár, P., de Vries, J.E., 2019. What can explain the price, volatility and trading volume of bitcoin? Finance
Research Letters 29, 255–265.
Bonato, M., Demirer, R., Gupta, R., 2018. The predictive power of industrial electricity usage revisited: evidence from
non-parametric causality tests. OPEC Energy Review 42, 93–106.
Bouri, E., Das, M., Gupta, R., Roubaud, D., 2018. Spillovers between bitcoin and other assets during bear and bull markets.
Applied Economics 50, 5935–5949.
Bouri, E., Demirer, R., Gupta, R., Nel, J., 2021. Covid-19 pandemic and investor herding in international stock markets. Risks
9, 168.
Bouri, E., Molnár, P., Azzi, G., Roubaud, D., Hagfors, L.I., 2017. On the hedge and safe haven properties of bitcoin: Is it
really more than a diversifier? Finance Research Letters 20, 192–198.
Bunn, D.W., 2004. Modelling prices in competitive electricity markets.. volume 1st edition. Wiley Publishers, Hoboken, New
Jersey, USA.
5Clark, T.E., West, K.D., 2007. Approximately normal tests for equal predictive accuracy in nested models. Journal of
econometrics 138, 291–311.
Da, Z., Huang, D., Yun, H., 2017. Industrial electricity usage and stock returns. Journal of Financial and Quantitative Analysis
52, 37–69.
Divakaruni, A., Zimmerman, P., 2021. Uncovering retail trading in bitcoin: The impact of covid-19 stimulus checks. Federal
Reserve Bank of Cleveland Working Papers, WP 21-13.
Eydeland, A., Wolyniec, K., 2002. Energy and power risk management: New developments in modeling, pricing, and hedging.
volume 97. John Wiley & Sons.
Francq, C., et al., 2019. Qml inference for volatility models with covariates. Econometric Theory 35, 37–72.
Guzmán, A., Pinto-Gutiérrez, C., Trujillo, M.A., 2021. Trading cryptocurrencies as a pandemic pastime: Covid-19 lockdowns
and bitcoin volume. Mathematics 9, 1771.
Karmakar, S., Richter, S., Wu, W.B., 2021. Simultaneous inference for time-varying models. Journal of Econometrics doi:https:
//doi.org/10.1016/j.jeconom.2021.03.002.
Karmakar, S., Roy, A., 2021. Bayesian modelling of time-varying conditional heteroscedasticity. Bayesian Analysis 1, 1–29.
Park, B., 2022. The covid-19 pandemic, volatility, and trading behavior in the bitcoin futures market. Research in International
Business and Finance , 101519.
Scharnowski, S., 2021. Understanding bitcoin liquidity. Finance Research Letters 38, 101477.
Shahzad, S.J.H., Bouri, E., Roubaud, D., Kristoufek, L., Lucey, B., 2019. Is bitcoin a better safe-haven investment than gold
and commodities? International Review of Financial Analysis 63, 322–330.
Smales, L.A., 2019. Bitcoin as a safe haven: Is it even worth considering? Finance Research Letters 30, 385–393.
Sucarrat, G., 2021. garchx: Flexible and Robust GARCH-X Modeling. The R Journal 13, 276–291. URL: https://doi.org/
10.32614/RJ-2021-057, doi:10.32614/RJ-2021-057.
Urquhart, A., 2016. The inefficiency of bitcoin. Economics Letters 148, 80–82.
Weron, R., 2014. Electricity price forecasting: A review of the state-of-the-art with a look into the future. International Journal
of Forecasting 30, 1030–1081.
Weron, R., Misiorek, A., 2008. Forecasting spot electricity prices: A comparison of parametric and semiparametric time series
models. International Journal of Forecasting 24, 744–763.
6Fig. 1: Time-varying regression coefficients with pointwise confidence bands. The rows stand for the covariates Max, Min
and Guess BCI, while the column stands for the responses for NI, West and NE electricity spot markets. Each image has the
horizontal line of zero passing through the 95% pointwise bands.
7Fig. 2: Time-varying garchx plot for Max BCI. The rows stand for the responses for NI, West and NE electricity spot markets.
The black curve represents the lower endpoint of one-sided pointwise 95% confidence band. The blue line stands for the
time-constant estimate.
8Fig. 3: Time-varying garchx plot for Min BCI. The rows stand for the responses for NI, West and NE electricity spot markets.
The black curve represents the lower endpoint of one-sided pointwise 95% confidence band. The blue line stands for the
time-constant estimate.
9Fig. 4: Time-varying garchx plot for Guess BCI. The rows stand for the responses for NI, West and NE electricity spot
markets. The black curve represents the lower endpoint of one-sided pointwise 95% confidence band. The blue line stands for
the time-constant estimate.
10Table 1: Forecasting gain results for m = 200. M SP E1 and M SP E2 stand for the models without the covariates and the
full model respectively. P-values correspond to the CW test. M SP E1 /M SP E2 > 1 signifies the BTC covariates provide
forecasting gains.
nahead = 1 nahead = 5 nahead = 20
Data pvalue M SP E1 /M SP E2 pvalue M SP E1 /M SP E2 pvalue M SP E1 /M SP E2
Max NI 0.099 0.99683 0.065 1.28024 0.816 0.04007
Max West 0.024 1.03230 0.077 3.22436 0.155 10.77268
Max NE 0.738 0.99288 0.839 0.40212 0.109 0.86348
Min NI 0.181 0.99818 0.147 9.57209 0.078 4.58211
Min West 0.040 1.03682 0.202 0.97545 0.157 165.1649
Min NE 0.714 0.99094 0.082 2.54933 0.149 25.55265
Guess NI 0.029 1.07761 0.055 1.63147 0.141 16.22775
Guess West 0.051 1.05985 0.475 0.17272 0.352 0.01990
Guess NE 0.157 1.25996 0.063 7.91852 0.156 63.98823
11You can also read