Black Swan Events and Safe Havens: The role of Gold in Globally Integrated Emerging Markets
←
→
Page content transcription
If your browser does not render page correctly, please read the page content below
Munich Personal RePEc Archive

Black Swan Events and Safe Havens: The
role of Gold in Globally Integrated
Emerging Markets

Bekiros, Stelios and Boubaker, Sabri and Nguyen, Duc
Khuong and Uddin, Gazi Salah

European University Institute, Florence, Italy, Champagne School of
Management (Groupe ESC Troyes), Troyes, France, IPAG Business
School, Paris, France, Linköping University, Linköping, Sweden

October 2015

Online at https://mpra.ub.uni-muenchen.de/75740/
MPRA Paper No. 75740, posted 22 Dec 2016 09:36 UTC
BLACK SWAN EVENTS AND SAFE HAVENS: THE ROLE OF GOLD IN GLOB-
 ALLY INTEGRATED EMERGING MARKETS ♣

 Stelios Bekirosa,b, Sabri Boubakerc, Duc Khuong Nguyenb,*, Gazi Salah Uddind

 a
 European University Institute, Florence, Italy
 b
 IPAG Business School, Paris, France
 c
 Champagne School of Management (Groupe ESC Troyes), Troyes, France
 d
 Linköping University, Linköping, Sweden

ABSTRACT

There is evidence to suggest that gold acts as both a hedge and a safe haven for equity markets
over recent years, and particularly during crises periods. Our work extends the recent literature on
hedging and diversification roles of gold by analyzing its interaction with the stock markets of the
leading emerging economies, the BRICS. Whilst they generally exhibit a high growth rate, these
economies still experience a pronounced vulnerability to external shocks, particularly to com-
modity price fluctuations. Using a multi-scale wavelet approach and a GARCH-based copula
methodology, we mainly show evidence of: i) the time-scale co-evolvement patterns between
BRICS stock markets and gold market, with some profound regions of concentrated extreme var-
iations; and ii) a strong time-varying asymmetric dependence structure between those markets.
These findings are essential for risk diversification and portfolio hedging strategies amongst the
investigated markets.

Keywords: Equity markets; Copulas; Gold; Time-scale analysis.
JEL Codes: G1; C14; C32; C51

♣
 Acknowledgements: The authors would like to thank the two anonymous referees, the guest-editors (Georgios Kou-
retas and Athanasios Papadopoulos), the co-editor of the Journal of International Money and Finance (Joshua
Aizenman), Dirk Baur, Robert Czudaj, Thanh Duong, Eric Strobl, Ingmar Schumacher, and the participants at the
2016 Annual International Conference on Macroeconomic Analysis and International Finance, and the 2016 Vietnam
Symposium in Banking and Finance for helpful comments. Gazi Salah Uddin is thankful for the financial support
from Jan Wallanders and the Tom Hedelius Foundation.
*
 Corresponding author: IPAG Business School, 184 Boulevard Saint-Germain, 75006 Paris, France. Phone: +33 01
53 63 36 02; Fax: +33 01 45 44 40 46
Email addresses: S. Bekiros (stelios.bekiros@eui.eu), S. Boubaker (sabri.boubaker@get-mail.fr), D.K. Nguyen
(duc.nguyen@ipag.fr), G.S. Uddin (gazi.salah.uddin@liu.se)

 1
1. INTRODUCTION
Portfolio’s risk diversification is one of the primary concerns for investors and portfolio manag-

ers. The modern portfolio theory suggests that investors can reduce the overall risk of their port-

folios by allocating funds to assets that are negatively correlated or less than perfectly positively

correlated. Putting it differently, the holding of a diversified portfolio of assets allows investors to

improve the portfolio’s risk-adjusted return. The quest for diversification benefits has particularly

been intensified over the last fifteen years due to the advent of multiple “black swan” events such

as the internet bubble burst, the 2007 subprime crisis, the 2008–2009 global financial crisis and

the European public debt crisis since late 2009.1 These severe and unpredictable crises and finan-

cial turbulences have deeply depressed prices and increased instability in global stock markets.

With the increasing trend of financialization of commodity markets since 2004 (Tang and Xiong,

2012; Cheng and Xiong, 2014), investor community has placed greater attention on commodity

futures because they have low correlations with stocks and are driven by risk factors that are dif-

ferent from those that affect stock returns (Gorton and Rouwenhorst, 2006; Dwyer et al., 2011;

Bekiros et al., 2017). For instance, Bekiros et al. (2017) find, from time-varying network topolo-

gies and entropy relationships, that commodity futures markets are heterogeneous, only have

strong intra-category connections, and are still decoupled from equity markets. The weak equity-

commodity link is thus a desirable feature for portfolio diversification, which has been docu-

mented in the past literature on commodity markets’ diversifying potential (Arouri et al., 2011;

Daskalaki and Skiadopoulos, 2011).

 Along with the existing literature on portfolio allocation and diversification, this paper fo-

cuses on the role of a particular commodity, gold, as a hedge, a diversifier, and a safe haven asset

for stocks issued by five leading emerging stock markets of the BRICS countries (Brazil, Russia,

India, China, and South Africa). Our main motivation arises from the fact that, besides its role of

inflation hedging, gold still acts as both a hedge and a safe haven for stocks particularly during

1
 Since Taleb (2010), the black swan theory is commonly used to designate the impossibility of anything like a black
swan. We used this expression as a metaphor to describe crises and financial turbulences that happened as a surprise
and have harmful and large-scale effects.
 2
crises periods, albeit not identically for all international markets (Baur and Lucey, 2010; Baur and

McDermott, 2010; and references therein). In the aftermath of the global financial crisis 2008–

2009, gold has even become more attractive given its low perceived risk in an environment of

high systematic risk, increased financial uncertainty, continued low demand, and deflationary

pressures. The volume of gold traded in 2014 as reported by London Bullion Market Association

amounted approximately to 157,000 tones with a value of $5.9 trillion. Among the BRICS coun-

tries, only China and India already account for around 40% of the total world gold bar and coin

demand (World Gold Council, 2016)2, while South Africa is the first-largest gold exporter in Af-

rica and China, India, and Russia are among the top 10 countries with the largest gold reserves.

At the same time, the role of gold as an investment asset for portfolios of stocks in the BRICS

markets has not been explored, while these markets are commodity-dependent and exposed to

global shocks due to their increasing integration and co-movement with the rest of the world in

the long run (Lehkonen and Heimonen, 2014).3

 The importance of the BRICS economies in the global growth, their heterogeneity in eco-

nomic structures and the recent trends in their development suggest that gold may play a different

role for each market under consideration. According to the IMF estimates (IMF, 2015), the share

of the BRICS countries in global GDP (PPP basis) is expected to be around 33% by 2020 and ex-

ceeds that of the G7 by 2017. Negative shocks affecting the BRICS economic and financial sys-

tems could thus seriously harm the global growth and financial stability. BRICS are anticipated to

exhibit exceptionally high economic growth rates over the next 50 years. Note also that in March

2013, BRICS countries signed an agreement for the creation of New Development Bank (NDB)

based in Shanghai, which came into force in July 2015. The NDB aims to “mobilize resources for

infrastructure and sustainable development projects in BRICS and other emerging market econ-

omies and developing countries to complement the existing efforts of multilateral and regional fi-

2
 http://www.gold.org/download/file/5087/GDT_Q2_2016_Investment.pdf
3
 Lehkonen and Heimonen (2014) further stress that investors can obtain portfolio diversification benefits from in-
vesting in the BRIC markets. However, the BRIC countries cannot be treated as a homogeneous group of emerging
economies in terms of stock market co-movement.
 3
nancial institutions for global growth and development”. For this purpose, it will be endowed

with an enormous currency exchange reserve of US$100 billion backed by gold.

 A number of existing studies have shown evidence of the hedging, diversifying and safe

haven potential for stocks and bonds (e.g., Baur and McDermott, 2010; Baur and Lucey, 2010;

Beckmann et al., 2015; Gürgün and Ünalmış, 2014; Bredin et al., 2015). For instance, Baur and

McDermott (2010) investigate the role of gold in the global financial system with a focus on a

sample of major developed and emerging markets (BRIC) and reported gold’s safe-haven status

with respect to stock market movements over the period 1979–2009, except for Australia, Canada

and Japan. Baur and Lucey (2010) use daily data for the period 1995–2005 to estimate constant

and time-varying relationships between the U.S., U.K. and German stock and bond returns and

gold returns. These authors find that gold is on average a fair hedge against stocks and a safe ha-

ven in extreme stock market conditions. Beckmann et al. (2015) extend further the literature by

using a smooth transition regression (STR) model that allows to test the hedging and safe haven

hypotheses of gold conditionally on the transition between two extreme regimes (normal times

versus crisis times). They reach similar conclusions as in Baur and Lucey (2010) for a larger

sample of 18 individual markets and five regional indices over a longer period from 1970 to

2012. In related studies, Hammoudeh et al. (2011) document the importance of other precious

metals besides gold in risk management, while Conover et al. (2009) suggest that investors could

considerably improve portfolio performance by adding the equities of precious metals firms to

portfolios of the US stocks. Riley (2010) also shows that precious metals have, in general, notable

advantages like high expected returns and negative correlations vis-à-vis other asset classes, and

this is particularly true in the presence of instable macroeconomic conditions and economic poli-

cy uncertainty. On the other hand, some studies show that gold’s hedging and diversification po-

tential can be reduced due to increased co-movement and volatility transmission following finan-

cialization of commodity markets (Gromb and Vayanos, 2010; Silvennoinen and Thorp, 2010;

Daskalaki and Skiadopoulos, 2011; Adams and Glück, 2015).

 4
There is also evidence on the specific characteristics of gold returns as well as on the role of

gold as a hedge and safe haven for other asset classes such as exchange rates and oil price fluc-

tuations (e.g., Joy, 2011; Ciner et al., 2013; Baur, 2013; Reboredo, 2013 a,b). Baur (2013) ana-

lyzes the dynamics of monthly gold returns and finds evidence of seasonality (autumn effect)

since September and November were the only months with positive and statistically significant

gold price changes over the period 1980–2010. Using a model of dynamic conditional correla-

tion, Joy (2011) investigates whether gold could act as a hedge against the US dollar and finds

that it has behaved quite consistently during the past 23 years. Reboredo (2013a) uses a copula

approach to assess the role of gold as a safe haven against the US dollar and shows that the sig-

nificant and positive unconditional dependence between gold and dollar depreciation is consistent

with the view that gold can act as a hedge against the fluctuations of the US dollar value. It is also

demonstrated that there exists a symmetric tail dependence between gold and US dollar exchange

rates, indicating that gold could be considered effective even against extreme upside or down-

ward US dollar movements.

 Overall, our research contributes to the existing literature by investigating the hedging,

diversifying, and safe haven roles of gold for stock portfolios in the BRICS stock markets. Fol-

lowing Baur and Lucey (2010), we define gold as a hedge if it is uncorrelated or negatively corre-

lated with the stock portfolio, as a diversifier if it is positively but not perfectly correlated with

the stock portfolio, and finally as a safe haven if it is a hedge for the stock portfolio in times of

crises/extreme situations. We develop a combined framework of frequency-domain causality,

continuous wavelet transforms and time-varying copulas to achieve our objective. More precise-

ly, this framework allows us to improve the common understanding of causal interactions be-

tween gold and BRICS stock markets as well as the analysis of their “phase-cycle” co-movement

(i.e., in-phase/out-of-phase and lead-lag patterns), at both the aggregate and scale-dependent lev-

els, to the extent that economic agents may have different term objectives. It also enables an en-

hanced investigation of the gold-stock conditional dependence, through copulas, which allows as-

 5
sessing the hedging and diversifying hypotheses of gold in both normal and extreme market con-

ditions.

 Using 3-month gold futures prices that incorporate investors’ expectations regarding gold

investments and MSCI stock market indices, our results mainly show evidence of heterogeneity

of causal interactions between gold and BRICS stock markets with causality from gold to stocks

being more important in short to medium horizons. They also indicate an increase in gold-stock

co-movement in the long run and a leading effect of gold market over the BRICS stock markets

during the recent global financial crisis. Finally, we document a time-varying conditional de-

pendence between gold and stocks, which is larger during bad times than during good times.

 The rest of the paper is organized as follows. Section 2 describes the data and their stochas-

tic properties. Section 3 presents the methodology based on time-frequency causality tests, con-

tinuous wavelet transforms, and copula approach. Section 4 reports and discusses the empirical

results. Section 5 provides concluding remarks and implications of the findings.

2. DATA AND STOCHASTIC PROPERTIES

This paper uses the equity market indices of Morgan Stanley Capital International to represent the

portfolio of stocks in the BRICS emerging market countries and the 3-month futures prices for

gold from New York Mercantile Exchange (NYMEX). Futures prices of gold are employed in-

stead of spot prices because they implicitly incorporate investors’ expectations about the future

dynamics of gold prices which is an important indicator for portfolio design and allocation. It is

worth noting that the continuous gold futures prices in our study are perpetual series of futures

prices derived from individual futures contracts and rolled over on the 1st business day of the

new notional contract month. Daily data are collected for the period from 01 January 2000 to 31

July 2014. To the extent that this study period covers the full episode of the global financial crisis

of 2007–2009 where both stock and gold prices exhibited long swings and unstable fluctuations

particularly due to the credit crunch, the loss of confidence and the high degree of financial and

 6
economic uncertainty, we are able to investigate the role of the gold (and gold futures contracts)

vis-à-vis the BRICS stock markets during both normal and crisis periods.

 Our empirical analysis relies on the logarithmic returns which are computed by taking the

difference in the natural logarithm of two successive daily index prices. Table 1 reports the sum-

mary descriptive statistics of stock and gold market returns. Daily average returns are positive for

all stock markets under consideration, with India exhibiting the highest return (0.030%) and Rus-

sia the lowest return (0.023%). Gold futures provided a higher return (0.039%) than the BRICS

stock market returns. The unconditional volatility, as measured by the standard deviation, ranges

from 0.018 (India and South Africa) to 0.026 (Russia) for emerging stock markets, while it is

0.012 for gold futures. The risk-adjusted return ratio indicates that high risk is not always com-

pensated by high return in emerging stock markets. Given its highest risk-adjusted return ratio of

3.25%, gold futures asset is an interesting investment offering the highest return for the lowest

risk.

 [Insert Table 1 about here]

 Skewness coefficients are negative and kurtosis coefficients are greater than three for all

markets, suggesting that return distributions are asymmetrical and have fatter tails than the corre-

sponding normal distributions. This result is confirmed by the Jarque–Bera test that clearly rejects

the null hypothesis of normality. In addition, the results of the Ljung–Box test applied to both re-

turn series and squared return series with 12 lags indicates that returns and squared returns are se-

rially correlated as the null hypothesis of independence is rejected at the 1% threshold level. The

Engle’s (1982) ARCH test with 12 lags rejects the null hypothesis of homoscedasticity for all re-

turn series, thus suggesting the use of GARCH-type models for capturing empirical stylized facts

of returns such as volatility clustering and time-variations. Moreover, the stationarity and unit

root tests for both price and return series indicate that prices are not stationary but returns are sta-

tionary at conventional significance levels4.

4
 The optimum lag length is selected based on the Schwarz Information Criterion (SIC). For the sake of brevity, we
do not present the results here, but they are available from the authors upon request.
 7
Regarding the correlations between gold futures and stock market returns, they are low and

range from 0.09 (Gold-China) to 0.28 (Gold-South Africa). The highest correlation with gold fu-

tures observed for South Africa seems to be directly linked to this country’s resource-rich econ-

omy. These low correlations typically suggest that investors can obtain diversification benefits

from adding gold futures to their portfolios of stocks in the BRICS countries.

 [Insert Figure 1 and Figure 2 about here]

 To give an idea of how BRICS stock markets and gold futures markets evolve over time,

we depict, in Figures 1 and 2, the dynamics of the log price and log return series. While stock

prices in the BRICS markets experienced two sharp decreases following the burst of the internet

bubbles in 2001 and the Global Financial Crisis in 2008–2009, gold futures prices exhibited a

continual increasing trend since the early 2000s, with a decreasing tendency from the second

quarter 2013. This recent decline in gold prices could potentially be explained by, among others,

the recovery of stock markets around the world, the strengthened US dollar, the expected rise in

the US interest rate, which reduce the demand for gold as a safe haven asset. It is also worth not-

ing that after the Subprime crisis and the Lehman Brothers collapse, China and Russia incorpo-

rated gold as an integral part of their newly designed monetary system in an attempt to counter-

balance the adverse effects of the financial turmoil as well as to compete in terms of capital in-

flows. The potential of hedging and diversification benefits from investing in gold has thus be-

come an issue of utmost importance for investors having exposure to the BRICS stock markets.

3. METHODOLOGY

As stated earlier in the introduction, we use continuous wavelet transforms and copula models to

examine the role of gold as a hedge, a diversifier, and a safe haven for stock portfolios in the

BRICS countries. This framework is advantageous in that it offers a flexible way to precisely

gauge, through wavelets, the potential nonlinear co-movement between gold and stock markets

 8
and its strength over time and different scales (periodicities)5. A high degree of time-scale co-

movement thus implies a reduced diversifying potential of gold, while a negative time-scale co-

movement suggests a hedging potential of gold. On the other hand, copulas allow for capturing

the dependence structure (i.e., symmetric versus asymmetric dependence, and left-tail versus

right-tail dependence) between considered markets. The sign and amplitude of copula’s depend-

ence parameter decide the role that gold plays vis-à-vis the stock portfolios in the BRICS mar-

kets. It is worth noting that a frequency-domain test is also carried out, as a preliminary analysis

before exploring the wavelet-based co-movement and copula dependence, to highlight the possi-

ble causal linkages between gold and BRICS stock markets.

3.1 Frequency-domain causality analysis

The frequency-based connectedness of random variables provides insightful information about

the nature of their directional causality over various time scales (periodicities). To the extent that

the standard causality test is unable to detect the time-scale directional causality (Lemmens et al.,

2008), we use the Breitung and Candelon (2006)’s frequency-domain test, which is fundamental-

ly based on the works of Granger (1969) and Geweke (1982), to study whether time-scale causal

interactions between gold and BRICS stock markets do exist. Accordingly, the link between

stock returns (Et) and gold returns (Gt) under a stationary Vector Autoregressive (VAR) model

can be described as

 " = % "&% + ⋯ + ) "&) + % "&% + ⋯ + ) "&) + "
 (1)
 " = % "&% + ⋯ + . "&. + % "&% + ⋯ + . "&. + "

 The null hypothesis of the frequency domain causality test that gold returns do not cause

stock returns in the frequency interval ϑ ∈ (0, π ) is examined by computing the F-statistics which

is approximately distributed as F (2, T − 2 p) under the null (see, Breitung and Candelon, 2006 for

more technical details). At the empirical level, we are interested in testing the short-, medium-

and long-term directional causality. The presence of causality between stock and gold returns at

5
 Heterogeneous economic agents, black swans, crises, and structural changes in business cycle are among the main
factors that cause inter-variable nonlinear links.
 9
different frequencies implies that the specific frequency components of one variable can be pre-

dicted by those of the other variable.

3.2 Wavelet analysis of time-scale co-movement

While it provides directional causality at some pre-specified frequency ranges, the Breitung and

Candelon (2006) test is unable to reveal possible nonlinear interrelationships between gold and

stock returns, which can be efficiently captured by a multiscale wavelet method (Bekiros and

Marcellino, 2013). Additionally, wavelets are not restricted to a pre-specified frequency range

imposed by the raw data frequency. Earlier applications of wavelets in economics and finance

can be found in, among others, Ramsey et al. (1995) for detecting self-similarity in US stock

prices and Ramsey and Lampart (1998a,b) for investigating the relationship and causality be-

tween money, income and expenditure. Some recent studies have combined wavelets with causal-

ity tests (e.g., Gençay et al., 2002; Bekiros et al., 2016).

 Since our objective is to uncover the underlying stochastic processes that drive the dynam-

ics of gold and stock returns, their changing cyclical behavior, and their time-scale co-movement,

we make use of continuous wavelet transforms (CWT), instead of discrete wavelet transforms

(DWT) which are more suitable for multiscale decomposition of the initial signals (Aguiar-

Conraria and Soares, 2014). More specifically, we rely on continuous wavelet’s power spectrum

(i.e., local variance of a single variable) and cross-wavelet coherence (i.e., the local covariance of

two variables) analysis.

 Let St represent the stock market return and Gt the gold futures returns with wavelet power

spectra, "3 and "5 , respectively. The cross-wavelet power spectrum is defined as

 "35 = "3 ∗ "5 , while their coherence measure which assesses the time-scale co-

movement between gold and stock returns takes the following form (Torrence and Webster,

1999):
 E
 ; ?AB
 @ (
where Q refers to a smoothing operator (Rua and Nunes, 2009). The numerator is the absolute

squared value of the smoothed cross-wavelet spectrum, while the denominator is the product of

the smoothed wavelet power spectra (Torrence and Webster, 1999; Rua and Nunes, 2009). The

wavelet squared coherence "9 is bounded between 0 and unity. Monte Carlo simulation meth-

od is used to generate the accurate statistical significance of the coherence measure (Torrence and

Compo, 1998).

3.3 Copula modeling for conditional dependence structure

Copulas have been widely used to model the dependence structure of financial assets and markets

(e.g., Aloui et al., 2011; Christoffersen et al., 2012). They are particularly found to be flexible and

effective in modeling and characterizing dependence patterns between variables (tail dependence,

symmetric versus asymmetric dependence, and constant versus time-varying dependence). An

important advantage of copulas is that the marginal distribution is modeled separately from the

dependence structure, which makes easier the selection of accurate marginal models and suitable

copula functions.

 Let St and Gt denote stock and gold futures return series with marginal distribution func-

tions, 3 ( ) and 5 ( ), respectively and a joint distribution 35 ( , ). Then, according to the
 9
Sklar’s theorem (Patton, 2006), there exists a copula : 0,1 → 0,1 such that

 35 ( , ) = 3 , 5 ( ) (3)

where ( , ) with = 3 ( ) and = 5 ( ) is a bivariate copula function. The joint density,

 35 , , can then be computed as the product between the copula density, ( , ), and the uni-

variate marginal distributions of the stock and gold futures returns, 3 and 5 ( ).

 35 ( , ) = ( , ) 3 5 ( ) (4)

where , = 9 ( , )/ , representing the dependence structure of data. The represen-

tation in Eq. (4) implies the following decomposition for the log-likelihood function:

 = log ( , ) + log 3 ( ) + log 5 ( ) (5)

 11
A copula model also offers the possibility to assess the lower (upper) tail dependence which

is measured by the probability that two random variables realize extremely small (large) returns

together. The tail dependence coefficients are computed as follows:

 \ = lim ≤ 5&% ( ) ≤ 3&% ( ) (6)
 "→_

 d = lim ≥ 5&% ( ) ≥ 3&% ( ) (7)
 "→%

where \ and d ∈ 0.1 .

 In our empirical setting, we consider various types of symmetric copulas (normal, Student-

t, Plackett, and Frank), asymmetric copulas (Gumbel, Rotated Gumbel, and Symmetrized Joe–

Clayton copula or SJC), and time-varying copulas (normal, Student-t, and SJC) to model the de-

pendence structure between stock and gold returns. Depending on the value and sign of copula’s

dependence parameters, we are able to empirically assess the hedging and diversifying hypothe-

ses of gold in both normal and extreme market conditions where the dependence in the tails hap-

pens. A positive and high value of the copula’s lower tail dependence parameter would imply that

gold does not serve as a safe haven for stocks in the BRICS countries.

 For all , in 0,1 , the bivariate normal and Student-t copulas are defined by

 jklmno , ; = Φ(Φ&% , Φ&% ) (8)

 3"stuv"&" , ; , = y ( y&% , y&% ) (9)

where Φ and z represents the bivariate standard normal distribution and the bivariate Student-t

distribution with degree of freedom , while Φ&% and y&% are the inverse of the standard normal

and Student-t distributions. ∈ −1,1 is the linear correlation coefficient. While both the normal

and Student-t copulas capture the symmetric dependence structure, there is no tail dependence for

the normal copula.

 The Plackett copula (Plackett, 1965) and the Frank copula (Frank, 1979) are also symmetric

and able to capture the full range of dependence for marginal with exposure to tail dependence.

They are given in equations (10) and (11).

 12
(%• ‚&% ƒ•z & %• ‚&% (s•z) E &„ƒ ƒ&% sz
 |on}~u"" u, ; = , ∈ 0, ∞ − 1
 9 ƒ&%

(10)

 &% %&u =ˆ & %&u =ˆ‰ %&u =ˆŠ
 †lnv~ u, ; = log , ∈ −∞, ∞ (11)
 ‡ %&u =ˆ

 Regarding the asymmetric copulas, the Gumbel copula (Gumbel, 1960) and its rotated ver-

sion are given by

 ’ %/’
 5sm‹uo u, ; = − − ’
 + − (12)

 “k"n"ut_5sm‹uo , ; = + − 1 + 5sm‹uo (1 − , 1 − ; ) (13)

where the dependence parameter ∈ (1, ∞). The Gumbel copula has greater dependence in the
 >
upper tails ( d = 2 − 2– and \ = 0), while the rotated Gumbel copula has the inverse depend-
 >
ence structure of the Gumbel copula ( d = 0 and \ = 2 − 2– ).

 The Symmetrized Joe–Clayton copula SJC (Patton, 2006) allows for capturing asymmetric

tail dependence and is specified as

 3—˜ , ; d3—˜ , \3—˜ = 0.5 —˜ , ; d—˜ , \—˜ + —˜ 1 − , 1 − ; d—˜ , \—˜ + + − 1 (14)

 š &%/› %/š
where —˜ , ; d—˜ , \—˜ = 1 − 1 − 1 − 1 − š &›
 + 1− is the Joe-Clayton

copula, = 1/ 9 (2 − d—˜ ), = −1/ 9 ( \—˜ ), d—˜ ∈ 0,1 , and \—˜ ∈ 0,1 . The SJC de-

pendence structure is symmetric if d—˜ = \—˜ , otherwise it is asymmetric.

 To account for the potential of time-varying dependence between gold and stock returns,

we consider several time-varying copulas with both symmetric and asymmetric dependence pat-

terns. Similar to Patton (2006), we let the dependence parameter of the Gaussian and Student-t

copulas follow an ARMA(1,p) process as in equation (15) where = (1 − &Ÿ )(1 −

 &Ÿ )&% (x) is a logistic transformation to keep " within −1,1 . It is worth noting that for the Stu-

dent-t copula, Φ&% is substituted by z&% ( ). Similarly, the dependence parameter of the rotat-

ed Gumbel copula, and the extreme dependence parameters of the SJC copula are modeled as in

equations (16)–(18).

 13
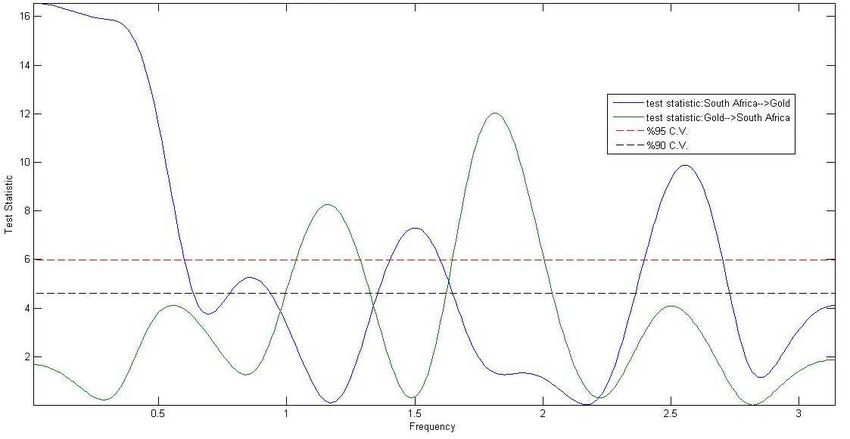
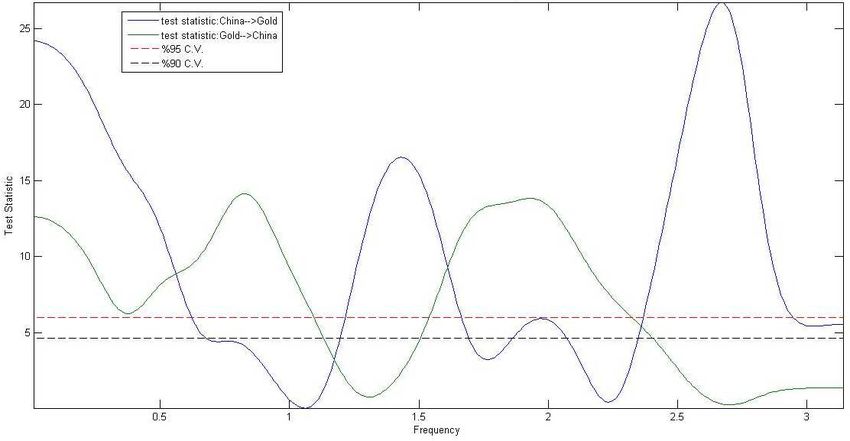
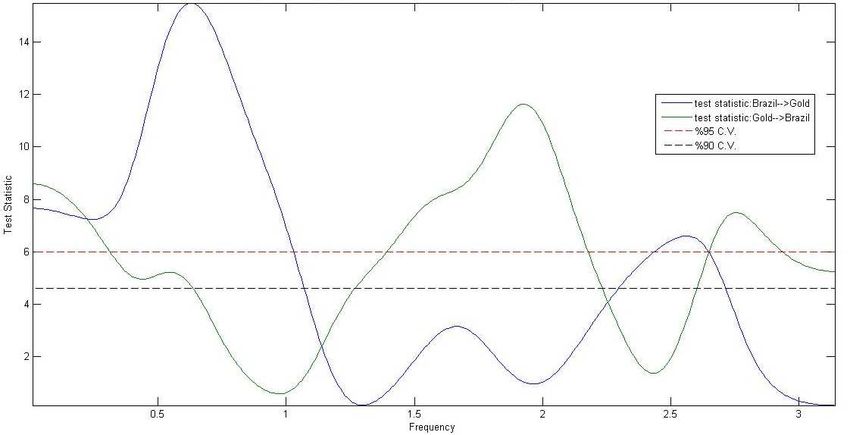
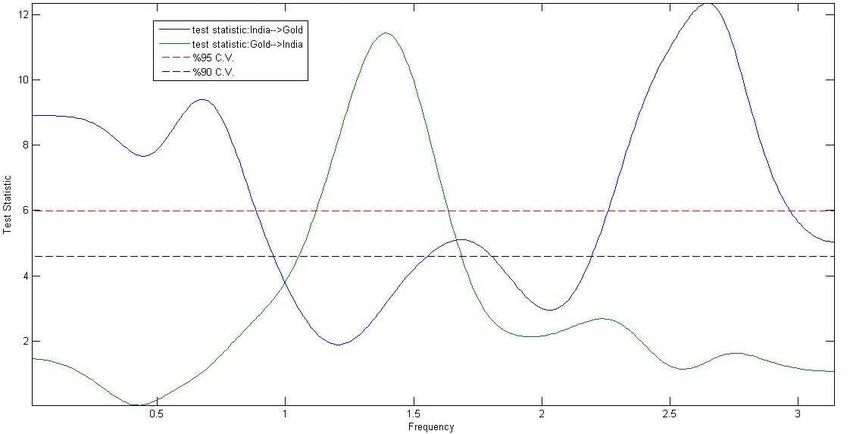
% . &%
 " = Ψ¡ + Ψ¡ "&% + Ψ9 ¢£% Φ "&¢ . Φ&% ( "&¢ ) (15)
 .

 % .
 " = Ψ¡ + Ψ¡ "&% + Ψ9 ¢£% "&¢ − "&¢ (16)
 .

 3—˜ 3—˜ % %¡
 d," = Ψ¡d + Ψ%d d,"&% + Ψ9d ¢£% "&¢ − "&¢ (17)
 %¡

 3—˜ 3—˜ % %¡
 \," = Ψ¡\ + Ψ%\ d,"&% + Ψ9\ ¢£% "&¢ − "&¢ (18)
 %¡

 We apply the two-step approach proposed by Joe (1997) to compute the inferences of the

copula density and marginal models. In the first step, we choose the best-suited marginal models

among the various competing GARCH-type specifications (GARCH, EGARCH, GJR-GARCH

and FIGARCH) for modeling gold and BRICS stock market returns. Our results based on Log-

likelihood ratio and SIC criterion select the GJR-GARCH(1,1) specification as the most suitable

marginal model for all return series. This model, as described in Eq. (19), particularly allows for

capturing heavy tails and asymmetric volatility. The maximum likelihood method is used to esti-

mate its parameters.
 9 9 9
 "9 = + α "&% + "&% + γ "&% "&% (19)

 where " follows a skewed Student-t distribution. "&% = 1 if " < 0 and otherwise "&% =

0. Glosten et al. (1993) show that the positivity and stationarity of the volatility process are guar-
 ›
anteed whenever the parameters satisfy the constraints , , , > 0, and + + < 1.
 9

 In the second step, each marginal estimated from the GJR-GARCH model is plugged into

the copula likelihood function as defined in Eq. (5) and the latter is maximized with respect to the

unknown vector of copula parameters.

4. EMPIRICAL RESULTS

4.1 Causal interactions and time-frequency co-movement

We carry out the Breitung and Candelon (2006) spectral-domain test to uncover both the short-

and long-run causality within a wide range of frequencies in the interval 0, . Figure 3 illus-

trates the bivariate relationships amongst all investigated gold-stock pairs. The frequency on the

 14
horizontal axis ϑ can be interpreted as a cycle or periodicity of T days where T = 2π / ϑ . We

consider four spectral bands for the causality from gold return to stock return and the other way

around: i) very short-run horizons corresponding to ∈ 0,0.5 , ii) short-run horizons with ∈

0.5,1.5 , iii) medium-run horizon with ∈ 1.5,2.5 , and iv) the longest time periods laying in

the interval 2.5, . Specifically, short-run and long-run causal interactions between gold and

stock returns together with the critical value of the statistical test at the 5% and 10% levels are

displayed towards the left and the right of the graph, respectively.

 [Insert Figure 3 about here]

 The results from the spectral-domain test (Figure 3) reveal the existence of bidirectional

causality at different frequency bands for all stock-gold pairs. More precisely, there is evidence of

significant causality from the Brazilian stock market to gold over both the short-run and long-run

horizons, i.e., (0.00, 1.05) and (2.40, 2.70) frequency bands, as the test statistics largely exceeds

the critical values at the 5% and 10% levels. The reverse causality from gold to stock market in

Brazil is observed at very short-run (0.00, 0.30), medium-run (1.35, 2.30) and long-run (2.50,

2.95) periodicities. For the Russia-gold pair, the causality runs from stock markets to gold for

(0.00, 0.50), (0.60, 1.10), (1.35, 1.52) and (2.25, 2.70) frequency bands, while the reverse causal

effect is found for the short- and long-run horizons. For India and China, the causality from stock

markets to gold occurs within (0.00, 0.90) and (2.25, 2.96) frequency bands for India, and (0.00,

1.10) and (1.55, 2.40) frequency bands for China. Gold only causes changes in the Indian stock

market at the medium-term (1.15, 1.60), but has significant effects on stock market of China at all

frequency bands, including the following day intervals (0.00, 0.60), (1.15, 1.75) and (2.40, 2.90).

For South Africa, gold is caused by the stock market returns at almost all frequency bands such as

(0.00, 0.60), (1.40, 1.60) and (2.35, 2.70), whereas it only has causal effects on stock market re-

turns at the short-run and medium-run horizons.

 Taken together, the frequency-based causality test indicates that the causality from BRICS

stock markets to the gold market is more pronounced than the other way around, particularly at

 15
the short-run and long-run horizons. This finding may imply that short-term shocks in stock mar-

kets can be quickly transmitted to the gold market. For example, a stock market crash or down-

turn could lead to a rise in gold prices to the extent that stock investors allocate more funds to

gold to diversify away the stock risk. On the contrary, the causality from gold to equity markets

happens more at the short-run and medium-run horizons, which suggests that investment strate-

gies in stock markets can be designed independently from the gold market fluctuations if stock

investors pursue a long-run objective. Besides the frequency-dependent effects, the evidence of

causal interactions is consistent with the existence of time-varying volatility transmission and dy-

namic co-movement between gold and stock markets (Arouri et al., 2015 and references therein),

which may reduce the ability of gold as a safe haven for stocks during crisis periods.

 We now turn to the multiscale wavelet analysis of co-movement, which allows for captur-

ing potential of nonlinear linkages between gold and stock returns while avoiding the shortcom-

ings of Breitung and Candelon test (i.e., linearity of the model parameters, threshold constraint

depending on input data frequency, and short length of frequency bands). The use of the continu-

ous wavelet transform (CWT) approach is particularly important in that it enables the possibility

to allows us to investigate the scale-dependent and nonlinear (a)synchronization between gold

and BRICS stock markets both over time and across frequencies. Indeed, the time-varying linear

and nonlinear phase-dependent linkages including the second or higher order effects (which is not

possible with the linear correlation coefficient) can be fully captured by the wavelet coherence

measure described in Section 3. The changes in the wavelet coherence measure typically reflect

the heterogeneity of market participants and their investment horizons in both gold and stock

markets. From a practical point of view, short-term investors are interested in interim price fluc-

tuations, while long-term agents tend to adjust their investment decisions based on the long-run

price movements.

 [Insert Figure 4 about here]

 16
Figure 4 presents the contour graphs of the estimated wavelet coherence for gold returns

and each of the BRICS market returns. The thick black contour lines display the 95% confidence

intervals estimated from Monte Carlo simulations using phase-randomized surrogate series. The

vertical and horizontal axes show the frequency and the study period in days, respectively. The

color presentation ranges from blue to red where the blue color indicates a low level of coherence

(low co-movement between variables under consideration) and the red color indicates a high lev-

el of coherence. In particular, the horizontal axis divides the time period into seven thresholds,

i.e., 500, 1000, 1500, 2000, 2500, 3000 to 3500 days, which corresponds to the following dates: 3

December 2001, 3 November 2003, 3 October 2005, 3 September 2007, 3 August 2009, 4 July

2011, and 3 June 2013, respectively. The starting and ending dates are 4 January 2000 and 31 July

2014. The lighter black line delimits the region with high power and the “cone of influence”

where edge effects become important (Torrence and Compo, 1998). The direction of the arrows

provides the information about the phase lead-lag relationships between gold and stock markets.

Arrows pointing to the right signify phase-synchronized series, while those pointing to the left

indicate out-of-phase variables. Moreover, arrows pointing to the right-down or left-up indicate

that gold leads the BRICS stock markets, whereas the right-up or left-down arrows show evi-

dence that gold is lagged behind stock market movements. The in-phase regions are indicative of

a cyclical interaction between markets, while the out-of-phase (or anti-phase) behavior demon-

strates an anti-cyclical effect. Note that the contour plots derived by a three-dimensional analysis

enable to detect areas of varying co-movement for a pair of return series over time and across

frequencies. The areas of stronger interdependence in the time-frequency domain thus imply low-

er potential of gold as a hedge and a safe haven for stocks, and thus lower benefits from including

gold into stock portfolios.

 A close look at the coherence measure graphs (Figure 4) shows that Russia-gold, South Af-

rica-gold, and to a lesser extent Brazil-gold market pairs exhibit a very high degree of in-phase

co-movement at the long-term frequency band (more or less than 512 days) over the time period

 17
from 2003M11 to 2011M07 given the concentration of the red regions (orange region at the be-

ginning for Brazil) and the right-direction arrows. A particularity is observed for the South Afri-

ca-gold pair as it highly co-moves and synchronizes together from 2002 to 2005 within a higher

frequency (between 128 and 450 days). The high degree of long-term co-movement between gold

and stock markets in Russia and South African can be explained by the high dependence of these

economies on natural resources including gold, particularly in the case of South Africa. It seems

also to coincide with the rising tendency of gold prices since 2002 and the increased interest of

investors for gold as a diversifying asset in the aftermath of successive crises and financial turbu-

lences (e.g., the Russian economic crisis in 2000–2001, the internet bubble burst in 2001, the

global financial crisis 2008–2009). At the higher frequencies or shorter periodicities from 0 to 32

days, the co-movement between gold and stock market returns is generally low since the cross-

wavelet power spectra has values below 0.5. At medium-run horizons from 32 to 128 days, the

contour plots show some evidence of high co-movement located around the subprime crisis in

2007 and the global financial crisis of 2008–2009, and the cross-market linkage is greater for the

subprime crisis.

 The direction of arrows in the regions of high co-movement indicates that stock markets in

India and Brazil display a time-varying lag-lead relationships vis-à-vis gold in the time-frequency

space. Over the higher frequencies up to 128 days (short- and medium-run horizons), we indeed

find alternative periods of right-down arrows (i.e., gold market leads the stock market) and then

of right-up arrows (i.e., the gold market lags behind the movements in the stock market). Howev-

er, the leading gold market situation is more frequent than the lagging gold market situation. For

the low frequencies (or longer periodicities) from 505 to 610 days, the gold leads the changes in

the stock markets of the BRICS countries during the period from 2003M11 to 2011M07 for Bra-

zil and Russia, from 2007M09 to 2012M04 for India, from 2005M10 to 2011M07 for China, and

from 2002M11 to 2011M11 for South Africa. It is clear that the gold market significantly leads

the stock markets throughout the recent global financial crisis (2008–2009).

 18
In summary, the above analysis points out a reduction of the hedging/diversifying potential

of gold for portfolios of stocks in the BRICS countries over the long run (and thus the reduction

of diversification benefits) to the extent than the gold-stock market co-movement increases from

the high to the low frequencies. Gold’s ability as a safe haven is also not observed given the high

degree of its synchronization with stock markets during the global financial crisis. The time-

varying co-movement across frequencies suggests that stable (static) hedging coefficient and as-

set allocation between gold and stocks are not appropriate for portfolio designs. It is important to

note that the wavelet analysis confirms the results of frequency-domain test in terms of timescale

interactions, but it provides more relevant and meaningful information about the gold-stock rela-

tionships.

4.2 Analysis of conditional dependence

As stated earlier, we estimate the copula dependence parameters according to a two-step proce-

dure, where the first step consists of estimating the parameters of the univariate marginal models.

Table 2 reports the estimation results of the best-suited marginal model, GJR-GARCH(1,1), for

gold and each of the BRICS stock markets. The AR(1) parameter of the mean equations is signif-

icant in all cases except for China, suggesting the lack of one-step ahead predictability of stock

returns in China. The estimated parameters of the GJR-GARCH(1,1) process are also highly sig-

nificant. In particular, the conditional volatility is quite persistent since all parameters associated

with the lagged conditional variance values of the BRICS and gold market returns (β), ranging

from 0.852 (India) to 0.924 (China), are significant at the 1% threshold level. The impact of un-

expected shocks (α) is also significant for all markets, except for Brazil.

 As to the asymmetry parameters (γ), they are positive and highly significant at the 1%

threshold level in all cases, which suggests that the conditional volatility reacts more strongly to

bad news than to good news. In addition, the estimated tail parameters (Student-df) are strongly

significant with values exceeding two. This finding confirms the relevance and usefulness of the

Student-t distribution for fitting both gold and stock returns. Even though the departure from

 19
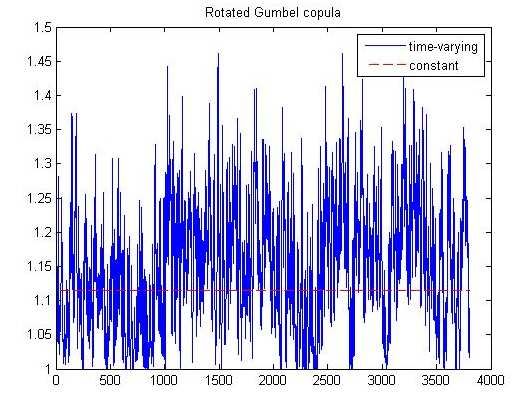
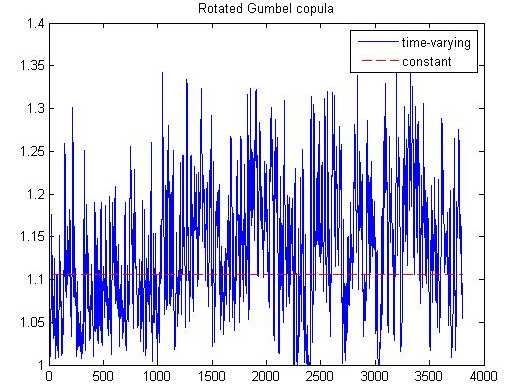
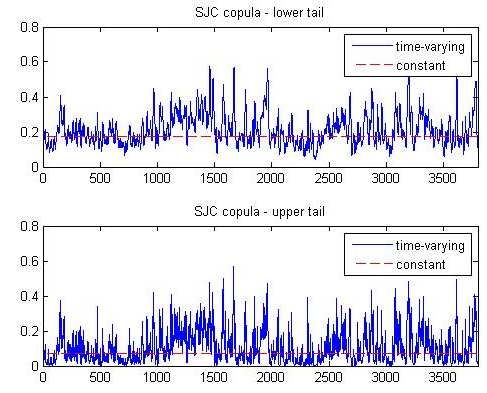
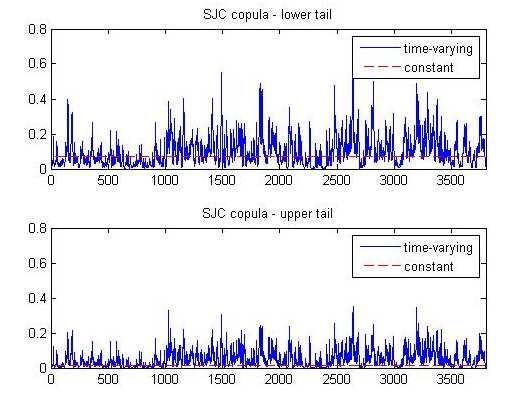
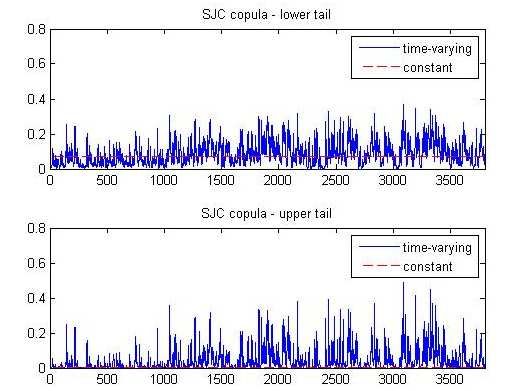
normality still exists, the results of the diagnostic tests show that the GJR-GARCH model with

Student-t errors is appropriate for modeling the dynamics of stock and gold returns. For this pur-

pose, it is important to note that the ARCH effects completely disappear in residual series and the

stability condition for volatility model parameters is satisfied.

 [Insert Table 2 about here]

 Table 3 presents the results of the conditional dependence structure for pairs of gold and

stock markets. Panel A shows the estimates of the dependence parameters for the static copula

models together with the log-likelihood (log-lik) and AIC values. Out of four symmetric copulas

(Normal, Student-t, Frank and Plackett) and five asymmetric copulas (Clayton, Rotated Clayton,

Gumbel, Rotated Gumbel, and SJC), both criteria select the Student-t copula as the best-suited

copula for modeling the dependence patterns between gold and BRICS stock markets. Indeed, the

Student-t copula has the highest log-lik and lowest AIC values.

 The dependence parameter of the Student-t copula is significant at the 1% threshold level

and ranges from 0.100 (China-gold) to 0.266 (South Africa-gold). The low magnitude and posi-

tivity of the dependence parameter supports the hypothesis of gold as a diversifier for portfolios

of stocks in the BRICS countries. As expected, the diversifying potential of gold is the lowest in

South Africa given its dependence on mining sector, where gold exports and industry play an im-

portant role. In fact, this country is the first-largest gold producer in Africa and gold is its main

export product with a share of 11.2% of total exports in 2014.6 South Africa also holds about

50% of the world’s gold resources according to the US Geological Survey estimates in 2002. We

also find some evidence of asymmetric dependence with the SJC copula as the lower tail depend-

ence parameter is greater than the upper tail dependence.

 [Insert Table 3 about here]

 [Insert Figures 5–6–7 about here]

6
 http://atlas.media.mit.edu/en/profile/country/zaf/
 20
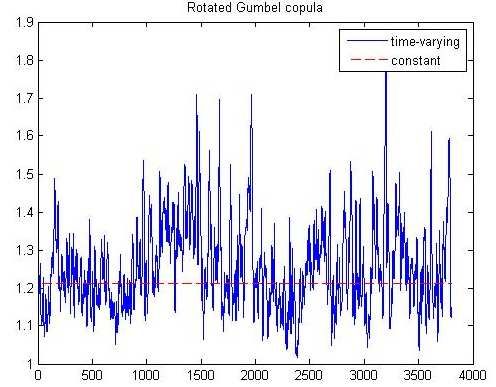
Panel B of Table 3 presents the estimation results for the time-varying copulas which allow

the dependence parameter to change through time with respect to market conditions (normal

times versus crisis times). Figures 5–7 illustrate that copula parameters change over time. For ex-

ample, the dependence parameter of the rotated Gumbel copula fluctuates within the interval

(0.00–1.46) for Brazil-gold, (0.02–1.38) for Russia-gold, (1.02–1.28) for India-gold, and (1.08–

1.82) for South Africa-gold. Notably, the rotated Gumbel is found, based on the AIC and maxi-

mum log-likelihood scores, as the best-suited time-varying copula model for capturing the dy-

namic changes in the conditional dependence structure between gold and stock markets. The rel-

evance of the time-varying rotated Gumbel copula indicates that gold-stock dependence is higher

during bearish periods than during bullish periods. This evidence thus does not support the safe

haven role of gold which has been found by earlier studies for developed and emerging markets

(e.g., Baur and Lucey, 2010; Beckmann et al., 2015), while it is still possible to obtain diversifi-

cation benefits through including gold into stock portfolios given the low degree of dependence

over time.

 Finally, the results in Table 3 reveal that time-varying copulas do not always provide better

fits to data than static copulas, based on the log-lik and AIC criteria. The best-fitted static copula,

the Student-t, effectively outperforms all the time-varying copula models, except for the South

Africa-gold pair when the rotated Gumbel copula is used.

5. CONCLUSION
In this paper, we extend the recent literature focusing on the role of gold for portfolio hedging

and diversification, while shifting attention to the heterogeneous BRICS stock markets. While

these markets have low correlations with developed markets and provide global investors with

high returns spurred by high economic growth rates, they are becoming more sensitive and vul-

nerable to external shocks given their increasing integration with the rest of the world through

both financial and trade links. The contagious effects of the US subprime crisis and the global fi-

nancial crisis have prompted global investors to seek diversification, hedging, and safe haven op-
 21
portunities in alternative asset classes including particularly gold. Our work addresses the hy-

potheses of gold as a hedge, a diversifier and a safe haven by making use of the continuous wave-

let transform and the copula functions. This methodological framework allows us to measure not

only the time-varying co-movement between gold and BRICS stock markets across frequencies

(i.e., investigation of hedging versus diversifier potential), but also their conditional dependence

structure in various market conditions such as normal and crisis times (i.e., investigation of hedg-

ing and diversifier versus safe haven properties). A frequency-domain test was also used as a pre-

liminary analysis to show evidence of timescale causal interactions.

 In addition to the existence of the two-way causality linkages across frequencies, our results

document timescale and time-varying co-evolvement patterns between the two markets, with sev-

eral periods of concentrated extreme variations. The degree of gold-stock market synchronization

is however low in short and medium horizons, and but experiences sharp increase over the long

run. The leading effect of gold market over the stock markets was also found during the recent

global financial crisis. We also find evidence of time-varying, positive and asymmetric depend-

ence between gold and stock markets, with the dependence level being higher during bad times

than during good times.

 Overall, our findings from a nonlinear wavelet-copula framework imply that the diversify-

ing potential of gold tends to reduce in the long run, which seems to be consistent with the view

that gold is becoming an integrated part of asset portfolios and that global investors adjust their

portfolios with a close look at gold market fluctuations. Also, they clearly support the hypothesis

of gold as a diversifier in both normal and bear markets for stocks in the BRICS countries, but

not a hedge and a safe haven. This result is not surprising because the accelerated financialization

of commodity markets, including the gold market, has significantly eased the investments in gold,

making the gold asset behave more and more like stocks.

 22
REFERENCES
Adams, Z., Glück, T., 2015. Financialization in commodity markets: A passing trend or the new normal? Journal of
Banking & Finance 60, 93–111.
Aguiar-Conraria, L., Azevedo, N., Soares, M.J., 2008. Using wavelets to decompose the time–frequency effects of
monetary policy. Physica A: Statistical mechanics and its Applications 387(12), 2863–2878.
Aguiar-Conraria, L., Soares, M.J., 2014. The continuous wavelet transform: moving beyond uni- and bivariate analy-
sis. Journal of Economic Surveys 28(2), 344–375.
Arouri, M., Jouini, J., Nguyen, D.K., 2011. Volatility spillovers between oil prices and stock sector re-turns: Implica-
tions for portfolio management. Journal of International Money and Finance 30, 1387–1405.
Arouri, M.E.H., Lahiani, A., Nguyen, D.K., 2015. World gold prices and stock returns in China: Insights for hedging
and diversification strategies. Economic Modelling 44, 273–282.
Baur, D.G., 2013. The autumn effect of gold. Research in International Business and Finance 27(1), 1–11.
Baur, D.G., Lucey, B.M., 2010. Is gold a hedge or a safe haven? An analysis of stocks, bonds and gold. Financial
Review 45, 217–229.
Baur, D.G., McDermott, T.K., 2010. Is gold a safe haven? International evidence. Journal of Banking and Finance
34, 1886–1898.
Beckmann, J., Berger, R., Czudaj, R., 2015. Does gold act as a hedge or a safe haven for stocks? A smooth transition
approach. Economic Modelling 48, 16–24.
Bekiros, S., Marcellino, M., 2013. The multiscale causal dynamics of foreign exchange markets. Journal of Interna-
tional Money and Finance 33, 282–305.
Bekiros, S., Nguyen, D. K., Uddin, G. S., Sjö, B., 2016. On the time scale behavior of equity-commodity links: Im-
plications for portfolio management. Journal of International Financial Markets, Institutions and Money 41, 30–46.
Bredin, D., Conlon, T., Potì, V., 2015. Does gold glitter in the long-run? Gold as a hedge and safe haven across time
and investment horizon. International Review of Financial Analysis 41, 320–328.
Breitung, J., Candelon, B., 2006. Testing for short and long-run causality: a frequency domain approach. Journal of
Econometrics 132, 363–378.
Cheng, I. H., Xiong, W., 2014. Financialization of commodity markets. Annual Review of Financial Economics 6,
419–441.
Christoffersen, P., Errunza, V., Jacobs, K., Langlois, H., 2012. Is the potential for international diversification disap-
pearing? A dynamic copula approach. Review of Financial Studies 25, 3711–3751.
Ciner, C., Gurdgiev, C., Lucey, B.M., 2013. Hedges and safe havens: An examination of stocks, bonds, gold, oil and
exchange rates. International Review of Financial Analysis 29, 202–211.
Conover, C.M., Jensen, G.R., Johnson, R.R., Mercer, J.M., 2009. Can precious metals make your portfolio shine?
Journal of Investing 18, 75–86.
Daskalaki, C., Skiadopoulos, G., 2011. Should investors include commodities in their portfolio after all? New evi-
dence. Journal of Banking and Finance 35, 2606–2626.
Dickey, D.A., Fuller, W.A., 1981. Likelihood ratio statistics for autoregressive time series with a unit
root. Econometrica 49, 1057–1072.
Dwyer, A., Gardner, G., Williams, T., 2011. Global commodity markets—price volatility and financialisation. Re-
serve Bank of Australia Bulletin, (June), 49–57.
Engle, R.F., 1982. Autoregressive conditional heteroscedasticity with estimates of the variance of United Kingdom
inflation. Econometrica 50, 987–1008.
Fan, Y., Gençay, R., 2010. Unit root tests with wavelets. Econometric Theory 26(5), 1305–1331
Gençay, R., Signori, D., 2015. Multi-scale tests of serial correlation. Journal of Econometrics 184, 62–80.
Gençay, R., Whitcher, B., Selçuk, F., 2001. Differentiating intraday seasonalities through wavelet multi-scaling.
Physica A 289(3–4), 543–556.
Gençay, R., Whitcher, B., Selçuk, F., 2002. An introduction to wavelets and other filtering methods in finance and
economics. Academic Press, San Diego.

 23
Geweke, J., 1982. Measurement of linear dependence and feedback between multiple time series. Journal of Ameri-
can Statistical Association 77, 304–324.
Glosten, L.R., Jagannathan, R., Runkle, D.E., 1993. On the relation between the expected value and the volatility of
the nominal excess return on stocks. The Journal of Finance 48(5), 1779–1801.
Gorton, G., Rouwenhorst, K.G., 2006. Facts and fantasies about commodity futures. Financial Analysts Journal 62,
47–68.
Granger, C.W.J., 1969. Investigation causal relations by econometric models and cross-spectral methods. Economet-
rica 37, 424–38.
Gromb, D., Vayanos, D., 2010. Limits of arbitrage: The state of the theory. National Bureau of Economic Research
Working paper series no. 15821.
Gürgün, G., Ünalmış, I., 2014. Is gold a safe haven against equity market investment in emerging and developing
countries? Finance Research Letters 11: 341–348.
Hammoudeh, S., Malik, F., McAleer, M., 2011. Risk management of precious metals. Quarterly Review of Econom-
ics and Finance 51, 435–441.
IMF, 2015. World Economic Outlook Database. April 2015.
Joe, H., 1997. Multivariate models and dependence concepts. Monographs in Statistics and Probability 73. Chapman
and Hall, London
Joy, M., 2011. Gold and the US dollar: Hedge or haven? Finance Research Letters 8(3), 20–131.
Lehkonen, H., Heimonen, K., 2014. Timescale-dependent stock market comovement: BRICs vs. developed markets.
Journal of Empirical Finance, 28, 90–103.
Lemmens, A., Croux, C., Dekimpe, M.G., 2008. Measuring and testing Granger-causality over the spectrum: an ap-
plication to European production expectation surveys. International Journal of Forecasting 24, 414–431.
Patton, A.J., 2006. Modelling asymmetric exchange rate dependence. International Economic Review 47(2), 527–
556.
Ramsey, J.B., Lampart, C., 1998a. The decomposition of economic relationships by time scale using wavelets: Mon-
ey and income. Macroeconomic Dynamics 2, 49–71.
Ramsey, J.B., Lampart, C., 1998b. The decomposition of economic relationships by time scale using wavelets: Ex-
penditure and income. Studies in Nonlinear Dynamics & Econometrics 3(1), 23–42.
Ramsey, J.B., Usikov, D., Zaslavsky, G.M., 1995. An analysis of U.S. stock price behavior using wavelets. Fractals
3(2), 377–389.
Reboredo, J.C., 2013a. Is gold a safe haven or a hedge for the US dollar? Implications for risk management. Journal
of Banking and Finance 37(8), 2665–2676.
Reboredo, J.C., 2013b. Is gold a hedge or safe haven against oil price movements? Resources Policy 38(2), 130–137.
Riley, C., 2010. A new gold rush: Investing in precious metals. Journal of Investing 19, 95–100
Rua, A., Nunes, L.C., 2009. International comovement of stock market returns: A wavelet analysis. Journal of Em-
pirical Finance 16(4), 632–639.
Silvennoinen, A., Thorp, S., 2013. Financialization, crisis and commodity correlation dynamics. Journal of Interna-
tional Financial Markets, Institutions and Money 24, 42–65.
Taleb, N., 2010. The black swan: The impact of the highly improbable. Random House Inc.
Tang, K., Xiong, W., 2012. Index investment and the financialization of commodities. Financial Analysts Journal
68(6), 54–74.
Torrence, C., Compo, G.P., 1998. A practical guide to wavelet analysis. Bulletin of the American Meteorological
Society 79, 605–618.
Torrence, C., Webster, P., 1999. Interdecadal changes in the ESNOM on soon system. Journal of Climate 12, 2679–
2690.

 24
You can also read