Blindsided:
The game-changers we
might not see coming
←
→
Page content transcription
If your browser does not render page correctly, please read the page content below
Blindsided: The game-changers we might not see coming
The Consumer and Professional Technology Trend Landscape 2010-2019
CES HEADLINE NAB HEADLINE INDUSTRY BUZZ CONSUMER TREND
2010 3D 3D Interactive TV Social Media
2011 Second Screen TV Everywhere 3D Mobile Video
2012 Second Screen 4K/UHD Second Screen Social Video
2013 Android TV Second Screen Social Media Binge Viewing
2014 Internet of Things 4K/UHD Cameras Google Glass Streaming Video
2015 UHD IP Broadcast Drones Vertical Video
2016 Internet of Things Cloud VR Non-broadcast Video
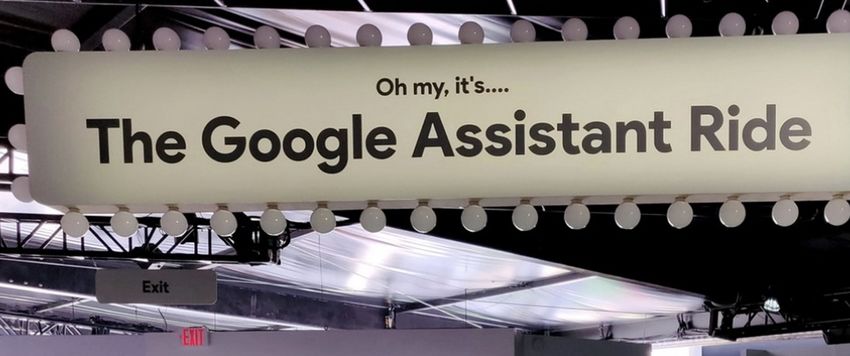
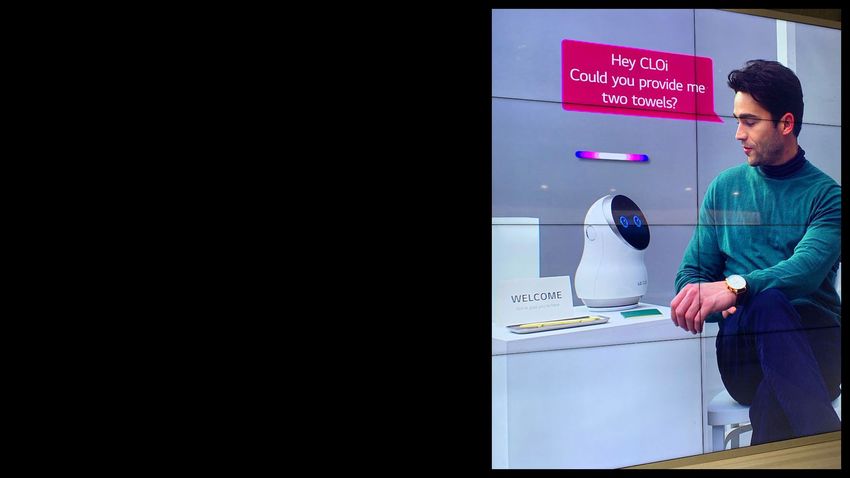
2017 Voice Interface Cloud VR Live Streaming
2018 Voice Interface AI Voice Interface Social Video Stories
2019 8K ? AI ?
m

Estimates on                       December 2017           December 2018

smart speaker
ownership in
the United
States                                               119m              52% of smart
                                                                      speaker owners
                                                                      have more than
                                                                     one smart speaker
                                                                       in their home
                                            67m
                             53m
                  39m

                Number of people (18+)   Number of smart speakers
                owning a smart speaker      in US households
US digital                 Video on Demand          Digital Music          Video Games          ePublishing

media revenue
by segment
2017-2023            50,000
(in billions $USD)
                                                                               9.5       9.8         10.0
                                                                    9.1
                                                        8.7
                     40,000                  8.3
                                 7.9

                     30,000                                                    18.0      18.2        18.5
                                                        17.4        17.7
                                             17.1
                                 16.5

                     20,000
                                                                    5.2        5.2       5.3         5.4
                                             5.2        5.2
                                 5.2

                     10,000
                                                        14.8        15.8       16.3      16.4        16.4
                                 12.0        13.8

                       0
                                2017         2018      2019         2020      2021       2022       2023
Global launch Worldwide retail sales during the first three days after launch
sales of selected
video games Grand Theft Auto V 2013 $1,000m
compared to the Red Dead Redemption 2 2018 $725m
largest movie Call of Duty: Black Ops 4 2018 $500m
openings
Worldwide box office revenue through the first Sunday after launch
Avengers: Infinity War 2018 $641m
The Fate of the Furious 2017 $542m
Star Wars: The Force Awakens 2015 $529mTime spent
on Fortnite
32.5%
29.4%
17.3%
13.1%
7.7%
0-5 6-10 11-15 16-20 21+
hours hours hours hours hours
Self-reported weekly time Fortnite players
in the US spend playing the game% of US smart First adopters (owned one year or more) Early mainstream (owned less than one year)
speaker owners
who replaced Traditional AM/FM radio
40%
45%
time they used
to spend with: Smartphone
26%
38%
24%
Computer
36%
22%
Printed publications
32%
24%
Tablet
30%
18%
Television
29%
20%
Other multiroom audio systems
15%% of Americans Snapchat Instagram Facebook
aged 16-34 who
create/consume
stories on Gen Z Millennials
social media (16 to 24-year-olds) (25 to 34-year-olds)
platforms
73%
70%
58% 58%
53%
48%
39%
34% 34%
31%
20%
13%
Consume Create Consume CreateAverage age of marriage in US Average age of becoming a parent in US Average age of first time managers in US
TV consumption

                 65+              50-64           35-49            18-34

                       Average daily TV consumption (live + time-shifted)
                         of American adults, by age group (in hh:mm)
Estimated 1,069m
number of
5G mobile
connections
571m
2m North America
189m
2m Asia & Oceania
55m
2019 2020 2021 2022 2023
Asia & Oceania North America Western Europe
Central & Eastern Europe Latin America Middle East & AfricaDIGITAL MEDIA US digital media market 2019 China digital media market 2019 US VoD ARPU 2019 China VoD ARPU 2019
VIDEO GAMES

  US video game market 2019

  China video game market 2019
MOBILE SUBSCRIBERS

  USA                     Smartphone penetration

  China                   Smartphone penetration

  China will be world’s largest 5G market
          connections by 2025
E-PAYMENTS Alibaba’s Alipay & Tencent’s WeChat Pay each handle more payments in a single month than PayPal’s a year
Blindsided:
The game-changers we
might not see coming
You can also read