BMO Capital Markets 29th Global Metals & Mining Conference - February 23rd - 26th, 2020
←
→
Page content transcription
If your browser does not render page correctly, please read the page content below
BMO Capital Markets 29 th Global Metals & Mining Conference
                                        February 23 rd – 26 th , 2020

TSX: LUN Nasdaq Stockholm: LUMI                                          Candelaria, Atacama Region, Chile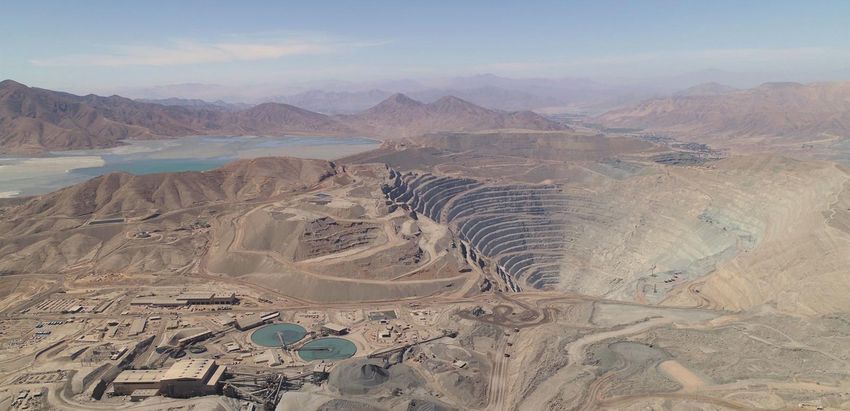
Cautionary Statements
Caution Regarding Forward-Looking Information and Non-GAAP Performance Measures
Certain of the statements made and information contained herein is “forward-looking information” within the meaning of applicable Canadian securities laws. All statements other than statements of historical facts included in this
document constitute forward-looking information, including but not limited to statements regarding the Company’s plans, prospects and business strategies; the Company’s guidance on the timing and amount of future production
and its expectations regarding the results of operations; expected costs; permitting requirements and timelines; timing and possible outcome of pending litigation; the results of any Preliminary Economic Assessment, Feasibility
Study, or Mineral Resource and Mineral Reserve estimations, life of mine estimates, and mine and mine closure plans; anticipated market prices of metals, currency exchange rates, and interest rates; the development and
implementation of the Company’s Responsible Mining Management System; the Company’s ability to comply with contractual and permitting or other regulatory requirements; anticipated exploration and development activities at
the Company’s projects; and the Company’s integration of acquisitions (such as the Chapada mine) and any anticipated benefits thereof. Words such as “believe”, “expect”, “anticipate”, “contemplate”, “target”, “plan”, “goal”, “aim”,
“intend”, “continue”, “budget”, “estimate”, “may”, “will”, “can”, “could”, “should”, “schedule” and similar expressions identify forward-looking statements.

Forward-looking information is necessarily based upon various estimates and assumptions including, without limitation, the expectations and beliefs of management, including that the Company can access financing, appropriate
equipment and sufficient labour; assumed and future price of copper, nickel, zinc, gold and other metals; anticipated costs; ability to achieve goals; the prompt and effective integration of acquisitions; that the political environment
in which the Company operates will continue to support the development and operation of mining projects; and assumptions related to the factors set forth below. While these factors and assumptions are considered reasonable by
Lundin Mining as at the date of this document in light of management’s experience and perception of current conditions and expected developments, these statements are inherently subject to significant business, economic and
competitive uncertainties and contingencies. Known and unknown factors could cause actual results to differ materially from those projected in the forward-looking statements and undue reliance should not be placed on such
statements and information. Such factors include, but are not limited to: risks inherent in and/or associated with operating in foreign countries; uncertain political and economic environments; community activism, shareholder
activism and risks related to negative publicity with respect to the Company or the mining industry in general; changes in laws, regulations or policies including but not limited to those related to permitting and approvals,
environmental and tailings management, labour, trade relations, and transportation; delays or the inability to obtain necessary governmental approvals and/or permits; regulatory investigations, enforcement, sanctions and/or
related or other litigation; risks associated with business arrangements and partners over which the Company does not have full control; risks associated with acquisitions and related integration efforts (including with respect to the
Chapada mine), including the ability to achieve anticipated benefits, unanticipated difficulties or expenditures relating to integration and diversion of management time on integration; competition; development or mining results not
being consistent with the Company’s expectations; estimates of future production and operations; operating, cash and all-in sustaining cost estimates; allocation of resources and capital; litigation; uninsurable risks; volatility and
fluctuations in metal and commodity prices; the estimation of asset carrying values; funding requirements and availability of financing; indebtedness; foreign currency fluctuations; interest rate volatility; changes in the Company’s
share price, and equity markets, in general; changing taxation regimes; counterparty and credit risks; health and safety risks; risks related to the environmental impact of the Company’s operations and products and management
thereof; unavailable or inaccessible infrastructure and risks related to ageing infrastructure; risks inherent in mining including but not limited to risks to the environment, industrial accidents, catastrophic equipment failures, unusual
or unexpected geological formations or unstable ground conditions; actual ore mined varying from estimates of grade, tonnage, dilution and metallurgical and other characteristics; ore processing efficiency; risks relating to
attracting and retaining of highly skilled employees; ability to retain key personnel; the potential for and effects of labour disputes or other unanticipated difficulties with or shortages of labour or interruptions in production; the
price and availability of energy and key operating supplies or services; the inherent uncertainty of exploration and development, and the potential for unexpected costs and expenses including, without limitation, for mine closure
and reclamation at current and historical operations; risks associated with the estimation of Mineral Resources and Mineral Reserves and the geology, grade and continuity of mineral deposits including but not limited to models
relating thereto; actual ore mined and/or metal recoveries varying from Mineral Resource and Mineral Reserve estimates; mine plans, and life of mine estimates; the possibility that future exploration, development or mining results
will not be consistent with expectations; natural phenomena such as earthquakes, flooding, and unusually severe weather; potential for the allegation of fraud and corruption involving the Company, its customers, suppliers or
employees, or the allegation of improper or discriminatory employment practices, or human rights violations; security at the Company’s operations; breach or compromise of key information technology systems; materially
increased or unanticipated reclamation obligations; risks related to mine closure activities; risks related to closed and historical sites; title risk and the potential of undetected encumbrances; risks associated with the structural
stability of waste rock dumps or tailings storage facilities; and other risks and uncertainties, including but not limited to those described in the “Risk and Uncertainties” section of the Annual Information Form for the year ended
December 31, 2018 and the “Managing Risks” section of the Company’s MD&A for the year ended December 31, 2019, which are available on SEDAR at www.sedar.com under the Company’s profile. All of the forward-looking
statements made in this document are qualified by these cautionary statements. Although the Company has attempted to identify important factors that could cause actual results to differ materially from those contained in
forward-looking information, there may be other factors that cause results not to be as anticipated, estimated, forecast or intended and readers are cautioned that the foregoing list is not exhaustive of all factors and assumptions
which may have been used. Should one or more of these risks and uncertainties materialize, or should underlying assumptions prove incorrect, actual results may vary materially from those described in forward-looking
information. Accordingly, there can be no assurance that forward-looking information will prove to be accurate and forward-looking information is not a guarantee of future performance. Readers are advised not to place undue
reliance on forward-looking information. The forward-looking information contained herein speaks only as of the date of this document. The Company disclaims any intention or obligation to update or revise forward‐looking
information or to explain any material difference between such and subsequent actual events, except as required by applicable law.

This presentation may contains certain financial measures such as net cash, net debt, operating cash flow per share, co-product cash costs and cash costs which have no standardized meaning within generally accepted accounting
principles under IFRS and therefore amounts presented may not be comparable to similar data presented by other mining companies. This data is intended to provide additional information and should not be considered in
isolation or as a substitute for measures or performance prepared in accordance with IFRS.
Note: All dollar amounts are in US dollars unless otherwise denoted.
                                                                                                                                                                                                                                2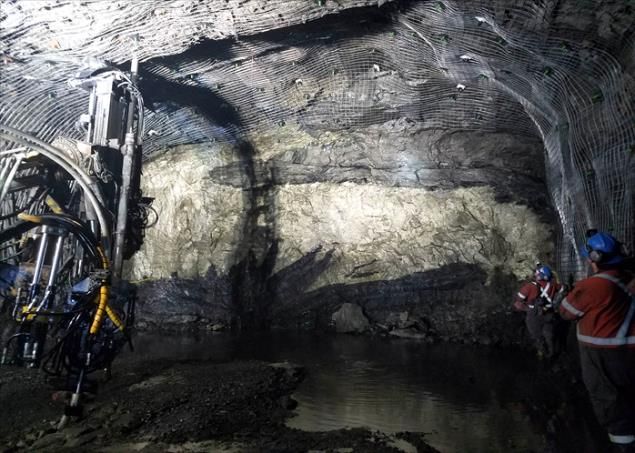
Lundin Mining
Our Strategy
Operate, upgrade and grow a base metals
portfolio that provides leading returns for our
shareholders throughout the cycle

 •   copper dominant
 •   competitive cost position
                                                                                                 Eagle                                             Zinkgruvan
 •   low-risk mining jurisdictions,                                                    Nickel-Copper-PGMs in U.S.A.                           Zinc-Lead-Copper in Sweden
     leverage current geographies
 •   pipeline of development and
     exploration projects
 •   maintain low leverage and flexible
     balance sheet while increasing
     direct shareholder returns

                                                                                                                                                  Neves-Corvo
                                                                                                                                              Copper-Zinc-Lead in Portugal

                                                                Candelaria1
                                                          Copper-Gold-Silver in Chile                                    Chapada
                                                                                                                      Copper-Gold in Brazil

                                          1. Lundin Mining holds an 80% interest in Candelaria                                                                               3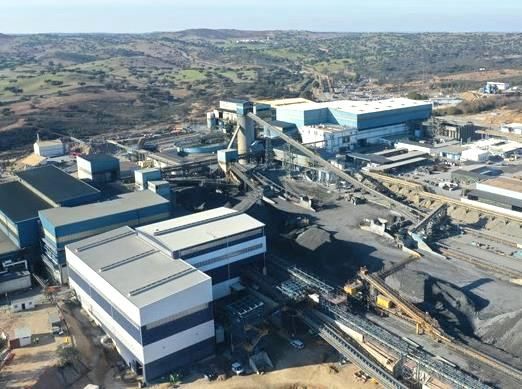
Responsible Mining
Safety
                                                                                     Total Recordable Injury Frequency
 •   overall safety performance continues to trend better                            per 200,000 person hours worked
 •   2019 TRIF performance includes the successful integration of the Chapada
     mine and saw a significant increase in exposure hours with project activities

Social
                                                                                            3.5
 •   leading ISS Environment & Social Quality Scores
                                                                                      3.1
 •   strong stakeholder engagement and increased social investment

Environmental                                                                                             2.5

•    robust risk and compliance management programs in place                                                     2.0

•    environmental footprint reduction goals set for water, dust and energy                        1.6                  1.6

                  United Nations Global Compact (UNGC)                                                                         0.9

                  •   Lundin Mining joined the UNGC in 2016                                                                           0.6    0.6    0.7    0.7

                  •   our Mission, Values and Responsible Mining Policy align
                      with the UNGC Ten Principles on human rights, labour, the
                      environment and anti-corruption, as well as the 17             2009   2010   2011   2012   2013   2014   2015   2016   2017   2018   2019
                      Sustainable Development Goals (SDGs)
                  •   we continue to further integrate the SDGs into our business
                      strategy, day-to-day operations and our organizational
                      culture by creating shared value, fostering partnerships and
                      demonstrating environmental and economic performance
                                                                                                                                                                  4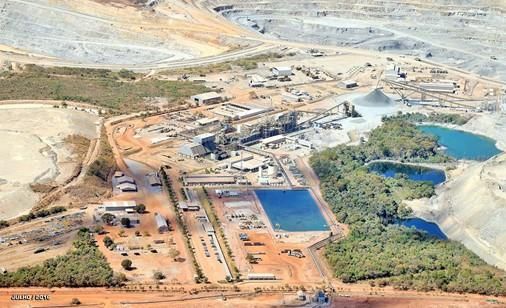
Increasing Production Profile1 (kt)

                                     Copper                                                                                                         Zinc                                                                                                  Nickel
                                                                     294 - 318
                                                                                                                                                                             227 - 237

                                         272 - 296                                                                                                                                                                                                           15 - 18                     15 - 18

                                                                                          +30%
                                                                                                                                                                                                                                      13
                                                                                                                                                 172 - 187                                          +50%
                                                       including
                                                     180-200 kozpa
                                                    gold in 2020-212

                   235

                                                                                                                           152

                 2019A                       2020                       2021                                             2019A                       2020                       2021                                               2019A                       2020                       2021

1. Production profile based on certain estimates and assumptions, including but not limited to; Mineral Resource and Mineral Reserve estimates geological formations, grade and continuity of deposits and metallurgical characteristics. The 2020-2021 guidance was announced by news release on November
   26, 2019. The 2019 production results were announced in the press release dated January 22, 2020. Copper production for 2019 reflects attributable production for the Chapada Mine under Lundin Mining ownership.
2. Gold production guidance for Candelaria is 100-105 koz in 2020 and 110-115 koz in 2021, on a 100% basis. Currently, 68% of Candelaria’s total gold and silver production are subject to a streaming agreement. Gold production guidance for Chapada is 90-95 koz in 2020 and 70-75 koz in 2021. Chapada’ s
   gold production is unencumbered.                                                                                                                                                                                                                                                                             5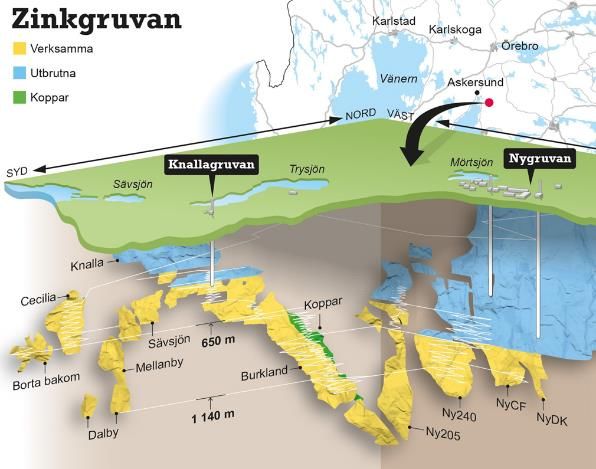
Candelaria
Increasing Production Profile
•    copper production increased 9% year-on-year in 2019 to 146,330 t                                               Copper, Gold Production & Cash Cost1 Outlook
•    2019 cash costs improved by 8% to $1.54/lb of copper, better than guidance                                      (100% basis; kt Cu, koz Au & $/lb Cu, net of by-product credits)

•    positioned to deliver a further 16% copper production increase in 2020, at reduced
     cash costs, as benefits of reinvestment initiatives are realized                                                                                                        185-195                  Avg. +190
•    copper production is forecast to average approximately 180,000 tpa over the ten-year                                                           165-175
     period 2020 through 2029, including +190,000 tpa 2022 through 2025

                                                                                                                              146

Capital Reinvestment Projects Nearing Completion
                                                                                                                                                                                          110-115
                                                                                                                                                                                                                   Avg. +110
                                                                                                                                                               100-105
 •   South Sector underground mine
     successfully transferred to                                                                                                       88
     operations ahead of schedule
     with first ore mined in Q3/19
                                                                                                                                 $1.54
                                                                                                                                                          $1.45
 •   mill optimization project forecast
     to be complete in late Q1/20
                                                                                                                                                                                                                            2
                                                                                                                                2019A                     2020                      2021                 2022-2025
 •   mine fleet reinvestment 99%
     complete with two remaining
                                                                                                                                                                  Copper             Gold
     pieces to be delivered in 2021
     and 2022

                                                                                                               1.    Currently, 68% of Candelaria’s total gold and silver production are subject to a streaming agreement and as such C1 cash costs
                                                                                                                     guidance is based on receipt of $412/oz and $4.12/oz, respectively, in 2020 on the streamed portion of gold and silver sales.
                                                                                                               2.    Average 2022-2025 production is based on the NI 43-101 Technical Reports dated November 28, 2018 which is available on
                                                                                                                     SEDAR under the Company’s profile page. See also slide 14.
                                          Last 390FL Excavator with long reach boom arrived in November 2019

                                                                                                                                                                                                                                            6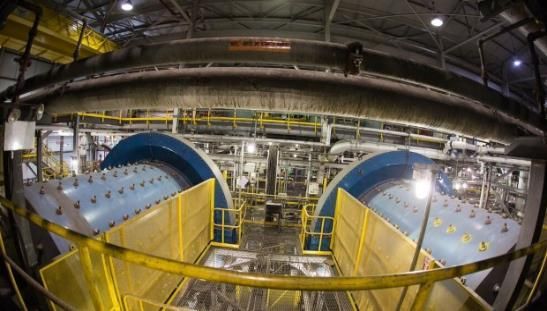
Chapada
Strong First Quarters Under Lundin Mining Ownership
•       copper production exceeded and gold production achieved 2019 guidance
                                                                                                          Copper, Gold Production & Cash Cost1 Outlook
                                                                                                              (100% basis; kt Cu, koz Au & $/lb Cu, net of by-product credits)
•       cash costs were better than guidance on lower operating costs, favourable FX rate and
        higher precious metal credits
•       forecast annual copper production to be between 51,000 t and 56,000 t over the next
        three years based on the current 24 Mtpa throughput rate and mine plan                                                                            90-95

•       annual gold production is forecast to be between 70,000 oz and 95,000 oz over the                                                                                                                     75-80
        same period                                                                                                                                                                 70-75

Significant
•           Increase in Exploration Underway
                                                                                                                                 54            51-56                     51-56                     51-56
    •    increased exploration
         efforts are underway,
         largely focused on
         near-mine targets                                                                                              31

    •    $10M program in 2020
         including an expanded                                                                                                                        $1.15
         50,000 m drill program                                                                                            $0.58

    •    advancing options for
                                                                                                                                      2
         mine and plant                                                                                                   2019A                       2020                      2021                      2022
         expansion in parallel
         with exploration                                                                                                                                  Copper              Gold

                                                                         Chapada processing facilities   1.   Chapada cash costs are calculated on a by-product basis and do not include the effects of its copper stream agreements. Effects of
                                                                                                              the copper stream agreements are reflected in copper revenue and will impact realized price per pound.
                                                                                                         2.   2019 production based on period of Lundin Mining’s ownership post closing of acquisition on July 5, 2019 (approximately half year).

                                                                                                                                                                                                                                      7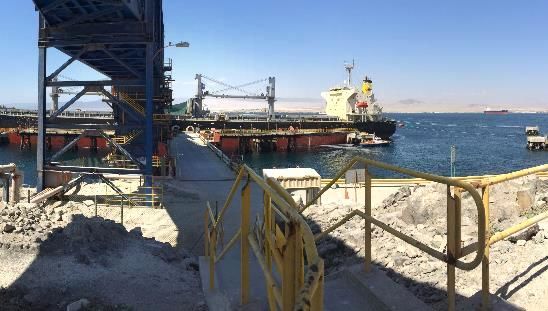
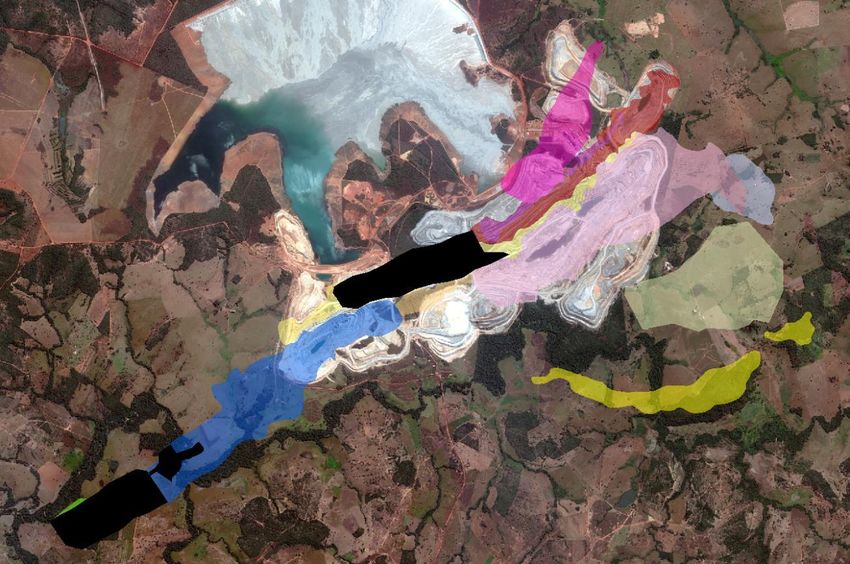
Chapada Near-Mine Exploration

         Near Mine Deposits                                                              Jatobá +
                 Chapada                                                                Buriti Norte
                 Sucupira/Cava Norte
                 Baruzinho
                 Baru/Baru NE
                SW Mina
                 Interpit
                Corpo Sul
                Santa Cruz
                Buriti
                Hidrotermalito
                Buriti Norte

                                                                          Sucupira SW

                                                 Corpo Sul / Santa Cruz

       Chapada deposits and near-mine exploration targets                                              8
Neves-Corvo
Increasing Zinc Production Profile
•    achieved 2019 copper and zinc production guidance at improved $1.59/lb copper
     cash cost guidance                                                                                            Copper, Zinc Production & Cash Cost Outlook
•    2020 zinc production is forecast to increase 37% over 2019 production as the ZEP is                                        (kt & $/lb Cu, net of by-product credits)
     commissioned and ramped-up during the year
•    zinc production forecast to increase a further 58% in 2021 over 2020 with the ZEP
     contributing a full year of production                                                                                                                 155-160         155-160

Zinc Expansion Project (ZEP) Advancing
 •   on schedule and budget                                                                                                                   95-105
     for phased start-up and
     production ramp-up in
                                                                                                                               73
     2020
 •   phased ramp-up targets                                                                                                           38-43             41-46         41-46
                                                                                                                       41
     commissioning the new
     SAG mill in Q1/20 with first
     ore in Q2/20                                                                                                           $1.59         $1.80

                                                                                                                        2019A             2020             2021             2022

                                                                                                                                               Copper      Zinc

                                               New ZEP mill and flotation buildings in foreground – January 2020
                                                                                                                                                                                      9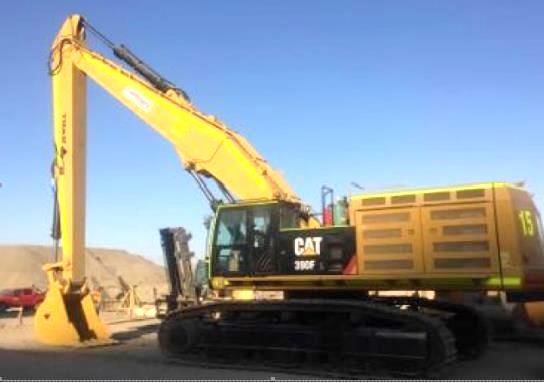
Eagle
Consistent Operating Performance
•    achieved both nickel and copper production guidance for the year
•    2019 cash costs were modestly higher than guidance primarily on lower sales volumes               Nickel, Copper Production & Cash Cost Outlook
                                                                                                                     (kt & $/lb Ni, net of by-product credits)
•    2020 nickel production to increase more than 3,000 t (22%) over 2019, at reduced cash
     costs, as higher-grade Eagle East ore contributes to the mill feed
•    copper production expected to increase more than 2,200 t (15%) in 2020
                                                                                                                                                                  17-20
                                                                                                                                             15-18      15-18
                                                                                                                           15-18    15-18
Successful Eagle East Development                                                                                                                 14-17
                                                                                                                    14
 •   first Eagle East ore                                                                                   13
     mined in Q3/19 and
     processed in Q4/19
 •   mine development
     continued in Q4/19                                                                                          $2.84
     allowing for full
     access to the higher-                                                                                                     $1.00
     grade ores in 2020

                                                                                                             2019A             2020           2021               2022

                                                                                                                                   Nickel   Copper

                                                                           Eagle East – January 2020

                                                                                                                                                                          10
Zinkgruvan
Improved Mine & Mill Performance
• 2019 production of zinc and copper achieved guidance for both metals at cash costs of
$0.39/lb zinc in line with guidance Zinc Production & Cash Cost Outlook
(kt & $/lb Zn, net of by-product credits)
• zinc, lead and copper production were greater year-on-year in 2019 as a result of
sustained improvement in metal recovery and zinc ore head grades
• production of zinc in 2020 is expected to be similar to 2019, while copper production is
77-82
forecast to increase to 3,000 - 4,000 t
78
72-77
69-74
Focused Exploration Program
• exploration continued on
existing ore bodies as well $0.55
as Dalby and Flaxen
deposits $0.39
• $15M exploration program
planned in 2020 includes
60,000 m of drilling
• aimed at increasing and
upgrading Mineral
2019A 2020 2021 2022
Resources at Dalby and
existing orebody extensions
Zinkgruvan mine Isometric
11Lundin Mining
High Quality Meaningful Scale
Financial Strength
Competitive Mines Growth Oriented
• strong margins at all operations • materially increasing copper and zinc • proven track record for rigorous investment
production profile approach, focused on value creation
• demonstrated operational excellence and
culture of continuous improvement • exploration upside and high-value • strong balance sheet with low leverage
expansion projects underway
• low-risk mining jurisdictions
12www.lundinmining.com | TSX: LUN | Nasdaq Stockholm: LUMI
NI 43-101 Compliance
Unless otherwise indicated, Lundin Mining Corporation (the “Company”) has prepared the technical information in this presentation including Mineral Reserve and Mineral Resource estimates (“Technical
Information”) based on information contained in the technical reports and news releases (collectively the “Disclosure Documents”) available under the Company’s profile on SEDAR at www.sedar.com. Each
Disclosure Document was prepared by or under the supervision of a qualified person (“Qualified Person”) as defined in National Instrument 43-101 – Standards of Disclosure for Mineral Projects of the
Canadian Securities Administrators (“NI 43-101”). For readers to fully understand the information in this presentation, they should read the technical reports identified below in their entirety, including all
qualifications, assumptions and exclusions that relate to the information set out in this presentation which qualifies the Technical Information. Readers are advised that Mineral Resource estimates that
are not Mineral Reserves do not have demonstrated economic viability. The Disclosure Documents are each intended to be read as a whole, and sections should not be read or relied upon out of context.
The Technical Information is subject to the assumptions and qualifications contained in the Disclosure Documents.
The Technical Information in this presentation has been prepared in accordance NI 43-101 and has been reviewed and approved by Stephen Gatley, BSc (Eng), C.Eng. Vice President - Technical Services of
the Company, a "Qualified Person" under NI 43-101. Mr. Gatley has verified the data disclosed in this presentation and no limitations were imposed on his verification process.
Mineral Resource and Mineral Reserve estimates of the Company are shown on a 100 percent basis for each mine. The Measured and Indicated Mineral Resource estimates are inclusive of those Mineral
Resource estimates modified to produce the Mineral Reserve estimates. All estimates of the Company are prepared as at June 30, 2019. Estimates for all operations are prepared by or under the
supervision of a Qualified Person as defined in NI 43-101 or have been audited by independent Qualified Persons on behalf of the Company.
Mineral Resources at Candelaria are estimated using metal prices of US$3.16/lb copper and US$1,000/oz gold and an exchange rate of USD/CLP 600. Mineral Reserves at Candelaria were estimated using
metal prices of US$2.75/lb copper and US$900/oz gold and an exchange rate of USD/CLP 600. Mineral Resources at Chapada and Suruca SW copper-gold are estimated using metal prices of US$4.00/lb
copper and US$1,600/oz gold and an exchange rate of USD/BRL 3.95. For the Suruca gold only Mineral Resource estimates at Chapada a gold price of $1,500/oz has been used and an exchange rate of
USD/BRL 3.50. Mineral Reserves at Chapada were estimated using metal prices of US$3.00/lb copper and US$1,250/oz gold and an exchange rate of USD/BRL 3.95. Mineral Resource for Neves-Corvo and
Semblana have been estimated using metal prices of US$2.75/lb copper and US$1.00/lb zinc and an exchange rate of EUR/USD 1.25. The Semblana Mineral Resource has been reported using the same
metal prices and exchange rates as Neves-Corvo. Mineral Resources and Mineral Reserves at Zinkgruvan have been estimated using metal prices of US$2.75/lb copper, US$1.00/lb zinc and US$1.00/lb lead
and an exchange rates of USD/SEK 7.00. Mineral Resources and Mineral Reserves at Eagle and Eagle East have been estimated using metal prices of US$2.75/lb copper and US$8.00/lb nickel. Refer to the
Company’s news release dated September 5, 2019 entitled “Lundin Mining Announces 2019 Mineral Resource and Reserve Estimates” on the Company’s website (www.lundinmining.com).
For further Technical Information on the Company’s material properties, refer to the following technical reports, each of which is available on the Company’s SEDAR profile at www.sedar.com:
Candelaria: technical report entitled Technical Report for the Candelaria Copper Mining Complex, Atacama Region, Region III, Chile dated November 28, 2018.
Chapada: technical report entitled Technical Report on the Chapada Mine, Goiás State, Brazil dated October 10, 2019
Neves-Corvo: technical report entitled NI 43-101 Technical Report for the Neves-Corvo Mine, Portugal dated June 23, 2017.
Zinkgruvan: technical report entitled NI 43-101 Technical Report for the Zinkgruvan Mine, Central Sweden dated November 30, 2017.
Eagle Mine: technical report entitled Technical Report on the Eagle Mine, Michigan, U.S.A. dated April 26, 2017.

                                                                                                                                                                                                                   14
You can also read