Brain Entropy, Fractal Dimensions and Predictability: A Review of Complexity Measures for EEG in Healthy and Neuropsychiatric Populations
←
→
Page content transcription
If your browser does not render page correctly, please read the page content below
Brain Entropy, Fractal Dimensions and Predictability: A Review of
 Complexity Measures for EEG in Healthy and Neuropsychiatric
                          Populations
             Zen J. Lau1, * , Tam Pham1, * , S.H. Annabel Chen1, 2, 3, 4 , & Dominique Makowski1
                           1 School of Social Sciences, Nanyang Technological University, Singapore
             2   Centre for Research and Development in Learning, Nanyang Technological University, Singapore
                      3 Lee Kong Chian School of Medicine, Nanyang Technological University, Singapore
                         4 National Institute of Education, Nanyang Technological University, Singapore

                       While electroencephalography (EEG) signals are commonly examined using conventional
                      linear methods, there has been an increasing trend towards the use of complexity analysis in
                      quantifying neural activity. On top of revealing complex neuronal processes of the brain that
                      may not be possible with linear approaches, EEG complexity measures have also demon-
                      strated their potential as biomarkers of psychopathology such as depression and schizophre-
                      nia. Unfortunately, the opacity of algorithms and descriptions originating from mathematical
                      concepts have made it difficult to understand what complexity is and how to draw consistent
                      conclusions when applied within psychology and neuropsychiatry research. In this review, we
                      provide an overview and entry-level explanation of existing EEG complexity measures, which
                      can be broadly categorized as measures of predictability and regularity. We then synthesize
                      complexity findings across different areas of psychological science, namely in consciousness
                      research, mood and anxiety disorders, schizophrenia, neurodevelopmental and neurodegener-
                      ative disorders, as well as changes across the lifespan, while addressing some theoretical and
                      methodological issues underlying the discrepancies in the data. Finally, we present important
                      considerations when choosing and interpreting these metrics.

                      Keywords: EEG, Complexity, Entropy, Fractal Dimension, Psychopathology
                      Word count: 8057

Complexity science is an umbrella term encompassing the                ing any long-term projections challenging. Nevertheless, the
study and characterization of “complex” systems - systems              overarching idea of complexity science is not necessarily to
consisting of multiple interdependent components that oper-            establish methods for making exact predictions, but rather to
ate and interact at different levels (Fernandez et al., 2013).         provide some insights into the characterization of the long-
Such complex systems typically exhibit “chaotic” behaviour.            term trajectory of a given complex system (Faure & Korn,
Rather than referring to a state of disorder or confusion, a           2001). These principles have its roots in a branch of mathe-
chaotic system is characterized by unpredictability and irreg-         matics called chaos theory (see Thietart & Forgues, 1995 for
ularities, often the result of a multitude of nonlinear interac-       an overview), which has led several disciplines (e.g., envi-
tions (Faure & Korn, 2001). As a result, small changes in the          ronmental science, meteorology, biology) to adopt the frame-
system can lead to exponential changes (a property popular-            work of complex dynamical systems (Burggren & Monti-
ized as the ‘butterfly effect’). For instance, the Earth’s atmo-       cino, 2005; Kiel & Elliott, 1996).
sphere at any point in time and space is the result of a (virtu-
ally infinite) number of variables (e.g., temperature, particle        The application of complexity science to nonlinear systems,
composition, cloud density, etc.) interacting together, render-        referred to as “nonlinear dynamics,” is an emerging ap-
                                                                       proach gaining traction in the study of human physiology and
                                                                       pathology (Ehlers, 1995). The theoretical conceptualization
                                                                       of the human physiological system as complex is warranted
   *These two authors contributed equally to the study.                given that it is made up of multiple constituent subsystems
   Correspondence concerning this article should be addressed to       (be it anatomical components or physiological processes)
S.H. Annabel Chen, HSS 04-19, 48 Nanyang Avenue, Singapore.            that are constantly interacting between themselves at differ-
E-mail: annabelchen@ntu.edu.sg                                         ent levels (i.e., from molecules to organs), as well as with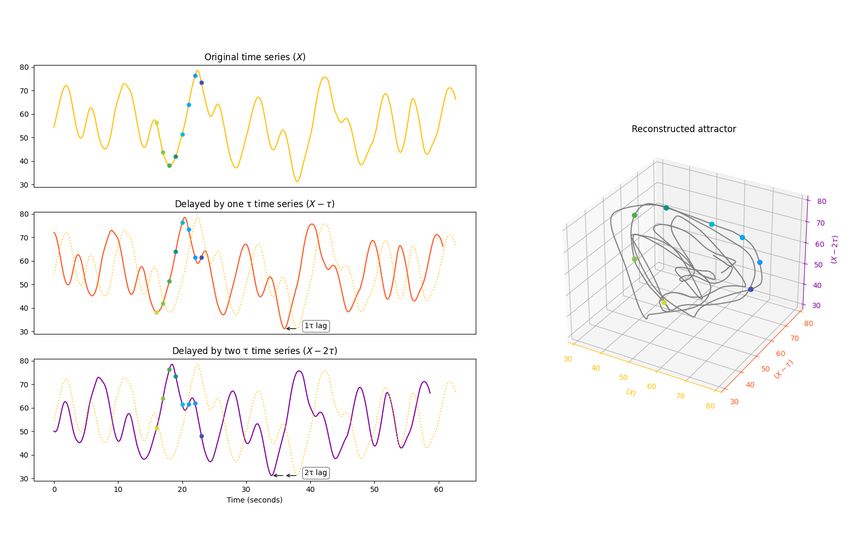
2                             ZEN J. LAU1, * , TAM PHAM1, * , S.H. ANNABEL CHEN1, 2, 3, 4 , & DOMINIQUE MAKOWSKI1

the external environment to maintain homeostasis (Faure &                EEG analysis techniques (such as event-related potentials
Korn, 2001). The underlying assumptions are that physio-                 or time/frequency analysis) in detecting changes in psy-
logical systems are inherently complex (Golbeter, 1996), and             chopathological states (Sohn et al., 2010) and potentially ex-
that pathological states (or ‘dynamical diseases,’ see Mackey            pediting diagnosis of diseases (Czigler et al., 2008). How-
& Glass, 1977) can be characterized by disrupted or ab-                  ever, there is currently a mismatch between the rapid growth
normal dynamic processes. One of the seminal works that                  of such applications and the presence of comprehensive re-
contributed to this perspective was Lipsitz and Goldberger               views needed to guide psychological researchers in the use
(1992), who demonstrated that aging and disease are associ-              of EEG complexity measures.
ated with a generalized loss of physiological complexity due
to functional and/or structural alteration in the underlying or-         Despite the potential of neurophysiological complexity anal-
ganization of the physiological system (see Vaillancourt &               ysis in studying normal and abnormal psychological states
Newell, 2002 for a schematic illustration of this idea).                 and mechanisms, several limitations hinder its development.
                                                                         Firstly, the strong mathematical nature of the field often
                                                                         makes methodologies and findings opaque to most psychol-
                 Physiological Complexity                                ogy and neuroscience researchers (Yang & Tsai, 2013). Sec-
                                                                         ondly, although most findings in physical diseases support
The applications of complexity science have been largely                 the idea that a loss of complexity signifies deficient (or un-
centred on electrophysiological signals (Goldberger et al.,              healthy) states and/or systems (Mackey & Glass, 1977), this
1985), as they confer sufficiently high temporal resolution              notion does not fully concur with the existing literature.
for sensitive characterization of the chaotic nature of biolog-          Based on existing reviews of complexity findings in sev-
ical activity (Bornas, 2017; Fernandez et al., 2013). These              eral neuropsychiatric conditions (Aguiar Neto & Rosa, 2019;
research efforts initially focused on quantifying physical dis-          Fernandez et al., 2013; Sun et al., 2020), researchers have not
eases, such as using the complexity of heart rate variability            unanimously found a decrease in brain complexity across dif-
(HRV, Pham et al., 2021) to predict cardiovascular compli-               ferent psychiatric populations (Yang & Tsai, 2013). Hence,
cations (Acharya et al., 2015; Khandoker et al., 2009; Song              the aim of this paper is two-fold; 1) to provide an entry-level
et al., 2014; Tang et al., 2015). Adherents of complexity sci-           explanation of the complexity measures and 2) to synthesize
ence subsequently argued for its utility in the context of neu-          findings on EEG complexity across different areas of psy-
ropsychiatric diseases and mental states characterization (An            chology and neuropsychiatry, highlighting methodological
der Heiden, 2006; Tretter et al., 2011). Particularly, dimin-            issues that may contribute to the existing discrepancies in the
ished complexity is typically observed in the physiological              literature. Rather than providing an exhaustive list of com-
states of individuals with psychopathological illnesses (e.g.,           plexity metrics (an endless endeavour given that new indices
lower HRV complexity observed in depression, Leistedt et                 are developed on a regular basis), the focus of this paper is to
al., 2011; Schulz et al., 2010; schizophrenia, Bar et al., 2007;         summarize and provide a framework for understanding the
and bipolar disorders, Henry et al., 2010), as well as in their          main concepts and findings of EEG complexity to foster fu-
associated symptoms (e.g., greater predictability in cognitive           ture advancements in this area.
tasks, Paulus et al., 1996; mood fluctuations, Gottschalk et
al., 1995; and psychotic symptoms, Paulus & Braff, 2003).
Propelled by mathematical innovations facilitating complex-                                   Quantifying Complexity
ity analyses for multi-channel signals (i.e., magneto/electro-
encephalography; M/EEG), the evidence of “chaotic” pat-                  Complexity metrics can be conceptualized as reflecting two
terns has been since demonstrated beyond the behavioural                 aspects of the dynamics of a system, namely (1) predictabil-
and peripheral levels to include the neurophysiological level.           ity and (2) regularity. Though these two terms have often
In particular, the use of EEG for understanding the brain’s              been used interchangeably in the literature, predictability and
complex dynamics has been growing in popularity. In-                     regularity are, at the coarse-grain level, two distinct charac-
deed, there has been an acceleration in the number of stud-              teristics of a chaotic system. Predictability of a dynamical
ies attempting to delineate maladaptive psychopathologi-                 system describes the temporal evolution of the system states
cal mechanisms by investigating EEG complexity in var-                   whereas regularity describes the general amount of repeti-
ious experimental conditions, from sleeping (e.g., Chou-                 tions of patterns in the system’s trajectory. Predictability can
varda et al., 2010) and anaesthetic states (e.g., Zhang et al.,          be thought of focusing on the process underlying the chaotic
2001), to tasks that involve responding to emotional stim-               system while regularity corresponds to the product of that
uli (e.g., Aftanas, Lotova, Koshkarov, Popov, et al., 1997)              process. While we discuss the complexity metrics according
and mental arithmetic (e.g., M. R. Mohammadi et al., 2016).              to these two categories to facilitate conceptual understand-
Complexity measures of EEG signals may supplement, if                    ing, readers should keep in mind that the two concepts re-
not provide greater utility and sensitivity than conventional            main strongly related in practice.
COMPLEXITY MEASURES FOR EEG 3
of the reconstructed attractor (hence the “spatial dimension-
ality” denomination).
Figure 1. Complexity measures can be structured broadly into
indices of predictability and regularity. Measures of predictability
capture either spatial or temporal dimensionality of the dynamical
system, and measures of regularity reflect the complexity of the
system’s output either on single- or multi- scales.
Figure 2. Time-delay embedding method to reconstruct an attrac-
tor in the phase space with delay (t) = 2 and number of dimensions
(m) = 3. The top left panel shows an example of a simulated heart
Predictability rate time series. The middle left panel is the time series but de-
layed by 1 t of 2 seconds. The bottom left panel is the time series
delayed by 2 t. The three time series are projected to a 3D space
Methods that primarily capture the predictability of a dynam-
where each state vector (solid point) is plotted with the coordinates
ical system focus on evaluating the correlation present in the
provided by the respective time series, forming an attractor (see
temporal evolution of its associated time series. Based on plot on the right).
their algorithms, these methods can be further categorized
into two sub-groups (see Figure 1): (A) spatial dimensional- One of the important geometric features of an attractor is its
ity requires a reconstruction of the “state space” (see below) dimensionality (referred to as fractal dimensionality), which
of the time series before estimating its predictability and (B) is different and more informative than the usual concept of
temporal dimensionality characterizes the predictability of a (topological) dimensionality. Mathematically, fractal dimen-
dynamical system directly from the signal time series. sions define the minimum number of coordinates needed to
locate any point within the phase space and can be inter-
Spatial dimensionality. Complex systems can be mathe-
preted as a measure of the structural complexity of a dynam-
matically modelled by a set of differential equations, referred
ical system. Correlation dimension (CD, also referred to as
to as dynamic variables. These variables can be represented
D2) is one such fractal dimension (FD) indices (Grebogi et
in a coordinate system called the state space where each iso-
al., 1986). By estimating the probability of any two pairs of
lated point in the space (a state vector) represents a system
points on the attractor separated by a distance smaller than
state. As it is beyond the scope of this paper to describe the
a pre-defined value, CD sets the lower bound to the actual
reconstruction of the state space from the time series, de-
number of dimensions of the attractor which in turn indicates
tails can be found in Deyle and Sugihara (2011). Extending
the number of independent variables needed to model the
from the concept of state space, the phase space is another
system (Ding et al., 1993; Grebogi et al., 1986). Generally,
coordinate system that captures the evolution of the states
the larger the CD of a biological signal, the more complex
over time. Each point of the phase space represents a system
the dynamics of the underlying physiological system.
state at a given time instant. If the dynamical system being
modelled is one of the real-world signals (e.g., biological sig- The complexity of a system can also be measured by a set of
nals), after a long enough time, the evolution of the dynamic Lyapunov exponents (LE) which describe the system’s pre-
variables will reach an equilibrium where the dynamical sys- dictability and stability. Mathematically, LE is quantified as
tem is bounded by a subset of the states with physical sig- the rate of exponential separation with time of two initially
nificance called the attractor (see Figure 2). The geometry neighbouring points on the attractor (Wolf et al., 1985). Pos-
of the attractor constructed from a biological signal captures itive and negative values of LE correspond to whether the tra-
the unique information about the dynamic nature of the un- jectories of the states exponentially diverge or converge over
derlying physiological system, beyond what traditional sig- time. Visually, it characterizes the stretching and shrinking
nal analysis in time and frequency domains can describe. As of the phase space respectively. While a system can have
such, most of the spatial dimensionality indices described be- multiple LEs, the predictability of the system is mainly de-
low actually refer to characterizations of the geometric shape termined by the largest LE value (L1). Similar to CD, a larger4 ZEN J. LAU1, * , TAM PHAM1, * , S.H. ANNABEL CHEN1, 2, 3, 4 , & DOMINIQUE MAKOWSKI1
L1 is suggestive of a more complex signal. periods, HE is a measure of the complexity over longer pe-
riods (Gneiting & Schlather, 2004). The two most popu-
Another important measure also derived from the quantifica-
lar estimators of HE are the rescaled range (R/S) analysis
tion of the reconstructed attractor is the Kolmogorov-Sinai
(Bassingthwaighte & Raymond, 1994; Hurst, 1951) and the
entropy (KSE, Sinai, 1959). Although originating from in-
Detrended Fluctuation Analysis (DFA, Peng et al., 1995).
formation theory (which will be discussed later), KSE can be
As DFA measures the fluctuations of the trends rather than
defined, with respect to the spatial dimensionality perspec-
of the signal ranges, it is naturally more sensitive to non-
tive, as the rate at which two points that were initially close
stationarity (i.e., local trends) than the R/S analysis, and thus
in the phase space move apart. This definition strongly aligns
more suitable and commonly used for the analysis of biolog-
with that of LE since both measures seek to quantify the
ical signals (Grech & Mazur, 2004; Krivstoufek & others,
changes in volume (stretching/shrinking) of the phase space
2010). In essence, DFA derives a single scaling exponent,
over time (Kamizawa et al., 2014). In fact, KSE is related to
α, that describes how signal fluctuations in short windows of
the sum of all positive LEs, which intuitively translates to the
time are related to the fluctuations observed in larger win-
total amount of divergence of the temporal trajectories of the
dows of time. The details about its computational steps can
states (Pesin, 1977). Generally, a more positive KSE reflects
be found in Peng et al. (1995) and Hardstone et al. (2012).
a less predictable system.
In general, for a biological signal and for 0.5 < α < 1, the
Temporal dimensionality. While the methods under the closer the value of DFA exponent to 1, the more complex the
spatial dimensionality group estimate the complexity of the dynamical system. For α > 1, the higher the DFA exponent
signals by quantifying the characteristics of the attractor, the value, the less complex the dynamical system.
methods under the temporal dimensionality group directly
DFA was originally formulated as a monofractal index where
treat the time series itself as a geometric figure.
a single scaling exponent is computed to characterize a time
For instance, the Higuchi’s fractal dimension (HFD) is an- series, and which assumes that the DFA exponent is homo-
other common FD index. However, unlike CD, which ap- geneous over the entire time series. However, mounting evi-
proximates the FD of a physiological system indirectly from dence has suggested that our biological dynamics are, in fact,
the phase-space reconstruction, HFD calculates the FD di- multifractal (Racz et al., 2018; Sassi et al., 2009; Suckling et
rectly from the time series (Higuchi, 1988), and is therefore al., 2008; Xue & Bogdan, 2017), rendering a single scal-
faster and more efficient. Additionally, contrary to other in- ing exponent inadequate to capture their true dynamical na-
dices such as CD, that assumes signal stationarity (a con- ture (Ihlen & Vereijken, 2010). Therefore, DFA has been
dition usually not fulfilled by neurophysiological signals), extended under the term multifractal DFA (MF-DFA) (Ihlen
HFD, which does not share this assumption, provides in this & Vereijken, 2010; Kantelhardt et al., 2002), in which mul-
context a more accurate estimation of FD (Accardo et al., tiple exponents (i.e. multifractal exponents) are computed
1997; Spasic et al., 2011). (Ihlen, 2012; Ihlen & Vereijken, 2010). The degree of mul-
tifractality of a time series can be quantified with statistical
Similar to HFD, Katz’s fractal dimension (KFD) also esti- metrics such as mean or range of exponent value (mean or
mates FD directly from the time series. In various compar- max - min α) (Vergotte et al., 2018; Zorick & Mandelkern,
isons of their performances, HFD generally has a higher ac- 2013). Higher degree of multifractality is often associated
curacy, while KFD tends to underestimate the true value of with greater number of interacting underlying networks or
the FD of a system (Paolo Castiglioni, 2010; Esteller et al., mechanisms (Torre et al., 2019; Vergotte et al., 2018).
2001; Shi, 2018). While both methods are equally efficient
for short recording lengths, HFD becomes increasingly more
efficient than KFD as the length increases (Esteller et al., Regularity
2001). Nevertheless, KFD is shown to be less sensitive to
noise and more consistent at discriminating different states
Methods that capture the regularity of a dynamical system
of brain function or different fractal features (Esteller et al.,
focus on evaluating the presence of repetitive patterns in the
2001; Shi, 2018). In other words, for short recording lengths,
time series. Most of the common metrics categorized un-
and/or when estimating changes in FD is more important
der this group belong to a family of statistics called entropy,
than its exact quantification, KFD is considered as a more
which corresponds to the amount of uncertainty present in
desirable method as compared to HFD.
a system (Cover & Thomas, 2006). As such, the regularity
A phenomenon that is closely related to FD is the Hurst ex- indices describe the regularity of a dynamical system by ap-
ponent (HE, Hurst, 1951; Mandelbrot & Wallis, 1969). Both proximating the amount of (un)certainty present in the infer-
FD and HE seek to approximate the temporal correlation ence about the trajectory of an entire system. One of the first
properties of a system. However, while FD represents the application of entropy into the study of complexity resulted
structural complexity of the dynamical structure over shorter in the formulation of KSE (Sinai, 1959), described above.COMPLEXITY MEASURES FOR EEG 5
Nevertheless, unlike other entropy indices, KSE is not cate- ing (i.e., downsampling). Recognizing the appropriateness of
gorized as a regularity index since its theoretical foundation the multiple-scale approach in the study of physiologic sig-
is more akin to that of the aforementioned indices in the pre- nals, newer multiscale-entropy-based indices have also been
dictability group. proposed such as the Multiscale permutation entropy (MPE)
where permutation entropy is used instead of SampEn (Aziz
While KSE or other spatial dimensionality measures such as & Arif, 2005; Davalos et al., 2019), Multiscale fuzzy entropy
CD and LE require a full reconstruction of the attractor, ApEn (MFE, Zheng et al., 2014), refined MSE where time scales
can work with a lower resolution of phase space, trading off are defined more rigorously (Valencia et al., 2009), multivari-
details for robustness; the sacrifice of resolution allows ApEn ate MSE which is more appropriate for multi-channel signals
to be applicable to time series that are noisier, or of smaller such as EEG (Ahmed & Mandic, 2011; Azami et al., 2017),
sizes - those for which KSE could not be reliably computed or modified MSE (MMSE) where the variance, instead of the
(Delgado-Bonal & Marshak, 2019; S. Pincus, 1995; S. M. mean, is used in the coarse graining process (Costa & Gold-
Pincus & Goldberger, 1994). Generally, higher ApEn values berger, 2015). The multiscale approach has also been in-
indicate more independence between the data points, i.e., a corporated into the MF-DFA algorithm (Gieraltowski et al.,
lower number of repetitive patterns (lower regularity), and 2012) to improve its validity. Even though new multiscale-
thus a higher level of complexity. However, regardless of its based indices are being to be introduced, attempting to ad-
robustness, ApEn’s tendency to overestimate the level of reg- dress previous limitations, their relative performance have
ularity in the signal (Al-Angari & Sahakian, 2007; Delgado- not yet been formally investigated.
Bonal & Marshak, 2019; Xie et al., 2008) has led to the pro-
posal of another regularity index, Sample entropy (SampEn, Another regularity index that is popular in the examination
Richman & Moorman, 2000). SampEn can be interpreted in of biological dynamical systems is the Lempel-Ziv complex-
a similar fashion as ApEn, but is formulated differently so ity (LZC, Lempel & Ziv, 1976). Unlike the other indices
that not only does it address the root cause of ApEn’s bias, under this category, LZC is not based on entropy but origi-
it is also less affected by the length of the time series (Hen- nates from a family of techniques that maps time series into
riques et al., 2020). sequences of symbolic representations. Simply put, the reg-
ularity of the signal is determined through scanning the sym-
However, as both ApEn and SampEn rely on a single con- bolic sequences for new patterns, increasing the complexity
stant parameter to evaluate the repetitiveness of the patterns count every time a new sequence is detected. As compared to
present in the signals, both indices have been shown to be other complexity measures, LZC is relatively less computa-
significantly sensitive to the value of the chosen parameters tionally expensive, easy to implement, and can be applied di-
used to compute them (P. Castiglioni & Di Rienzo, 2008; Liu rectly on biological signals without any preprocessing steps
et al., 2010). An alternative way of measuring repetitiveness (Aiordachioaie & Popescu, 2020; Zhang et al., 2001). There-
was proposed where an exponential function (i.e. fuzzy func- fore, even though the performance of LZC, as relative to other
tion, Zadeh, 1996) was used instead of a fix constant, leading indices, remains indeterminate (Aiordachioaie & Popescu,
to the formulation of another entropy-based measure named 2020; Fathillah et al., 2017; Ibanez-Molina et al., 2015), it
Fuzzy entropy (FuzzyEn, W. Chen et al., 2009). Generally, has been applied extensively in various fields. In the follow-
FuzzyEn has been shown to outperform SampEn in its sta- ing section, the quantification of brain dynamical complexity
bility and ability to discriminate physiological systems with in the fields of psychology and neuroscience, using the in-
hypothesized differences in complexity (Simons et al., 2018; dices mentioned thus far, will be summarized and discussed.
Tibdewal et al., 2017).
A common characteristic of ApEn, SampEn and FuzzyEn is Brain Complexity in Psychology and Neuroscience
that they infer the level of complexity from the regularity
of the signal at the original time scale (single-scale based). One important distinction when it comes to the applica-
Though relatively efficient, critics believe that this single- tion of complexity analysis to biological systems is the dis-
scale approach might prevent them from thoroughly captur- tinction between complexity and randomness (see Figure
ing the complex nature of biological systems, which signals 3). While both complex and random systems can gener-
withhold differential meaning at various spatial and temporal ate “seemingly” unpredictable and irregular outputs (indexed
scales (Busa & Emmerik, 2016; Costa et al., 2002, 2005; by different complexity measures), Grassberger (2012) and
Yakovleva et al., 2020). Thus, to accurately estimate the other researchers emphasized the importance of the mean-
multi-scale spatio-temporal complexity of physiologic sig- ingfulness that underlies a complex system, which is absent
nal, Costa et al. (2002) introduced a new entropy-based mea- from a random system (Goldberger et al., 2002; Yang &
sure called Multiscale entropy (MSE). This index is obtained Tsai, 2013). However, given our current understanding of the
from computing SampEn for multiple scales that are derived physical meaning of different complexity measures, the dis-
from the original signal through the means of coarse grain- tinction between pure measures of randomness and meaning-6 ZEN J. LAU1, * , TAM PHAM1, * , S.H. ANNABEL CHEN1, 2, 3, 4 , & DOMINIQUE MAKOWSKI1
ful measures of complexity remains fuzzy at best, especially creases in neural complexity have been frequently reported
in the context of physiological systems. This may partly ex- in schizophrenia populations. Diminished EEG complexity
plain the contradictory findings in the literature, as higher has been observed with several measures (see Table 1). This
values of complexity indices could indicate either a more decrease in complexity, especially in the frontal areas of the
complex system, or a more random system (Torre-Luque et brain (Akar, Kara, Latifoglu, et al., 2015b, 2015a; Jeong et
al., 2016). al., 1998; Kim et al., 2000; Raghavendra et al., 2009) may be
interpreted as a reduction in information processing and in-
flexible neural networks (Kim et al., 2000). This is consistent
with previous neuroimaging findings regarding hypofrontal-
ity (i.e., abnormal under-activation of frontal regions, Gat-
taz et al., 1992) in schizophrenia patients, which has been
linked to the severity of negative symptoms, such as blunted
affect, abulia and asociality (Wolkin et al., 1992). On the
other hand, there is also an equally large number of stud-
ies indicating increased EEG complexity in schizophrenia,
demonstrated through L1 during REM sleep (Roschke et al.,
1995), MSE during resting state (Takahashi et al., 2010), and
various other measures during different mental tasks (see Ta-
ble 1).
One hypothesis to explain these contradictory results was
put forth by Lee et al. (2008), who observed that increased
complexity was more typically reported in patients with a
more recent onset of schizophrenia, that were also younger,
pre-medicated and with more positive symptoms. This was
corroborated by Raghavendra et al. (2009) who under-
scored symptomatology as an important factor, demonstrat-
ing that individuals with positive symptoms exhibited similar
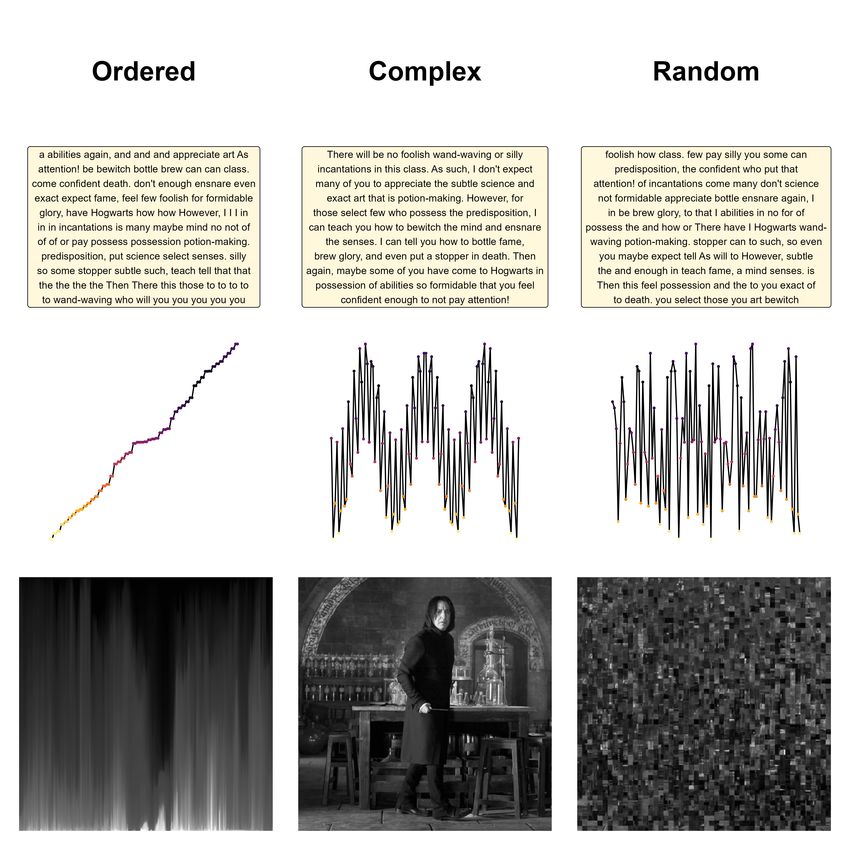
Figure 3. Illustrations of the difference between complexity, order or greater HFD values than healthy controls, whereas those
and randomness, using various examples namely text, signal and with negative symptoms had lower complexity scores. At
pictorial examples. In the text example, words are arranged in first glance, this finding may seem contrary to the idea that
alphabetical order in the ordered output, indiscriminately arranged healthy physiological systems are always indexed by greater
in the random output, and structured according to semantic and
complexity (Lipsitz & Goldberger, 1992). However, as men-
syntactic rules in the complex output. In the signal example, the
tioned above, this unidirectional view of physiology can-
ordered signal contains data points sorted according to amplitude,
the random signal consists of data points sampled at random, and not be accommodated by existing measures of complexity,
the complex signal is a mixture of signals of multiple frequencies. which can generate equally high indices from both random
In the pictorial example, pixels are vertically ordered by luminance and complex systems (such as LZC, discussed below). In
in the ordered output, scrambled in the random output, and the the case of schizophrenia, extremely high values of complex-
complex arrangement of pixels creates a meaningful picture. The ity could be indicative of greater polyrhythmic, disorganized
aim is to show that complex is not synonymous with random, an brain activity, particularly in patients with active psychosis
important conceptual distinction in complexity science. (Fingelkurts et al., 2006), which can be interpreted as greater
randomness (Torre-Luque et al., 2016). This thus suggests
a breakdown in the functional integration of schizophre-
Schizophrenia nia brains (see disconnection syndrome hypothesis, Friston,
2002) with cortical desynchronization manifesting as posi-
Of all psychopathological disorders, schizophrenia has been tive symptoms (e.g., hallucinations, delusions). Consistent
the most widely studied in terms of brain complexity (Yang with this, Koukkou et al. (1993) reported that schizophrenia
& Tsai, 2013) - unsurprisingly - as the wide range of positive patients who were in remission and were free from antipsy-
and negative symptoms resulting in multi-faceted manifesta- chotic medication had lower CD values than first-episode,
tions makes schizophrenia an ideal candidate for complex- pre-medication acute patients. Neural activity in schizophre-
ity investigations (Yang & Tsai, 2013). Researchers have nia thus seems to be characterized by a loss of complexity,
expected altered brain dynamics in schizophrenia as a con- where the amount of randomness may be attenuated by fac-
sequence of abnormal fluctuations in dopamine levels (An tors such as antipsychotic agents, age, and symptomatology
der Heiden, 2006). Interestingly, both increases and de- (Fernandez et al., 2013).COMPLEXITY MEASURES FOR EEG 7
Mood and Anxiety Disorders (GAD) was found to be associated with higher CD val-
ues (Wang et al., 2016), but post-traumatic stress disorder
Relatedly, several researchers have long underscored the as- (PTSD) was conversely associated with globally diminished
sociation between enhanced cortical dynamics, healthy cog- CD (Chae et al., 2004). A mechanistic interpretation based
nitive functioning, and emotional regulation (Aftanas, Lo- on different modes of information processing may help to
tova, Koshkarov, Pokrovskaja, et al., 1997; Aftanas, Lotova, clarify this inconsistency (Molle et al., 1999). Indeed, the
Koshkarov, Popov, et al., 1997; Carlino et al., 2012; Gregson dominant mode of cognitive processing in GAD patients may
et al., 1993; Lamberts et al., 2000; Martinez-Rodrigo et al., be more akin to mind wandering and divergent thinking (e.g.,
2019; A. R. McIntosh et al., 2008). As cognitive and emo- catastrophizing, Schoenberg, 2020) whereas in PTSD, where
tional dysregulation are transdiagnostic markers of mood and individuals are under a state of hyperarousal, and excessively
anxiety disorders (Holtzheimer & Mayberg, 2011), it might focused on traumatic memories, information processing may
be intuitive to expect lower neural complexity in these pa- be more rigid (Chae et al., 2004). However, it is important to
tient populations as compared to their healthy counterparts. note that these interpretations may be specific to the neural
However, as with the literature on schizophrenia, conflicting complexity during resting state, which entails spontaneous
trends in mood and anxiety disorders also appear to challenge information processing (Bob & Svetlak, 2011), as some evi-
the unidirectional notion of complexity as being adaptive. dence indicates that being under active states of anxiety, such
as during the processing of stressful memories, results in
Depression is a disorder characterized by dysthymia and an- greater neural complexity than at rest (L1 in panic disorder
hedonia, reinforced by inflexible cognitive patterns manifest- patients, Bob et al., 2006).
ing primarily as negative ruminations (Holtzheimer & May-
berg, 2011). Studies have reported overall lower values of Given the prevalence of comorbidities and heterogeneity of
complexity in the EEG signals of individuals with depres- mood and anxiety disorders, inconsistency in the literature
sion as compared to healthy controls (see Table 2). This may may be partially due to the classification of disorders as spe-
be explained by maladaptive emotion regulation (ER) styles cific diagnostic entities. One starting point may be to dis-
(e.g., self-blaming and rumination, Bornas et al., 2013) and a tinguish between episodes of the disorder (e.g., Cukic et al.,
tendency to fixate on negative emotional states (Holtzheimer 2020). For example, some preliminary evidence shows that
& Mayberg, 2011), both of which have been associated with in bipolar mood disorder, manic episodes are higher in EEG
lower EEG complexity. complexity than depressive episodes (Bahrami et al., 2005;
Thomasson et al., 2002). Alternatively, a transdiagnostic
However, several other studies report an opposite trend (see approach, may be more useful in understanding how EEG
Table 2) across different paradigms such as resting state complexity relates to different psychopathological symptoms
(Bachmann et al., 2015), mental arithmetic tasks (Li et al., (Dalgleish et al., 2020). As a complex interplay of biopsy-
2008) and emotional stimuli tasks (Akar, Kara, Agambayev, chosocial processes underlie these disorders, investigating
et al., 2015). Positive relationships between the severity of neural complexity based on their common factors and pro-
depressive symptoms and various EEG complexity indices cesses (whether psychological, environmental, or biologi-
have also been reported (see Table 2), with treatment asso- cal), rather than traditional diagnostic boundaries, may help
ciated with greater complexity reductions (Thomasson et al., us better understand the relationship between complexity and
2000). Moreover, Mendez et al. (2012) demonstrated that mental health difficulties. Currently, there is no existing
antidepressant treatment reduced LZC (MEG signals) in un- study relating EEG complexity to transdiagnostic markers of
medicated depressed patients (who had higher pre-treatment mood and anxiety disorders.
LZC scores than healthy controls), and that these complexity
reductions were correlated with the extent of symptom re-
missions. With regards to this, Y. Mohammadi and Moradi Neurodevelopmental and Neurodegenerative Disorders
(2021) hypothesized that more severe depressive symptoms
are associated with lower connectivity across different brain
There are also reasons to suspect a reduction in EEG com-
regions, in turn giving rise to greater randomness in brain ac-
plexity in autistic spectrum disorder (ASD), a disorder char-
tivity. Nevertheless, the attempts to explain conflicting find-
acterized by a repertoire of unvaried behaviours, stereotyped
ings in the complexity literature do not sufficiently account
thoughts, and interests. Initial evidence for this comes from
for factors like symptomatology and severity, which may be
investigations using MMSE, which was found to be reduced
critical in understanding the discrepancies.
in adults with ASD during a mental task (Catarino et al.,
These contradictory findings have also been observed in 2011), and in infants at high risk of developing ASD during
other mood and anxiety disorders which have received sig- resting state EEG (Bosl et al., 2011) as compared to con-
nificantly less attention in the field of EEG complexity. For trol subjects. MSE was also able to discriminate mild from
instance, under resting state, generalized anxiety disorder severe ASD, with the latter displaying lower entropy levels8 ZEN J. LAU1, * , TAM PHAM1, * , S.H. ANNABEL CHEN1, 2, 3, 4 , & DOMINIQUE MAKOWSKI1
(Hadoush et al., 2019). Recently, Kang et al. (2019) demon- plexity in dementia have not been conducted since nearly 2
strated diminished patterns of several entropy measures (see decades ago (Jeong, 2002). Nevertheless, the literature on
Table 3) in frontal, temporal, and central regions in ASD Alzheimer’s Disease (AD) is significantly less equivocal than
children, pointing to possible neural underconnectivity and that of depression or schizophrenia, with most studies show-
dysfunctional integration in these areas, that has been re- ing that AD is typically associated with a loss of EEG com-
ported by other studies using EEG power spectrum and co- plexity (see Table 3). In particular, MSE has been shown
herence analyses (Coben et al., 2008; Murias et al., 2007). to be sensitive to the severity of AD symptoms (Fan et al.,
2018; Yang et al., 2013), with entropy significantly declin-
As for attention deficit hyperactivity disorder (ADHD), the ing from moderate to severe AD stages, and early-stage AD
few studies that employed complexity measures show that being nearly indistinguishable from healthy controls (Fan et
children with ADHD exhibit lower EEG entropy (see Ta- al., 2018). These complexity decrements may suggest infor-
ble 3) during resting relative to healthy controls (H. Chen mation processing deficits and/or diminished brain dynamics
et al., 2019; Khoshnoud et al., 2018), with some disagree- in response to external stimuli (Pritchard et al., 1991). Some
ments regarding which regions of the brain elicit the greatest possible candidate explanations also include neuronal death
differences (ApEn in frontal regions, Fernandez et al., 2009; and a loss of functional connectivity (Abasolo et al., 2006).
Khoshnoud et al., 2018; Sohn et al., 2010; vs. ApEn and Sam- Although the precise mechanism underlying complexity re-
pEn in occipital regions, H. Chen et al., 2019). Other indices ductions remains contentious, more insights may be obtained
like LZC (Fernandez et al., 2009) and FuzzyEn (Monge et through comparisons with other dementia pathologies such
al., 2015) are also reportedly lower in ADHD when applied as Parkinson’s Disease (associated with lower CD, Stam et
to resting-state MEG signals, but no similar results have been al., 1995) and Vascular Dementia (associated with lower L1,
found with EEG yet. In light of this, proponents have sug- Jeong et al., 2001).
gested that a deficit in the allocation of attentional resources
(i.e., poor sustained attention, Robertson et al., 1997) leads
to insufficient levels of cortical activation, subsequently re- Changes across Lifespan
sulting in diminished neural complexity (Clarke et al., 2001;
Sohn et al., 2010). However, findings are less clear when Interestingly, EEG complexity in healthy populations ap-
ADHD children are placed under conditions of various cog- pears to follow an inverse U-shaped pattern, increasing dur-
nitive tasks. It has been reported that during auditory atten- ing early years of life (MSE during auditory and visual tasks,
tional tasks, ADHD children display lower neural complexity Lippe et al., 2009), early and late adolescence (MSE in rest-
than healthy controls in right frontal regions (see Table 3) ing state, Noordt & Willoughby, 2021; and cognitive tasks,
while other studies show an opposite trend of greater com- A. McIntosh et al., 2014; A. R. McIntosh et al., 2008), adult-
plexity in ADHD groups across different brain regions dur- hood (HFD in resting-state EEG, Smits et al., 2016; Zappa-
ing visual and arithmetic processing (see Table 3). These sodi et al., 2015), and declining in old age (HFD in resting-
discrepancies may be attributed to specific task requirements state EEG, Smits et al., 2016; Zappasodi et al., 2015; MSE
and the brain region of interest (such as those responsible for in cognitive tasks, A. McIntosh et al., 2014). Results from
higher order planning vs. pure attentional deficits). Given other brain measures also echo this inverted U-shaped tra-
the heterogeneity of ADHD dysfunctions, it may be impor- jectory, such as in the connectivity of neural circuitry re-
tant to delineate between ADHD subtypes and their common sponsible for cognitive and motor functioning (Bo et al.,
co-occurring neurodevelopmental conditions. The first at- 2014). Moreover, Noordt and Willoughby (2021) recently
tempt to do so came from a recent study by Tor et al. (2021), revealed that the largest increases in neural complexity are
who found several entropy measures (including MMSE) to between late childhood and adolescence in fronto-central re-
be higher in children with conduct disorder (i.e., rule break- gions, reflecting maturational changes towards more sophis-
ing, violent and antisocial behaviour), though there seemed ticated cognitive-behavioural processes. The subsequent de-
to be little differences between the ADHD-only group and crease in neural complexity with normal ageing could be due
the group with ADHD and conduct disorder comorbidities, to a multitude of deficiencies across different levels, such
a pattern that makes it difficult to draw any clear interpre- as neurotransmission (Backman et al., 2006), and/or struc-
tations. That being said, distinguishing between different tural and functional connectivity (Grady et al., 2010). This
neurodevelopmental disorders (many of which have shared is also in agreement with Goldberger’s et al. (2002) semi-
behavioural symptoms) with complexity measures is still in nal findings demonstrating reduced fractal dynamics of heart
its beginning stages, and the mechanisms underlying any po- rate variability and gait in older adults. Although most of
tential differences in neural complexity remain unclear (H. the evidence supports the idea of an age-related complex-
Chen et al., 2019). ity loss, there are a few contradictory findings (e.g., inverse
relationship between age and SampEn, Hogan et al., 2012;
To our knowledge, comprehensive reviews on EEG com- and CD, Anokhin et al., 1996) yet to be resolved. Simi-COMPLEXITY MEASURES FOR EEG 9
lar to the state of the literature in patient populations, this complexity and report increasingly intense subjective expe-
may potentially be due to the choice of algorithm that in- riences, suggesting that these states are characterized by rich
herently presents some interpretational ambiguity (since CD conscious experiences, although these findings have mostly
and SampEn can hardly differentiate between randomness been derived from MRI (Atasoy et al., 2017) and MEG sig-
and complexity). Additionally, some evidence indicates that nals (M. M. Schartner et al., 2017).
complexity reductions in old age occur in regions underlying
cognitive abilities rather than those responsible for emotion Clinical Interventions
regulation (i.e., insula, temporal lobe); while this has been
found using resting-state fMRI signals (Dong et al., 2018), Apart from being studied as potential biomarkers for dif-
this dissociation has not yet been thoroughly investigated us- ferent pathological conditions, complexity measures may be
ing EEG complexity measures that could provide more re- important in the context of promising clinical interventions.
fined temporal information. In particular, the use of psychedelics (which has recently
faced a resurgence of interest in mental health) has been
posited to expand consciousness, with potential benefits for
Consciousness
the treatment of pathological conditions (based on the “en-
tropic brain hypothesis,” Carhart-Harris, 2018). In the case
Finally, one of the most popular applications of complex- of psychopathological disorders such as depression, more
ity science is in quantifying human awareness and con- complex states are thought to facilitate psychological insight
sciousness levels, and in particular, on how normal waking in terms of ideas, emotions, and behaviours. Increasing
consciousness differs from states of reduced consciousness brain entropy would thus be expected to lead to meaning-
(Carhart-Harris et al., 2014; Seth et al., 2011), with a gen- ful and long-lasting changes in perspective and behaviours
eral consensus that the latter displays lower neural complex- (Carbonaro et al., 2018; Carhart-Harris, 2018). In addition,
ity. Several consciousness theories converge on the idea that the treatment of consciousness disorders may also be possi-
complex neuronal interactions occur when receiving multi- ble by enhancing levels of consciousness with psychedelics
ple rich sensory signals in alert states (Miller, 2015) and that (Carhart-Harris, 2018). In light of this literature, complex-
these brain activities become less complex and more periodic ity science could provide a framework to shape and validate
at reduced consciousness (e.g., greater sleep depth) due to experimental paradigms and clinical interventions for a wide
the lower need for information processing (Hou et al., 2021). range of conditions.
For instance, several studies that used EEG complexity agree
that levels of complexity are higher during wake and REM
(rapid eye movement) sleep, but lower during deep sleep Discussion
(i.e., slow wave sleep) using various complexity measures
(see Table 4). The particular exception of REM sleep has Taken together, researchers need to exercise caution in inter-
been attributed to its association with dreaming which tends preting the direction of change in these metrics and what it
to be characterized by vivid phenomenological experiences means in terms of the health status of a physiological system.
(Mateos et al., 2018). Apart from sleep stages (for a com- Given that an ideal biological system is assumed to convey a
prehensive review, see Ma et al., 2018), there is also con- rich amount of information, both extremely ordered outputs
vincing evidence showing reduced EEG complexity in other (i.e., repetitive, stereotyped behaviours, perseveration etc.)
states of relative “loss” of consciousness (see Table 4), in- and random-like variability (i.e., impulsivity, irrational be-
cluding anesthetized states (M. Schartner et al., 2015; Zhang haviours, confabulation etc.) are undesirable (Torre-Luque
et al., 2001), seizures (Kannathal et al., 2005; Krystal et al., et al., 2016; Yang & Tsai, 2013). With regards to the lat-
1996) and disorders of consciousness (i.e., vegetative and ter, increases in complexity values may be wrongly misun-
minimally conscious states, see Perturbational Complexity derstood as enhanced complexity in the system when in fact
Index - PCI, Casali et al., 2013). the nature of the system is random. For distinguishing true
dynamical complexity from randomness, MSE and DFA ex-
More recently, researchers have attempted to understand the ponents, which can account for the scale-invariant nature of
other end of the consciousness spectrum - “expanded con- physiological signals (i.e., similar properties at different time
sciousness” - states that include REM sleep, psychedelic scales), may be more sensitive relative to other measures
states, and onset phases for psychosis (based on a modern (Bornas, 2017). For instance, with MSE, randomness can be
perspective of neuroscience and pharmacology, see Carhart- identified when high entropy at short time scales decreases at
Harris et al., 2014; Carhart-Harris, 2018), that are said larger time scales (Ma et al., 2018). Torre-Luque et al. (2016)
to be more complex than normal waking consciousness. elegantly proposed that rather than considering the absolute
Some preliminary evidence demonstrates that subjects un- increase or decrease in complexity, deviations from optimum
der psychedelic-induced states have elevated levels of neural variability (Bornas & Torre-Luque, 2016; Guastello, 2015;10 ZEN J. LAU1, * , TAM PHAM1, * , S.H. ANNABEL CHEN1, 2, 3, 4 , & DOMINIQUE MAKOWSKI1
Schuldberg, 2015) may provide greater insights for clinical as ApEn and SampEn are among the most common indices,
applications. However, the notion of an “optimally vari- their sensitivity to the selection of computational parameters
able” system is still relatively unexplored in existing liter- have prompted development of more robust approaches, such
ature. Moving forward, the utility of complexity metrics as as FuzzyEn, which uses a fuzzy function instead of a single
biomarkers of disease may be reinforced through identifying value of parameter, as well as entropy profiling where vari-
ranges normal and abnormal (i.e., normative data) of com- ations of parameter values are used to capture the complete
plexity values unique to each pathological condition. profile of entropy (Karmakar et al., 2020; Udhayakumar et
al., 2017). Note, however, that entropy profiling has not yet
To aid researchers in selecting a suitable EEG complexity been investigated in the context of EEG signals.
measure, many studies have employed machine learning al-
gorithms to assess the predictive power of each measure at With the constant introduction of new complexity estimators
classifying different psychopathological disorders or states. (Tripathy et al., 2017) and modified versions of existing ones
These studies have been conducted in schizophrenia (Akar (Bai et al., 2015), it has become increasingly difficult for re-
et al., 2016; Sabeti et al., 2009), depression (Aguiar Neto searchers to choose an optimal measure specific to the psy-
& Rosa, 2019; Bachmann et al., 2017; Bornas, 2017; Cai chological state of interest. It may seem convenient to use
et al., 2016; Hosseinifard et al., 2013), ASD (Bosl et al., a wide range of them, but this is a practice fraught with is-
2011), AD (Fan et al., 2018), ADHD (Boroujeni et al., 2019; sues such as results fishing, cherry-picking, and biased in-
Ghassemi et al., 2012), as well as in healthy and pathological terpretations. By enhancing the ease for researchers in nav-
ageing (Smits et al., 2016). However, the generalizability of igating the plethora of complexity measures and clarifying
the findings beyond the scope of their comparison is hard to their underlying theoretical meanings and their differences,
assess, and inferences about the general utility of any given we hope to facilitate new developments in the field. Apart
index should be avoided. from the inexplicit boundaries between measures of random-
ness and meaningful complexity, rigorous investigations that
Other crucial considerations when choosing a complexity consider key factors such as experimental task demands and
metric include the length of the time series and the signal- symptom trajectories, are important for well-grounded con-
to-noise ratio (Bravi et al., 2011). For instance, it may be clusions to be made about neural complexity. In summary, as
difficult to achieve reliable complexity estimates with CD witnessed by the recent rise in related publications, the com-
and L1 due to their underlying assumptions of noise-free and plexity analysis of EEG signals offers encouraging prospects
lengthy data (for reconstructing the phase-space), as these for both research and clinical developments that are promis-
assumptions are not realistic in clinical applications. On the ing for furthering our understanding of normal and abnormal
other hand, LZC may be more robust for short and noisy data neurophysiological functioning.
(Fernandez et al., 2013). As for HFD, while it has been said
to be more accurate for measuring fractal dimension as com-
pared to other algorithms and is computationally simpler and Funding
faster, its values may be positively skewed by the amount of
noise in data (Fernandez et al., 2013). In fact, LZC and HFD The authors did not receive support from any organization
have been frequently used as measures of anesthesia and se- for the submitted work.
dation depth due to their reliability in assessing short data
segments, thus making it appropriate for real-time monitor- Author Contributions
ing of patient outcomes (Ferenets et al., 2006; Zhang et al.,
2001). In general, researchers should report the length of the D.M. conceived the study. Z.J.L. and T.P. coordinated the
recordings, as well as the sampling rate (both of which deter- study and drafted the manuscript. D.M. and S.H.A.C. per-
mine the number of data points) to facilitate reproducibility formed a critical review of the manuscript. All authors have
and comparisons of complexity analyses. read and agreed to the published version of the manuscript.
Regarding entropy measures, it is important to note that
ApEn and SampEn (which are essentially irregularity statis- Conflict of Interest Statement
tics) have been criticized to be unreflective of a system’s
complexity. Although MSE was proposed to address this spe- The authors declare that the research was conducted in the
cific limitation (Costa et al., 2002), it requires a substantially absence of any commercial or financial relationships that
longer time series to be accurate. Instead, other versions could be construed as a potential conflict of interest.
of MSE (e.g., MMSE) have been proposed to better work
with short-term signals (Karmakar et al., 2020), but their Acknowledgements
performances have not yet been established with physiolog-
ical signals. Additionally, while entropy-based indices such We would like to acknowledge Udo of Aachen.COMPLEXITY MEASURES FOR EEG 11
References of schizophrenia patients’ EEG in emotional
states. IRBM, 36(4), 250–258.
Abasolo, D., Hornero, R., Gomez, C., Garcia,
Akar, S. A., Kara, S., Latifoglu, F., & Bilgic, V.
M., & Lopez, M. (2006). Analysis of EEG
(2015b). Investigation of the noise effect on
background activity in alzheimer’s disease pa-
fractal dimension of EEG in schizophrenia pa-
tients with lempel–ziv complexity and central
tients using wavelet and SSA-based approaches.
tendency measure. Medical Engineering &
Biomedical Signal Processing and Control, 18,
Physics, 28(4), 315–322.
42–48.
Accardo, A., Affinito, M., Carrozzi, M., & Bouquet,
Akar, S. A., Kara, S., Latifoglu, F., & Bilgic,
F. (1997). Use of the fractal dimension for the
V. (2016). Analysis of the complexity mea-
analysis of electroencephalographic time series.
sures in the EEG of schizophrenia patients. In-
Biological Cybernetics, 77(5), 339–350.
ternational Journal of Neural Systems, 26(02),
Acharya, R., Fujita, H., Sudarshan, V. K., Ghista, 1650008.
D. N., Lim, W. J. E., & Koh, J. E. (2015). Auto-
Al-Angari, H. M., & Sahakian, A. V. (2007). Use
mated prediction of sudden cardiac death risk
of sample entropy approach to study heart rate
using kolmogorov complexity and recurrence
variability in obstructive sleep apnea syndrome.
quantification analysis features extracted from
IEEE Transactions on Biomedical Engineering,
HRV signals. 2015 IEEE International Confer-
54(10), 1900–1904.
ence on Systems, Man, and Cybernetics, 1110–
1115. An der Heiden, U. (2006). Schizophrenia as a dy-
namical disease. Pharmacopsychiatry, 39(S 1),
Aftanas, L. I., Lotova, N. V., Koshkarov, V. I.,
36–42.
Pokrovskaja, V. L., Popov, S. A., & Makhnev,
V. P. (1997). Non-linear analysis of emotion Anokhin, A. P., Birbaumer, N., Lutzenberger, W.,
EEG: Calculation of kolmogorov entropy and Nikolaev, A., & Vogel, F. (1996). Age increases
the principal lyapunov exponent. Neuroscience brain complexity. Electroencephalography and
Letters, 226(1), 13–16. Clinical Neurophysiology, 99(1), 63–68.
Aftanas, L. I., Lotova, N. V., Koshkarov, V. I., Atasoy, S., Roseman, L., Kaelen, M., Kringel-
Popov, S. A., & Makhnev, V. P. (1997). Non- bach, M. L., Deco, G., & Carhart-Harris, R.
linear forecasting measurements of the human L. (2017). Connectome-harmonic decomposi-
EEG during evoked emotions. Brain Topogra- tion of human brain activity reveals dynamical
phy, 10(2), 155–162. repertoire re-organization under LSD. Scientific
Reports, 7(1), 1–18.
Aguiar Neto, F. S. de, & Rosa, J. L. G. (2019). De-
pression biomarkers using non-invasive EEG: Azami, H., Abasolo, D., Simons, S., & Escudero, J.
A review. Neuroscience & Biobehavioral Re- (2017). Univariate and multivariate generalized
views, 105, 83–93. multiscale entropy to characterise EEG signals
in alzheimer’s disease. Entropy, 19(1), 31.
Ahmed, M. U., & Mandic, D. P. (2011). Multi-
variate multiscale entropy analysis. IEEE Sig- Aziz, W., & Arif, M. (2005). Multiscale permuta-
nal Processing Letters, 19(2), 91–94. tion entropy of physiological time series. 2005
Pakistan Section Multitopic Conference, 1–6.
Aiordachioaie, D., & Popescu, T. D. (2020). As-
pects of time series analysis with entropies and Bachmann, M., Kalev, K., Suhhova, A., Lass, J., &
complexity measures. 2020 International Sym- Hinrikus, H. (2015). Lempel ziv complexity of
posium on Electronics and Telecommunications EEG in depression. 6th European Conference
(ISETC), 1–4. of the International Federation for Medical and
Biological Engineering, 58–61.
Akar, S. A., Kara, S., Agambayev, S., & Bilgic,
V. (2015). Nonlinear analysis of EEGs of pa- Bachmann, M., Lass, J., & Hinrikus, H. (2017).
tients with major depression during different Single channel EEG analysis for detection of
emotional states. Computers in Biology and depression. Biomedical Signal Processing and
Medicine, 67, 49–60. Control, 31, 391–397.
Akar, S. A., Kara, S., Latifoglu, F., & Bilgic, Backman, L., Nyberg, L., Lindenberger, U., Li, S.-
V. (2015a). Estimation of nonlinear measures C., & Farde, L. (2006). The correlative triadYou can also read