Disaster Management Plan for Odisha - (Agriculture Sector) - Agriculture Department Government of Odisha
←
→
Page content transcription
If your browser does not render page correctly, please read the page content below
Disaster Management Plan for Odisha
          (Agriculture Sector)

        Agriculture Department
        Government of Odisha
Chapter 1
                                   Profile of the Department

        The Department of Agriculture has the mandate to plan, develop, utilize and manage
State’s resources efficiently and effectively for fostering a developing/ developed environment
for the farm and the farm entrepreneur with the objective of enhance farm income and ensure
food security to all. To achieve this objective, the Department formulates Agriculture Policies &
Plans and undertakes implementation, monitoring of agricultural projects through the different
directorates and its ancillary organisations.

    The Department is headed by the Principal Secretary. The functions of the Department are
carried out through following organizations /wings, public sector undertakings.

•   Directorate of Agriculture and Food Production
•   Directorate of Horticulture
•   Directorate of Soil Conservation
•   Odisha State Seeds Corporation (OSSC),
•   Odisha State Seeds and Organic Produces Certification Agency (OSSOPCA)
•   Agriculture Promotion and Investment Corporation Ltd. (APICOL)
•   Odisha Agro Industries Corporation (OAIC),
•   Odisha State Cashew Development Corporation Ltd.(OSCDC Ltd.) and
•   Institute on Management of Agricultural Extension (IMAGE)

ORGANISATIONAL SET UP
Directorate of Agriculture

       The directorate is headed by Director of Agriculture and Food production of Odisha with
headquarters at Bhubaneswar. Every district is headed by a Deputy Director of Agriculture with
supporting agriculture extension functionaries.
Table 1.1 Staff Strength under Agriculture Extension set up:

                Sl.      Name of the Post              Sanctioned
                No.                                     Strength
                1        ADA                                 2
                2        JDA                                 4
                3        DDA                                41
                4        DAO                               100
                5        EE (Agril.)                         4
                6        SMS                               264
                7        AAE                                91
                8        AAO                               902
                9        Agril. Overseer                  1568
                10       VAW                              3218

                                                1
ORGANIZATION SETUP OF AGRICULTURE DIRECTORATE

                     DIRECTOR OF AGRICULTURE &
                      FOOD PRODUCTION, ODISHA.
Agriculturist

   Addl. Director                                                Addl. Director
   Agril., (Engg.)                                               Agril. (Extn.)
                       Joint Directors of Agril.

                       1. Administration                   FA-cum-
                       2. Special Prog. & Crops            CAO
    Jt. Director       3. Farms & Seeds
   Agril.(Engg.)       4. Information
                                                                 Deputy
                                                                 Director
    Executive                                                    Ranges
    Engineer
     (Agril.)
                           Deputy Directors
                                                                 District
                        1. Plant Protection                     Agriculture
                        2. Plan                                  Officer
    Asst. Agril.        3. Extension
     Engineer                                            AAO                      SMS
                        4. Quality Control
                        5. Pulses                                 AAO
                        6. Sugarcane                            (At Block
                        7. Cotton                                Level)
                        8. Chief Statistician

     Principal                                                  Agriculture
     (RITEs)                                                     Overseer
                          District Agriculture Officer
                                                                 VAW at
                                                                  Gram-
                                                                panchayat

                                           2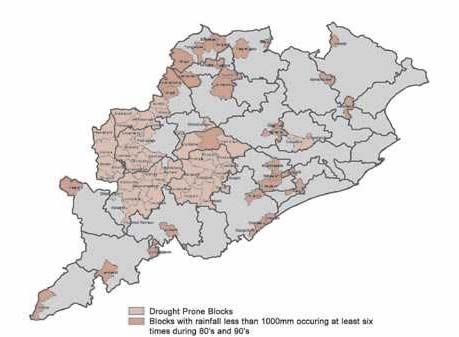
Directorate of Horticulture

        Development of Horticultural works was looked by the Directorate of Agriculture and
Food production. There by promotion & development of Horticulture crops was taken as second
priority, next to rice, pulses etc. After separation of Horticulture Directorate from DA & F.P.
vide Agriculture and Cooperation Department resolution no. 27182 AC dt.12th August’ 1987,
systematic & structured approach for Horticulture development came into being. A designated
cadre of extension personnel, though inadequate, was put in place in 1989 which was
restructured during 2012.
Table 1.2 Staffing pattern: (as on 01.04.2013):

SN.   Name of the post                        Sanctioned strength   In Position     Vacancy
1     Director of Horticulture                         1                  1             0
2     Addl. Director of Horticulture                    1                 -             1
3     Joint Director of Horticulture                   2                  1             1
4     Deputy Director of Horticulture                  23                 -            23
5     Assistant Director of Horticulture               63                 -            63
6     Assistant Horticulture Officer                  314               255            59
7     Horticulture Overseer                          300                270            30
8     Horticulture Extension worker                   794               392           402
9     Gardener                                       731                394           337
10    Attendant                                      230                 70           160
      Total                                          2459              1383          1076

                      DIRECTOR OF HORTICULTURE, ODISHA.
  Agriculturist

       School of               Addl. Director Horticulture
      Horticulture
                                                                     Accounts Officer
                               Joint. Director Horticulture
       Asst. Agril.
        Engineer              Deputy Director Horticulture

                                 Asst. Horticulture Officer

                               Asst. Director Horticulture

                                  Horticulture Overseer

                                           Gardner

                                                 3
Details of infrastructure available with the department
Table 1.3 infrastructure available with Agriculture Directorate
Sl.    Particulars of the Infrastructure       Description     Remarks
 No.
1      JDA (Information)                       1 no            Has a printing press and
                                                               personnel for media
                                                               management
2      Deputy Director Offices                 31 nos.
3      District agriculture offices            97 nos.
4      Executive Engineer’s offices            3 nos.
5      Asst. Agriculture Engineer’s Offices    30 nos.
6      FIAC buildings without godowns          100 nos.
7      FIAC buildings with godowns             100 nos.
8      Sadar Godowns at Dist. Level.           40 nos.
9      Input godowns at each block level       314 nos.
10     Training Halls                          100 nos
11     AAO Offices                             628 nos.
12     Departmental farms                      62 nos
           i) Godowns                          102 nos
           ii) Seed Processing plants          33 nos
           iii) Farm equipments.               850 nos.
           iv) Lift irrigation points.         35 nos.
           v) Farm Office & staff quarters.
           vi) Live stock                      32 nos.
           vii) Threshing floor                72 nos.
           viii) Cultivated land               1492 hect
           ix) Boundary Wall
13     Soil, Seed, Fertiliser & pesticide      26 nos.         Used for soil testing and quality
       testing laboratories,                                   control mechanisms.
14     Bio-control Laboratories/               8 nos.
       Field stations.
15     Regional Institute for Training on      5 nos.
       Extension, MIWUE & IMAGE
16     OFMRDC,                                 1 no.
17     Plant protection equipments                             Available at district and block
                                                               level
18     Govt. Vehicles
19     Staff Quarters.                                         Mostly under RD Deptt.
       Others

         These infrastructure available are prone to flood and cyclone to a lesser extent. However,
all the districts have some infrastructure those will be used as launching pads for taking up
mitigation measures for resuming agricultural activities.

                                                 4
Horticulture
        The Directorate has the following institutions for the development of Horticultural sector
in the state.

       Table 1.4: Infrastructure available with horticulture directorate

       Sl. No    Name of the institution                                   Nos
       1         Directorate (State level)                                 1
       2         Dy. Director of Horticulture (District level)             19
       3         Assistant Director of Horticulture (District level)       11
       4         Assistant Director of Horticulture (Sub Division level)   29
       5         Assistant Horticulture Officer (Block)                    314
       6         Training Institutes                                       3
       7         Farms                                                     85
       8         Nurseries                                                 154

       The Directorate of Horticulture has 85 departmental farms over an area of 1913.08 ha
covering orchard area of 1052.24 ha and 154 transit nurseries engaged for production of quality
planting materials and demonstration of technologies. The farms and nurseries have the
following mother plants.

       Table 1.5 Details of Plantations available with Horticulture Directorate

       Crop                     No. of mother       Crop                     No. of mother
                                    plants                                       plants
       Mango                           90253        K.Lime                        2252
       Litchi                           4260        Cashew                        8509
       Guava                           12347        Arecanut                     13048
       Sapota                           1992        Ber                            168
       Orange                           1870        Jack fruit                      60
       Bael                              629        Others                        2794
       Coconut                         13929        Total                      152111

       The farms also have infrastructures such as fencing, office, godown, working shed, water
source, electricity connectivity, tractor and farm implements.

                                                5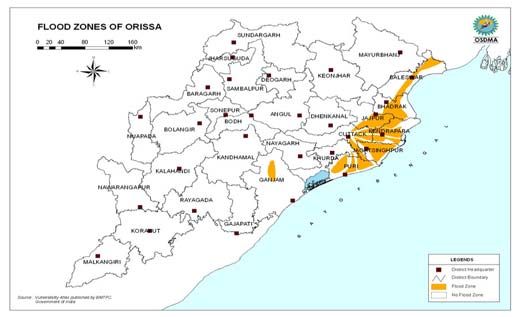
Chapter 2

        A profile of agriculture in the state and its vulnerability to Natural Distasters

        Agriculture in Odisha is the mainstay of majority of the populace and thus, holds the key
to socio-economic development of the State. The State has cultivated area of 61.80 lakh hectares
out of which 29.14 lakh hectares is high land, 17.55 lakh hectares medium land and 15.11 lakh
hectares low land. The State is broadly divided in to 4 Physiographic zones those are further
subdivided into 10 agro-climatic zones. Further, about 4 lakh hectares is exposed to saline
inundation, 3.54 lakh hectares to flooding and 0.75 lakh hectares to water-logging, particularly in
the deltaic areas. With more than 2/3rd of crops grown rainfed, a good harvest is much dependent
on a favourable monsoon.

        States climate is tropical, characterised by high temperature, high humidity, medium to
high rainfall and short and mild winters. The normal rainfall of the State is 1451.2 mm. The
actual rainfall received, vary from district to district. About 84% of rainfall is received during the
period from June to September. Even though the quantum of rainfall is quite high, its distribution
during the monsoon period is highly uneven and erratic. As a result, flood, drought and cyclone
visit regularly with varying intensity. The frequent occurrence of these natural calamities badly
affects the production of kharif rice, the major crop of the State. Similarly, in drought years,
there is considerable loss in production of pulses and oilseeds both during kharif and rabi. These,
stand as stumbling blocks in the way of enhancing crop production and productivity.

Crop Production

        Kharif is the main cropping season and rice is the principal crop being cultivated in
around 2/3rd of the cropped area in the season. Cropping during rabi season is mainly confined
to irrigated areas and areas with residual moisture. Other important crops grown in the state are
pulses (arhar, moong, biri, kulthi), oilseeds (groundnut, sesamum, mustard, niger), fibers (jute,
mesta, cotton), sugarcane, vegetables and spices.

                                                  6
Kharif Cropping Season                                    Rabi Cropping Season

        Among the seasons, Rice dominates the cropped area during Kharif and Pulses clearly
dominates occupying almost half the cropped area during rabi season. Besides oilseeds,
vegetables, fibres, maize and ragi cover a predominant part. Other crops constitute sugarcane,
spices and minor millets.

        Horticulture sector encompasses a wide range of crops namely fruit crops, vegetables
crops, potato and tuber crops, ornamental crops, medicinal and aromatic crops, spices, and
plantation crops. New introductions such as mushroom, bamboo, and bee keeping have been
accepted for improving the crop productivity, which has further expanded the scope of
horticulture. The agro-climatic diversity in the state with its high rain fall distributed over a four-
month monsoon season and a reasonably moderate winter allows for growing a variety of
horticultural crops. The agro-climatic conditions are immensely suitable for perennial fruit crops
like mango, litchi, guava, oranges and limes; annual fruit crops like banana, pineapple and
papaya; spices like ginger, turmeric, chilli, a variety of root and tubers and a whole range of
vegetables. The low-temperature in hilly areas at higher altitude offer ideal conditions for
growing off-season vegetables. Of late floriculture is also showing excellent prospects. The state
thus enjoys a natural comparative advantage for horticulture with possibilities for growing a
diversified basket of fruits, vegetables, spices, tubers and flowers.
        Focused attention in the planning process resulted in increase in area and productivity and
resultantly, in production of horticulture crops. Due to the effort made for horticulture
Development, the concept of hit-tech and commercial horticulture has reached the small and
marginal farmers’ level. It is a fact that horticulture & plantation sector has provided
opportunities of crop diversification, resulting into increased income from the land and also the
nutritional security.
            Table 2.1. Area of Horticulture Crops in ‘000 ha
Year        Fruits Vegetables Floriculture         Spices    Coconut      Cashew       Oil palm
2003-04     227.2     628.6       0.28              170.7     50.438
2004-05     233.4     629.4       0.31              171.5     50.784
2005-06     237.5     629.8       0.59              171.8     50.841
2006-07     255.6    631.62       1.08              174.5     51.035                      300
2007-08     265.2     632.0        2.4              175.1     51.598                     1300
2008-09     289.6     675.9        3.7              147.3     52.219                     2138
                                                  7
Year Fruits Vegetables Floriculture Spices Coconut Cashew Oil palm
2009-10 302.06 694.18 7.1 147.79 52.493 2138
2010-11 318.7 698.6 7.3 154.4 53.09 148.31 5138
2011-12 326.9 690.07 7.54 154.94 53.94 150.31 9438
2012-13
Vulnerability of agriculture to natural disasters
Agriculture in the state being predominantly rainfed is most vulnerable to vagaries of
monsoon. Out of 52 years only 13 years have been normal years (Table 2.1). This almost puts the
state with a 75% probability of being visited by natural calamity of any kind.
Table 2.2: History of natural calamities in the State affecting crop production
Sl. Year Normal Actual Kharif Remarks
No. Rainfall rainfall Rice
mms mms Production
(lakh MT)
1. 1961 1502.5 1262.8 36.99
2. 1962 1502.5 1169.9 36.32
3. 1963 1502.5 1467.0 42.47
4. 1964 1502.5 1414.1 43.59
5. 1965 1502.5 997.1 31.89 Severe drought
6. 1966 1502.5 1134.9 35.37 Drought
7. 1967 1502.5 1326.7 34.43 Cyclone & Flood
8. 1968 1502.5 1296.1 38.48 Cyclone & Flood
9. 1969 1502.5 1802.1 38.39 Flood
10 1970 1502.5 1660.2 39.13 Flood
11. 1971 1502.5 1791.5 33.76 Flood, Severe Cyclone
12. 1972 1502.5 1177.1 37.35 Drought, flood
13. 1973 1502.5 1360.1 41.91 Flood
8Sl. Year Normal Actual Kharif Remarks
No. Rainfall rainfall Rice
mms mms Production
(lakh MT)
14. 1974 1502.5 951.2 29.67 Flood, severe drought
15. 1975 1502.5 1325.6 42.74 Flood
16. 1976 1502.5 1012.5 29.58 Severe drought
17. 1977 1502.5 1326.9 40.50 Flood
18. 1978 1502.5 1261.3 41.89 Tornados, hail storm
19. 1979 1502.5 950.7 27.34 Severe drought
20. 1980 1502.5 1321.7 40.31 Flood, drought
21. 1981 1502.5 1187.4 36.63 Flood, drought, Tornado
22. 1982 1502.5 1179.9 27.07 High flood, drought, cyclone
23. 1983 1502.5 1374.1 47.63
24. 1984 1502.5 1302.8 38.50 Drought
25. 1985 1502.5 1606.8 48.80 Flood
26. 1986 1502.5 1566.1 44.56
27. 1987 1502.5 1040.8 31.03 Severe drought
28. 1988 1502.5 1270.5 48.96
29. 1989 1502.5 1283.9 58.40
30. 1990 1502.5 1865.8 48.42 Flood
31. 1991 1502.5 1465.7 60.30
32. 1992 1502.5 1344.1 49.76 Flood, drought
33. 1993 1502.5 1421.6 61.02
34. 1994 1502.5 1700.2 58.31
35. 1995 1502.5 1588.0 56.48
36. 1996 1502.5 990.1 38.27 Severe drought
37. 1997 1502.5 1493.0 57.51
38. 1998 1502.5 1277.5 48.85 Severe drought
39. 1999 1502.5 1435.7 42.75 Severe Cyclone
40. 2000 1502.5 1035.1 41.72 Drought & Flood
41. 2001 1482.2 1616.2 65.71 Flood
42. 2002 1482.2 1007.8 28.26 Severe drought
43. 2003 1482.2 1663.5 61.99 Flood
44. 2004 1482.2 1273.6 58.84 Moisture stress
45. 2005 1451.2 1519.5 62.49 Moisture stress
46. 2006 1451.2 1682.8 61.96 Moisture stress/Flood
47. 2007 1451.2 1591.5 68.26 Flood
48. 2008 1451.2 1523.6 60.92 Flood , Moisture Stress
49. 2009 1451.2 1362.6 62.93 Flood/ Moisture stress/ Pest attack.
50. 2010 1451.2 1293.0 60.51 Drought/ Un-seasonal rain
51. 2011 1451.2 1327.8 51.27 Flood/ Drought
52. 2012 1451.2 1391.3 86.81 Drought in Balasore, Bhadrak,
Mayurbhanj & Nuapada districts
(Source: Status of Agriculture in Odisha, Directorate of Agriculture, Odisha)
9The Directorate of Horticulture (DoH) has been involved in the plantation of different
fruit corps, cultivation of vegetables, spices, root & tuber crops, plantation crops etc. All these
activities are partially / fully depend upon the nature like monsoon, temperature, wind etc.
Hence, all the natural calamities like flood, drought, cyclone, fire, hail stone, disease, insect &
pest, earth quake, tsunami and chemical poisoning affect these activities.
Table 2.3 Hazard wise vulnerability of horticultural crops to various hazards to which the
department/state is prone to;
Nature of Vulnerable Stimulus Out come
hazard locations
Flood Flood prone Increased 1. Crop loss especially non perennials like
areas frequency and vegetables, betel vine, spices and
intensity of ornamentals, medicinal and aromatic
rainfall crops. Fruit crops like banana, papaya
and pineapple will damage.
2. Damage of new perennial plantations.
3. Disruption to road transport affecting
transport of horticultural produces.
4. Damage to departmental buildings and
farms
5. Damage to protected structures.
Drought Southern and Less rainfall 1. Crop loss (Area)
Western and water 2. Production loss
Odisha shortage 3. Higher mortality in new plantations
Cyclone Coastal Areas Storm 1. Crop loss both perennials and non
perennials.
2. Damage to departmental buildings and
farms.
3. Damage to protected structures.
Earth quake Seismic zones Waves and 1. Damage to departmental buildings and
shock farms
2. Damage to protected structures
Heat wave Western High rise of 1. Crop loss due to flower drop
Odisha environment 2. Higher mortality in new plantations
temperature especially litchi.
Hail storm Anywhere in Falling of hails Crop loss of both perennials and non
the State perennials
Fire Anywhere in Fire caught 1. Perennial orchards during summer
the State
Tsunami Coastal belt High tides 1. Crop loss both perennials and non
perennials.
2. Damage to departmental buildings and
farms.
3. Damage to protected structures.
10Nature of Vulnerable Stimulus Out come
hazard locations
Disease Anywhere in Disease out Crop loss
the State break
Insect, pest Anywhere in Insect pest out Crop loss
the State brake
Chemical Industrial Ash pond 1. Crop loss
Poisoning areas leakage 2. Soil degradation
Industrial waste
poisoning
Flood: its’ causes
Among the natural calamities flood has been the most frequent visitor to the state. In
Odisha, the entire coastal line of 482 Km is exposed to frequent flood and water logging in most
of the years. Heavy rainfall on the hills of Odisha and Flood waters of Jharkhand and Chattisgarh
contribute to flood in coastal lines and deltaic areas of the state. High degree of siltation, soil
erosion, breaching of embankments and tidal flow of sea restricting disposal of flood water
aggravates flood. The rivers such as Mahanadi, Subarnarekha, Brahmani, Rusikulya, Vansadhara
and their tributaries flow carrying the flood water to the sea. Construction of irrigation and power
generation projects on drainage lines of rivers sometimes aggravate flood due to sudden disposal
of flood water through the river due to heavy rain fall in catchments. Apart from heavy rainfall,
cyclonic wind along with heavy rainfall and tidal flows also cause flood in coastal areas. Flood
remains for about 5-15 days in many parts of coastal belts along with damage of life and
properties and also crop fields affecting food security of the victims (Odisha Review, Mishra et
al, 2010). Thus Government takes up necessary restorative measures and creates an enabling
environment for initiating agricultural activities by the farmers.
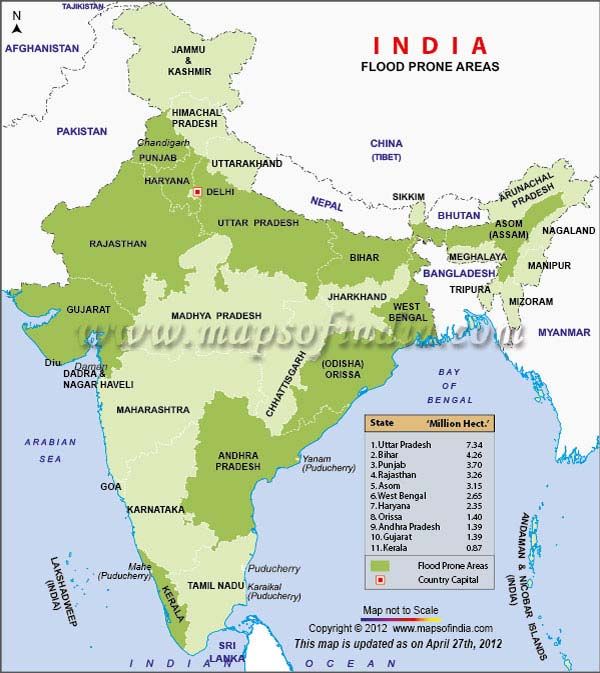
Fig: The flood map of India depict that the flood
prone areas cover almost all the districts of the
state, while the OSDMA map of Odisha shows
areas most vulnerable to flood.
11Crop damage and risk analysis
The flood causes submergence of crop plants restricting respiration and gaseous
exchange thereby ceasing all growth processes leading to death and decay. Aerobic crops cannot
resist standing water and submergence. Rice resists standing water due to supply of oxygen to
root through aerial parts but cannot tolerate submergence for more than 7days. Deep water paddy
can resist flood to the extent of 15 days when at rapid growth stages.
But at early stage of growth, sudden rise of water level, speed and muddiness of water are
the factors which makes most of the varieties susceptible to damage under submergence. Since
rice is the main crop in rainy season, the extent of damage varies according to days of
submergence depending on topography of the land (Odisha Review, Mishra et al, 2010). In
addition to that crops are also damaged due to sand cast.
Table 2.3 Year-wise statistics of damage to crops in the State from 1953 to 2011
Sl Year Damage to crops Sl Year Damage to crops
No. Area Value No. Area Value
(lakh ha) (in crore `) (lakh ha) (in crore `)
1 1953 31 1983 0.90 3.26
2 1954 32 1984 4.20 30.45
3 1955 4.10 7.88 33 1985 6.30 60.15
4 1956 0.90 2.15 34 1986 7.90 9.44
5 1957 35 1987
6 1958 0.20 0.10 36 1988 1.00 2.10
7 1959 2.00 3.24 37 1989 0.09
8 1960 5.90 20.00 38 1990 4.80
9 1961 5.10 39 1991 5.40 83.67
10 1962 Neg 0.012 40 1992 0.37 37.10
11 1963 0.90 1.00 41 1993 1.75
12 1964 1.60 2.02 42 1994 4.65
13 1965 0.30 Neg 43 1995
14 1966 0.10 Neg 44 1996 0.20
15 1967 2.70 8.75 45 1997 4.44 40.23
16 1968 3.70 8.58 46 1998
17 1969 2.80 11.02 47 1999 1.50 1.48
18 1970 3.20 12.25 48 2000
19 1971 4.70 19.57 49 2001 9.00 66.74
20 1972 12.00 30.78 50 2002
21 1973 7.20 37.98 51 2003 8.91 253.83
22 1974 1.20 0.015 52 2004 0.37 7.90
23 1975 4.20 23.21 53 2005 0.94
24 1976 Neg 0.05 54 2006 2.49
25 1977 1.90 7.51 55 2007 3.19
26 1978 3.30 11.17 56 2008 4.38 641.25
27 1979 1.80 0.50 57 2009 0.02
12Sl Year Damage to crops Sl Year Damage to crops
No. Area Value No. Area Value
(lakh ha) (in crore `) (lakh ha) (in crore `)
28 1980 3.60 40.48 58 2010 0.34
29 1981 0.40 0.06 59 2011 5.17
30 1982 12.00 Neg.
Average 3.28 31.62
Maximum 12.00 641.25
(Year) (1982) (2008)
(Source:State wise flood damage statistics, Flood Forecast Monitoring Directorate, Central Water Commission, GoI, 27 Nov’2012)
The flood can be classified as Early Season Flood, Mid-Season Flood and Late-Season
Flood depending upon its time of occurrence in June-July, August- September and October-
November, respectively.
Early season flood
June is the beginning of planting season in Odisha for all major crops. Before the onset of
monsoon, the farmers quickly sow the lowland and some medium land paddy which germinates
after onset of Monsoon and grows to a certain height to resist standing water in July and August.
After onset of Monsoon, pulses, oilseeds, and upland paddy are sown along with raising nursery
for transplanted rice for medium land. Early season flood occurring during June-July causes the
following damages –
1. Damage of paddy in nursery, standing crop of vegetables, pulses and oilseeds.
2. Early-transplanted and standing direct sown paddy is affected by flood.
Usually, in the post flood situation there is acute shortage of seed for re-sowing and
replanting operation in early season flood. Partially damaged fields often have poor plant
population and need to be made up through clonal propagation or gap filling. There are also
possibilities of pest (swarming caterpillar) and disease incidence. Shortage of agri-inputs like
seeds, fertilisers and pesticide aftermath the flood are likely on account of temporary spurt in
demand and need to be looked into.
Mid-Season flood:
When flood comes in the middle of the season during August and September, it is called
Mid Season Flood. The extent of loss in most of the times is severe and irreparable as the crops
are in active growth stage and the farmers have already spent enough money on management of
crops further, the farmers will have to lose the season of cultivation and the land cannot be put to
cultivation immediately. The Mid Season Flood puts a lot of organic matter in the field due to
decomposition of standing crop at maximum growth stage which increases fertility of the soil.
Nature of Damage
1. Incidence of pest and diseases to standing crop that escaped or resisted flood.
132. Damage of upland non paddy crops like vegetables, pulses and oilseeds at fruiting stage.
3. Damage of short duration paddy at maturity stage and medium and late duration paddy at
growth stage.
Mid season flood usually affect most of the crops at mid growth stage causing damage in
different degree depending upon submergence. Upland paddy which is at maturity stage will be
harvested from top due to standing water in field. Important pests like stem borer, gall midge,
leaf roller and grasshopper are problematic in rice crop that resist and escape flood damage.
Further, diseases like sheath rot, sheath blight, bacterial leaf blight and blast are common
diseases found in paddy crops after flood. Appropriate plant protection measures will be taken to
save the standing crop. Seed treatment and opening of drainage channel will be taken up for
growing paira crops in flood affected areas successfully. Other crops like vegetables, pulses and
oilseeds stand no chance of revival under submergence conditions and need to be re cropped.
Late-season flood
It usually occurs in post Monsoon season in October- November. The flood causes severe
damage to medium and long duration paddy at maturity and grain filling stage, respectively. The
farmers often have to bear complete loss of money invested on cropping. The winter vegetables
and non paddy crops like oilseeds and pulses grown in uplands are also seriously affected at
different growth stages.
Nature of damage
1. Lodging and Germination of grains in the field.
2. Incidence of disease and pest in crops that escaped or resisted water logging.
3. High value vegetables are also affected.
4. Grain discolouration and quality deterioration.
Late season flood causes germination of grains in standing crop of paddy. Varieties
susceptible to lodging are completely damaged. Sometimes, farmers do not go for harvesting
paddy. There is also addition of lot of organic matter due to decomposition of crop residues.
Since, the majority of low and medium lands are under paddy cultivation in kharif, farmers bear
a great loss in late season flood. Sometimes land preparation for rabi crops is delayed due to high
moisture content and none the less provide congenial conditions for harmful soil microbes to
grow.
Flood adds a lot of organic matter to field due to decomposition of residues. Further high
moisture content in soil helps in taking crops with residual moisture. The yield of crops is better
for two to three years in post flood situation. Large scale coverage of crops after flood helps in
mitigating loss due to flood. Thus, External interventions are highly essential in production
process as flood breaks the backbone of the farmers.
14Table 2.3 District wise maximum area affected over last 8 years
Sl. District Maximum Area affected by flood (in
No. ‘000 ha) (from 2001-2008)
Paddy Non-Paddy Total
1 Balasore 71.35 (2007) 6.81 (2007) 78.16
2 Bhadrak 60.62 (2003) 3.13 (2005) 63.75
3 Bolangir 22.68 (2001) 6.39 (2001) 29.07
4 Sonepur 28.53 (2001) 2.52 (2001) 31.05
5 Cuttack 80.59 (2001) 13.87 (2008) 94.46
6 Jagatsingpur 66.23 (2001) 5.30 (2001) 71.53
7 Jajpur 56.18 (2001) 7.44 (2003) 63.62
8 Kendrapara 58.39 (2001) 11.84 (2006) 70.23
9 Dhenkanal 4.69 (2001) 1.85 (2001) 6.54
10 Angul 11.10 (2001) 10.47 (2001) 21.57
11 Ganjam 56.01 (2003) 17.10 (2003) 73.11
12 Gajapati 1.14 (2003) 0.71 (2006) 1.85
13 Kalahandi 67.97 (2001) 15.25 (2001) 83.22
14 Nuapada 15.35 (2001) 0.61 (2008) 15.96
15 Keonjhar 2.09 (2003) 0.98 (2003) 3.07
16 Koraput 7.54 (2001) 7.61 (2001) 15.15
17 Malkangiri 3.85 (2006) 1.53 (2006) 5.38
18 Nawarangpur 1.93 (2006) 1.13 (2006) 3.06
19 Rayagada 2.00 (2006) 2.31 (2006) 4.31
20 Mayurbhanj 9.74 (2007) 2.58 (2007) 12.32
21 Phulbani 0.53 (2006) 0.65 (2001) 1.18
22 Boudh 4.64 (2008) 0.79 (2008) 5.43
23 Puri 87.37 (2001) 3.69 (2006) 91.06
24 Khurda 41.02 (2001) 1.96 (2006) 42.98
25 Nayagarh 9.31 (2001) 3.02 (2001) 12.33
26 Sambalpur 3.19 (2001) 0.58 (2001) 3.77
27 Bargarh 1.31 (2003) 0.86 (2003) 2.17
28 Deogarh 1.92 (2001) 0.76 (2001) 2.68
29 Jharsuguda 7.00 (2001) 1.76 (2001) 8.76
30 Sundargarh 0.80 (2001) 0.39 (2003) 1.19
Total 785.07 133.89 918.96
From the tables it can be inferred that about 9.19 lakh hectares of cropped area are
exposed to damage by flood & submergence, although there have been occasions, when about
12 lakh hectares of crop was affected. However on an average 3.28 lakh hectares of cropped area
are affected due to flood. The degree of crop damage greatly varies basing on the duration of
submergence and intensity of flood coupled with the time of occurrence and stage of the crop.
15Drought
Drought in India refers to a situation when rainfall is less than or equal to 5 mm for the
week. And agricultural drought is a period of four such consecutive weeks from mid-May to
mid-October or 6 such weeks during rest of the year. Almost every alternate year Odisha faces
some sort of drought or moisture stress like condition due to uneven and erratic distribution of
monsoon rains. The early season, mid-season and late season droughts affect crop stand and
production to different extents basing on their intensity, duration and type and stage of the crop.
ODISHA MAP SHOWING DROUGHT PRONE AREAS
(Source: Chapter -, Vulnerability Reduction for Sustainable Development:In the Context of Natural Disasters,
Odisha Human Development Report, Page-41)
Table 2.4 Frequency of meteorological drought between 1960-2003 based on departure of
actual annual rainfall (Meterological drought is an indicator of Agricultural drought)
Undivided Drought Frequency Decade-wise drought frequency
Districts between 1960-2003 (Moderate / Servere)
MOD SEVERE 1960-69 1970-79 1980-89 1990-2003
Dhenkanal 9 1 4 2 1 3
Cuttack 9 0 2 3 1 3
Puri 7 1 1 3 2 2
Balasore 11 0 3 3 5 0
Phulbani 14 1 2 6 3 3
Koraput 3 0 1 2 0 0
Kalahandi 4 2 2 1 1 2
Keonjhar 11 0 3 4 0 4
Ganjam 5 0 3 0 1 1
Mayurbhanj 7 0 2 2 1 2
Sambalpur 10 1 3 4 4 3
Sundargarh 18 2 5 4 5 5
Bolangir 16 2 2 6 6 4
16Legends: MOD= Moderate drought, SEVERE= Severe drought
(Source: Kar et al., 2004, Agro-climate & Extreme Weather Analysis for Successful Crop Production in Odisha,
Bulletin No. 22 WTCER)
Table 2.5 Probability (%) of moderate and severe drought in different undivided districts
of Odisha
Undivided Welbulls method Log Pearson distribution
Districts Mod Severe Mod Severe Drought
Drought Drought Drought
Cuttack 22.33 2.23 20.00 1.00
Puri 25.00 5.00 28.00 8.00
Balasore 26.67 2.23 22.00 1.00
Dhenkanal 26.67 4.45 30.00 8.00
Koraput 29.31 2.33 31.00 1.00
Ganjam 20.00 2.23 25.00 1.00
Phulbani 35.56 4.45 40.00 8.00
Sambalpur 33.34 4.45 38.00 7.00
Sundargarh 50.00 9.10 46.00 13.00
Mayurbhanj 20.94 2.33 23.00 1.00
Bolangir 43.20 9.10 40.00 14.00
Kalahandi 28.19 6.72 32.00 9.00
Keonjhar 28.89 4.45 30.00 7.00
(Source: Kar et al., 2004, Agro-climate & Extreme Weather Analysis for Successful Crop Production in Odisha,
Bulletin No. 22 WTCER)
Table 2.6 Crop loss during the drought year in Odisha- a case study of 2000 drought
Sl. Type of Extent Average yield Per Total yield of the Estimated Amount
No. land of land hectare (Quintal) state loss of of loss
affected Normal 2000 Normal 2000 crop yield in
(in lakh year Year (in (in lakh (in lakh Rupees
Hect.) lakh MT) MT) MT) (Crore)
1 High Land 3.48 15.16 4.72 5.28 1.64 3.64 192.92
2 Middle 5.16 2.80 10.84 12.28 5.59 6.69 354.57
Type of
land
3 Low Land 2.05 14.78 16.02 5.08 3.28 1.80 95.40
TOTAL 10.69 20.70 9.62 22.64 10.51 12.13 642.89
(46.47%) (46.42%) (53.58%)
Source : Revenue Department, Govt. of Odisha
17Table 2.7 Extent of crop damage due to drought during 2011
Districts No of PADDY
Blocks Area affected due to moisture stress (in hectares)
0-10% 11-25% 26-50% 51-75% > 75% Total
Bhadrak 1 0 0 0 0 3422 3422
Bolangir 14 5400 6720 35462 78162 9680 135424
Subarnapur 4 3530 6946 8475 22537 0 41488
Cuttack 6 2839 3709 1439 601 0 8588
Anugul 8 267 0 7790 43353 13334 64744
Ganjam 22 15880 2920 1300 0 0 20100
Kalahandi 13 10657 4247 28872 48483 5647 97906
Nuapada 5 20440 3522 5124 32784 14431 76301
Koraput 2 0 0 3089 528 0 3617
Nowrangpur 10 0 0 15360 0 8633 23993
Boudh 3 0 0 11636 11214 17647 40497
Nayagarh 8 0 4210 3930 21194 36521 65855
Bargarh 10 2440 10749 4117 42650 27182 87138
Deogarh 3 1494 1631 1653 920 0 5698
Jharsuguda 5 0 3479 0 0 0 3479
Sundargarh 5 25034 1434 0 0 0 26468
TOTAL 119 87981 49567 128247 302426 136497 704718
From the above background it is evident that out of the 2/3rd of the cultivated rainfed land
in the state almost 8-10 lakh hectares are prone to impacts of moisture stress or drought resulting
in reduction of crop yield and production.
Cyclone/ high wind
Cyclone is not preventable. However, the extent of loss and damage can be minimised
through proper planning. Planning for cyclone disaster management can be made in three stages:
pre-cyclone, during cyclone, and post-cyclone. Planning at all these stages is important. Since
the people in villages are affected persons, their involvement in the management at all three
stages is necessary.
Odisha have been a constant victim of cyclonic weather at regular intervals and the
intensity and frequency of these are on the rise very often inflicting damage to standing crop in
addition to the colossal loss of life and properties.
18Table 2.8 Major cyclones in Odisha between 1970-2003
Sl. Date Undivided districts Damage losses
No. affected
1 September 7-14, 1971 Ganjam, Puri and Considerable crop loss
Cuttack
2 September 20-25, 1971 Koraput Considerable crop loss
3 October 26-30, 1971 Crossed Odisha Coast Severe crop loss. Max. wind
near Paradip speed 150 -170 KMPH
4 September 7-14, 1972 Ganjam, Puri and Severe crop loss due to flood and
Cuttack heavy rain. Max. wind speed 175
KMPH
5 September 20-25, 1972 South Odisha Considerable crop loss. Max.
wind speed 136 KMPH
6 November 3-9, 1973 Balasore, Cuttack Considerable crop loss. Max.
wind speed 100 KMPH
7 September 14-28, 1981 Cuttack and other Considerable crop loss.
coastal as well as
interior districts
8 May 31 to June 5, 1982 Puri, Cuttack & Severe crop loss.
Balasore
9 October 9-14, 1984 Mainly Cuttack & Severe crop loss.
Balasore
10 September 17-21, 1985 Puri, Ganjam & Cuttack Severe crop loss.
11 October 13-17, 1985 Mainly Balasore Considerable crop loss.
12 October 29-30, 1999 Mainly Cuttack with all 17000 sq Km of Agriculture land
coastal districts was devastated.
19Table 2.9 District-wise impact of Super Cyclone 1999
Sl. District No. of Blocks Total Agricultural
No. affected land affected (Ha)
1 Balasore 8 138000
2 Bhadrak 7 179000
3 Cuttack 14 197000
4 Dhenkanal 8 138000
5 Jagatsinghpur 8 101000
6 Jajpur 10 176000
7 Kendrapara 9 136000
8 Keonjhar 3 125000
9 Khurda 8 80000
10 Mayurbhanj 9 221000
11 Nayagarh 2 80000
12 Puri 11 162000
Total 97 1733000
From the table it is clear about the formidable risk involved with a super cyclone
affecting as much as little more than 17 lakh hectares. Our state being a coastal district has
suffered and prone to such super calamities.
Risks involved:
1. The crops are submerged due to heavy downpours associated with a cyclonic weather
which is worsened by the impact of high wind.
2. The crops at flowering and fruiting stage are affected to a greater extent due to lodging
and shattering of pollens, many a times complete damage of the crop.
3. There is problem of sand casting in the coastal areas.
4. There is also risk of saline inundation due to sea water ingression in the coastal tracts.
5. The supporting infrastructures are likely to suffer severe damage impairing the restorative
measures.
6. The loss to life and properties are so great that the restoration of agriculture is relegated
to a lower priority.
7. The disruption of communication, power and transport is likely to delay the restorative
efforts and require large funds and co-ordination of all functionaries.
20Epidemic attack of pest and diseases
In the present times owing to demand for food, feed and fodder the farmers indulge in
and often induced to indulge in intensive agriculture in various combinations. This has led to a
situation where there are increased incidences of pest and diseases and often in epidemic form.
Conducive crop weather situation created by unsustainable anthropogenic activities coupled with
the impact of climate change triggers multiplication of the races of pests and diseases often to
epidemic scales requiring more comprehensive plant protection measures to keep things under
control. The Bengal famine during 1942 was the result of such an epidemic form of Brown Spot
of rice. Thus, disease and pest incidence have assumed greater significance in the frame work of
disaster management in the modern crop husbandry.
The pest scenario and its incidence in the State vary from crop to crop and season to
season because of erratic weather conditions. In case of paddy there was two major pests
incidence during last five years viz. Swarming caterpillar and Brown Plant Hopper which
resulted in devastation of thousands hectares of wet land paddy. Similarly there was major pest
incidence in pulses viz. Spodoptera in Black gram and YMV in Green gram resulting in huge
crop loss which may be denoted as disaster for the farmers. Further the normal pest incidence of
other crops varies from 4-10%. Conducive crop weather conditions at peak periods of activity
coupled with inappropriate plant protection measures often aggravate the pest and disease attack
inflicting irreparable damage to crops and their productivity.
Table 2.10 Major incidences of pest/ disease attack in odisha
Year Season Crop Pest Pest attack Major districts
area in ha.
2007-2008 Kharif Paddy Swarming 26374 Kalahandi, Bolangir,
caterpillar Cuttack, Koraput,
Puri, Keonjhar
2008-2009 Kharif Paddy Swarming 9270 Kalahandi, Sonepur,
caterpillar Bolangir, Nuapada,
Boudh
2008-2009 Rabi Black Cutworm 4873 Cuttack, Puri, Kendrapara,
gram Jagatsinghpur, Khurda
2009-2010 Kharif Paddy Swarming 91961 Sambalpir,
caterpillar Sundargarh,
Jharsuguda, Nuapada,
Sonepur, Deogarh,
Nawarangpur,
Malkanagiri,
Kalahandi
BPH 11098 Puri, Kalahandi
Nawarangpur
Koraput, Khurda
2010-2011 Rabi Mung YMV 15228 Bolangir, Cuttack,
21Year Season Crop Pest Pest attack Major districts
area in ha.
Puri, Ganjam,
Khurda, Angul
2011-2012 Rabi Nursery Foot rot 4702 Boudh, Sonepur
paddy Sambalpur
Black Cut worm 9190 Jajpur, Kendrapada
gram
Apart from this the endemic districts are as follows:
Pest/ Disease Endemic Districts
Swarming Caterpillar in paddy Kalahandi, Nupada, Bolangir, Sonepur, Sambalpur,
Bargarh, Deogarh, Jharsuguda, Sundergarh, Koraput,
Malkangiri, Rayagada, Nawarangpur and costal districts
like Jagatsinghpur, Puri
Brown Plant Hopper in paddy Kalahandi, Nuapada, Ganjam, Koraput and some of the
coastal districts.
Blast in paddy Cuttack, Bolangir, Ganjam, Puri
YMV in pulses Puri, Cuttack, Bolangir
Spodoptera in Blackgram Cuttack, Puri, Jagatsinghpiur, Kendrapara etc.
ESB and TSB Sugarcane Nayagarh, Dhenkanal, Jagatsinghpur, Ganjam, Bolangir and
Cuttack
The Directorate of Agriculture has already started two IPM based project namely e-Pest
Surveillance and Pest Management Programme as well as Seed Treatment Campaign in all the
Districts since 2010-11 for pest and disease control.
Table 2.11 Peak periods activity of major pests and diseases
Crop Pest/ Disease Peak activity Diposing factor/ Areas most Remarks
period Condusive prone
agroclimatic
condition
Paddy Stem Borer July-Nov & High humidity All rice Tillering &
Feb-April growing areas heading
Gall midge Aug-Oct Good rainfall in Bargarh, Tillering
May followed by Swampatna,
a dry spell Dadaraghati
22Crop Pest/ Disease Peak activity Diposing factor/ Areas most Remarks
period Condusive prone
agroclimatic
condition
Leaf- folder July-Nov & High humidity All rice Nursery to
Feb-April growing areas boot leaf
stage
BPH Oct-Nov Temp >300C, high Western Heading
humidity, Odisha
Swarming July After flash floods Western & Tillering
caterpillar Southern
Odisha
Blast July-Dec Night temp. All paddy Tillering
0
< 21 C growing areas and Panicle
Brown Spot July-Nov High humidity All rice Tillering
and temp. growing areas stage
BLB July- Nov High nitrogenous All rice Nursery &
fert. use growing areas late tillering
Sheath blight July-Sept High humidity All rice Tillering
growing areas
Sheath rot Sept-Nov High humidity All rice heading
growing areas
Tungro July-Aug Less rainfall All rice Early
growing areas tillering
Pulses Spodoptera Sept-Oct & - All Mung & Vegetative
(Kali mundi March Biri growing
Poka) areas
YMV Sept-Oct Susceptible All Mung & Vegetative
& Feb-March varieties Biri growing
(PDM 139) areas
Oilseeds Mustard Dec-Feb Cool & humid All mustard Vegetative
aphid condition growing areas to maturity
stage
Cotton Boll worms Aug-Nov High yielding & Kalahandi, Squaring to
hybrid varieties Bolangir, boll
Rayagada, development
Nuapada,
Ganjam
Mealy bug Oct-Dec Longer dry spell Kalahandi, Boll dev.,
Bolangir, Bt- cotton
Rayagada, varieties
Nuapada, highly
Ganjam susceptible
23Some general strategies adopted for Pest and Disease Control:
• Surveillance in pest prone areas.
• Monitoring the major pests like Swarming Cater Pillar, YSB, Blast , BLB of Paddy and
YMV, Cutworm in pulses and collar rot , infestation of Spodoptera in Groundnut by traps
and lures etc.
• Critical inputs provided to counter intense pest and disease attack.
• Capacity building of field functionaries and farmers on a regular basis.
• There is a need to build up season specific pest maps on endemic areas
• In case of any pest emergency (attack of major pest) coordinated efforts are put in taking
prophylactic / community pest control measures through affected farmers and the
functionaries of grass root level under the expert supervision of Specialists/Scientists of
SAUs/ ICAR institutes etc.
• Plant protection equipments are being made available to the farmers at subsidized rate to
reach a mandate of atleast 1 sprayer per 5 ha.
Toxicity/ heavy metal contamination
With the advent of a scientific revolution the sudden spurt of demand for modern gadgets
and livelihood aids has led to mushrooming of industries. As a result, the ever increasing volume
of effluents and the wastes from industries and domestic activities pollutes the water and soil
resources with toxic substances and heavy metals. The agriculture produces obtained from these
areas are contaminated. The contaminated produces fetch lesser market value and can’t stand
competition in the post WTO regime owing to stringent SPS (Sanitary and Phyto-Sanitary)
standards. Further, they threaten our well being by entering into our food chain through the
drinking water, plant and animal products we consume or even directly. And these have grave
consequences to be unfolded.
Further, the rich mineral resources in the state have attracted greater mining activities
leading to pollution of the air. That too the dusts gathering on the leaves of the plants reduce the
photosynthetic activity. All these, affect the production and productivity of crops in the vicinity
at large. Although the impact of these have not been of calamity proportions, but if these go on
unchecked the problem shall assume such proportions within a very short span of time. Would
we like to call upon another calamity knocking at the door!?
Table 2.12 Risk analysis Matrix
Agriculture
Sl Hazard/Disaster Risk Risks
No. level
1 Flood/ Heavy Rain High • Damage is caused to very large areas,
• partial or complete crop damage,
24Sl Hazard/Disaster Risk Risks
No. level
• Flood induced pest and diseases inflict further
damage,
• Sand cast and soil erosion involve greater
restoration cost,
• Irrigation resources, roads and communication
disrupted which delays the restoration process,
• The Production and productivity of crops greatly
reduced.
• Quality of produce is immensely affected too.
2 Drought/ Moisture High • Damage is caused to very large areas as 2/3rd of
stress the crop grown is rainfed and the entire state is
prone to drought,
• A larger area being covered under paddy the
damage is more since the water requirement of
the crop is relatively high compared to other
crops.
• Frequency of drought is once in every two years.
• Can occur coupled with flood and pose a heavy
demand for restoration plan.
• Production and productivity greatly reduced.
• May trigger incidence of some pests like mealy
bug resulting in further damage.
• Water availability from water resources may go
down resulting in lesser crop coverage.
3 Cyclone/ High Wind/ Modrate • Damage is caused to large areas in specific
Tornado/ tidal waves, regions of occurrence; Cyclones in coastal
Hailstorm etc To high districts mostly, Tornados and Hail storms almost
any place etc.
• Partial or complete crop damage of aged or
maturing crops due to submergence, saline
inundation, lodging of crop, shattering of flowers/
pollens/ grains.
• Frequency: Once in every 7 years
4 Pest and Diseases Low • Damage is caused specifically affected areas,
• partial or complete crop damage,
• Can be brought under control through timely
plant protection measures.
• Quality of produce is reduced.
• Production and productivity is decreased.
25Sl Hazard/Disaster Risk Risks
No. level
5 Toxicity/ pollution Low • The damage is concentrated around industrial and
mining areas mostly.
• Enhanced levels of toxic substances in the Agri-
produce reducing their quality.
• Decreased plant vigour and yield.
Horticulture
Hazard / Vulnerable Risk
Disaster locations
Flood Flood prone 1. High for non perennials like vegetables, betel vine,
areas spices and ornamentals, medicinal and aromatic crops.
Fruit crops like banana, papaya and pineapple will
damage.
2. Low for new perennial plantations.
3. Low to moderate to departmental buildings and farms
and protected structures.
Drought Southern and 1. Low to Crop (Area)and production loss
Western 2. Low to moderate in new plantations
Odisha
Cyclone Coastal Areas 1. High for both perennials and non perennials.
2. Moderate to high to departmental buildings and farms.
3. Moderate to high to protected structures in Govt and
private sector.
Earth quake Seismic zones Low
Heat wave Western Low
Odisha
Hail storm Anywhere in Low
the State
Fire Anywhere in Low
the State
Tsunami Coastal belt Low
Disease Anywhere in Low
the State
Insect, pest Anywhere in Low
the State
Chemical Industrial Low
Poisoning areas
26Capacity of the Department to deal with the Disaster
Institutional
Agriculture Directorate through its field functionaies extending upto VAW Cicle (approx
2 GPs) look into the assessment of crop loss inflicted or likely to be inflicted by any disaster and
initiate prevention/ mitigation measures at appropriate time. There are input godowns across the
entire state for storage of required agri-inputs like seed, pesticides, farm equipments etc which
could be utilized in such emergent needs. The sister organizations OSSC and OAIC are taken
help of for supply of such critical agri-inputs as restoration measures. Pre and post disaster
technical support is extended through the field functionaries by indulging in capacity building
exercises; trainings on contingent measures, repair and maintenance services of agriculture
equipments, awareness campaigns, community pest control, judicious water management etc.
Coordinative efforts are put in with allied departments, (Irrigation, Revenue, Cooperation etc) for
assessment of crop damage and taking up preventive and mitigation measures. For example -
during droughts or during cropping seasons suitable irrigation scheduling is done through
participation of all the stake holders and with due consideration of the water requirement of
crops. The functionaries of the directorate facilitate farmers and co-ordinate with financial
institutions for wider crop insurance coverage and arrangement of crop loan.
Organisational:
The organization has its functionaries working at VAW/ AO circle (consisting of approx.
2 GPs) cater to the implementation of programmes. They are responsible to give a firsthand
report of the disaster impact on its occurrence. They assess the damage and requirement of the
farmers for restoration of agricultural activities. Their work is supervised by the Asst.
Agriculture Officer(s) working at the block level. The District Agricultural officers working at
Agriculture District level monitor the steps taken up by the AAO and converge in at the District
level headed by a Deputy Director of Agriculture. The DDAs not only monitor and supervise
implementation of different programmes at district level but also day to day status of crop
weather and the preventive/restorative measures on the event of such Disaster visiting the state.
Especially, supply and distribution of the critical inputs; seeds, pesticides, fertilizers, farm
equipments are closely monitored by them.
The staff strength has been given in Organisational set up of the directorate.
Organisational communication horizontally/ vertically/ laterally is done so as to build up
an action plan with many other organizations to tackle the prevailing situation.
27The department has e-Pest Surveillance System, online Crop Weather Report System in
place which aids monitoring of such disasters on a weekly basis and taking up necessary
preventive and corrective measures.
The Fertiliser Monitoring System helps monitor supply and positioning of fertilizers at
different locations in the state.
Besides, the seed monitoring is done to constantly keep an watch over prepositioning of
quality seeds as required.
Infrastructural:
¾ All the DDA offices have been provided with FAX and e-mail facilities.
¾ The supervising officers have been provided mobility for monitoring and supervision of
different government sponsored programmes.
¾ All the districts have input godowns which are used for storing and distribution of the
critical agri-inputs and would come in handy in disaster management.
¾ Farm Information Advisory Centers have been established at block level, some of them
with input godowns will be helpful in reaching out farmers with critical inputs as would
be required.
¾ There are 8 biological control stations which are used for rearing bio-control agents used
for pest and disease control. They function as preventive centers for checking pest and
disease attack.
¾ Quality Control Labs across the state help to monitor the quality of agri-inputs in the
supply chain. The Soil Testing Laboratories help to upkeep the soil health through
fostering balanced use of fertilizers.
¾ The department has 62 Agriculture farms of which most of the farms are engaged in
quality seed production. The farms also have seed processing plants, input godowns,
threshing floors etc those may serve as important infrastructure needed for rejuvenating
agricultural activities especially aftermath of a disaster.
¾ Besides, there are 3 Regional Institutes for Training on Extension (RITEs) and 3 state
level training institutes (IMAGE, Minor Irrigation and Water Use Training Institute,
OFMRDC) which are utilized for capacity building of all stake holders. There are
training halls at block levels across the state, which are used for capacity building of field
functionaries and farmers. In addition awareness drives are taken up from time to time
through conducting group meetings and inter personal contacts to effectively overcome
the challenges posed by such disasters.
¾ The department has promoted establishment of agro service centers which can serve
important role in enabling the farmers of the region to complete agricultural operations
on time.
28¾ Establishment of Private Lift Irrigation points have been promoted to bring more areas
under assured irrigation and aid farmers in providing life saving irrigation during periods
of moisture stress.
DoH is performing plantation works which are affected by natural calamities, planting
materials and seeds of vegetables, spices and ornamental crops are being supplied at
subsidised rate as support to the farmers.
Gaps in the existing capacity
Agriculture
1. Although the existing structure extends upto VAW Circle level there exist a large number
of vacancies in almost all the cadres which is likely to impair disaster mitigation &
restoration programmes and need to be filled up soon.
Sl. Sanctioned Vacancy
Category of Post In Position
No Strength Position
1 Addl. Director of Agril. (Extn.) 1 1 0
2 Addl. Director (Engg.) 1 0 1
3 Joint Director Agril. 3 3 0
4 Joint Director (Engg.) 1 1 0
5 Dy. Director of Agril. 41 14 27
6 Executive Engineer (Agril.) 4 2 2
7 District Agril. Officer 100 0 100
8 Gr. B Agril. Officers (AAO/SMS) 1166 627 539
9 Asst. Agril. Engineer 91 86 5
10 Agril. Overseer 1568 1297 271
11 Village Agril. Worker – Regular 1205 980 225
12 Village Agril. Worker – Contractual 2013 1793 220
13 Village Agril. Worker- Total 3218 2773 445
14 Junior Engineer (Agril.) 5 3 2
2. 3016 Village Agricultural Worker Posts need to be created, so that, there shall be one
VAW per GP.
3. The Control Rooms need to be provided with fax and net connectivity so that information
could flow. The connectivity up to block level is desirable.
4. The Block level FIAC buildings have been provided which lack additional staff like
watchman and peon which need to be provided for watch and ward of the stock and store
and making these vibrant units for implementation of Agricultural programmes and
information dissemination.
5. There is still a gap in utilizing the full irrigation potential available in the state and if fully
utilized could bring even greater areas under assured irrigation.
296. There need to be enactments in place to prevent blocking natural drainages by
construction of mega structures, roads etc which always adds to the damage caused by
submergence even under heavy showers.
7. There exists a gap in technology and infrastructure to appropriately deal with the impact
disaster, which could be furthered through more of investments under these heads.
8. Mobility support should be enhanced so that the field visits by the functionaries are
sufficient to build the capacity of the farmers and take desired restorative measures.
9. Funds need to be provided for organizing capacity building exercises at state, district and
block levels on disaster management.
Name of the Programme Level Unit cost Nos Total cost
(Lakh Rs.) (Lakh Rs.)
One day seminar / workshop-cum-awareness State 2.00 2 4.00
programme
One day training programme at district level for District 1.00 30 30.00
field functionaries
One day training programme at block level for Block 0.40 314 125.60
farmers
Preparation of IEC materials and miscellaneous 2.40
expenses
Total 162.00
10. Calamity resistant storage infrastructure at vulnerable points need to be in place.
Horticulture
1. Large scale vacancy (50%) and inadequate staff position at grass root level delays the
assessment and supply of assistance also gets delayed. However assessment is being
done along with Agriculture Directorate and Revenue Department for crop loss.
2. Department personnel need to be trained regarding management of disasters
3. Adequate financial powers need to be vested in the Directorate to manage the crisis
30Chapter 3
Prevention, Mitigation and Preparedness Plan
Prevention of natural calamities is almost difficult. Prevention is often long term and
would require integrated interventions by the state or national governments. However, some
measures are taken up to reduce the impact of different disasters on agriculture.
Flood
1. Planting submergence tolerant varieties; (Swarna sub-1, Barsha Dhan, Jayanti
Dhan, IR-64 sub-1, Tulasi, Panidhan, Hanseshwari etc) of paddy in flood prone
areas.
2. Raising community nurseries in relatively higher patch of land in the
submergence/ flood prone areas and transplanting after flood water recedes.
3. Contour ploughing, contour planting etc are adopted to promote infiltration and
reduce the runoff impact.
4. Adoption of Sunken raised bed method in areas prone to regular submergence.
5. Rice –fish farming systems are adopted in some of the submergence prone areas.
6. Wrapping and propping sugarcane crop to protect them from lodging during
submergence is another important practice.
7. Construction/ restoration of check dams, embankments, field bonds/ contour
bonding before the onset of monsoon.
8. In areas with greater gradient of slope, pucca water/ drainage outlets are
constructed to protect the farm land from breaking of bonds followed by soil
erosion/ sand cast during heavy downpours.
9. Blocked Drainage channels could be opened up adequately.
10. Catchments could be treated appropriately to reduce run-off and soil erosion.
11. Long and medium term weather forecasts are desirable for reducing the impact.
12. Disaster Warning Systems could also be helpful not only to save the harvestable
standing crop but also shift harvested produce to safer places. Further, they could
be helpful in moving farm equipments and machinery to safer places in addition
to enhance the preparedness to face the calamities.
Drought
1. Agronomic packages; Summer ploughing, Conservation tillage, Cropping all the
year round, use of organic manures, green manuring, Mixed cropping/
intercropping, Crop substitution, Water harvesting, conservation and management,
31use of pressurized irrigation systems, sowing short duration and drought tolerant
varieties of crops, etc are being followed.
2. Private lift irrigation points are being established through providing assistance in
order to bring more and more areas under assured irrigation.
3. Farm ponds and dug wells are also being established to cater to the farm water
needs.
4. Pumpsets, pressurized irrigation systems (Sprinklers, Drips, Rain guns etc) are
being provided on subsidy to enable farmers for fetching the much required life
saving irrigation, especially during times of long dry spells.
5. Canals and their distributaries are being lined and Irrigation channels improved to
reduce conveyance losses.
6. Proper irrigation scheduling with appropriate crop planning taking more of low
duty crops in the rainfed high lands & drought prone areas.
7. Capacity building exercises are being organized to create awareness among the
farmers and extension functionaries in this regard.
Crop pest and diseases
1. Agronomic packages in line with integrated pest management principles; Summer
ploughing, cultivation of tolerant varieties, adoption of appropriate soil, water and
fertilizer management techniques, adjustment of showing time to avoid peak
periods of activity, Weed control, proper maintenance of drainage channels etc
2. Preventive plant protection measures; seed/seedling treatment, monitoring pest/
disease incidence through proper surveillance and keeping them under ETL
(Economic Threshold Level).
3. Plant protection in a community approach mode.
4. Strict quarantine: intra and inter regional.
5. Capacity building of functionaries and farmers on plant protection.
FLOOD PREPAREDNESS
Mostly, all the coastal districts are flood prone. In addition, the districts of Kalahandi,
Koraput, Rayagada, Sambalpur, Boudh, Subarnapur and parts of other districts are also affected
by flood.
1. Control rooms equipped with phone, FAX and Internet will function at district and state
level from beginning of the kharif season.
2. Online Crop Weather situations will be monitored and appropriate corrective/ mitigating
measures would be taken up depending on the situation thereof.
3. The extension machinery is kept in readiness with contingent plan to tackle any such
eventuality arising out of natural calamity.
32You can also read