Integrative analyses of TEDDY Omics data reveal lipid metabolism abnormalities, increased intracellular ROS and heightened inflammation prior to ...
←
→
Page content transcription
If your browser does not render page correctly, please read the page content below
Balzano-Nogueira et al. Genome Biology     (2021) 22:39
https://doi.org/10.1186/s13059-021-02262-w

 RESEARCH                                                                                                                                         Open Access

Integrative analyses of TEDDY Omics data
reveal lipid metabolism abnormalities,
increased intracellular ROS and heightened
inflammation prior to autoimmunity for
type 1 diabetes
Leandro Balzano-Nogueira1, Ricardo Ramirez1, Tatyana Zamkovaya1, Jordan Dailey1, Alexandria N. Ardissone1,
Srikar Chamala2, Joan Serrano-Quílez3, Teresa Rubio4, Michael J. Haller5, Patrick Concannon2,6, Mark A. Atkinson5,
Desmond A. Schatz5, Eric W. Triplett1 and Ana Conesa1,6*

* Correspondence: aconesa@ufl.edu
1
 Microbiology and Cell Science           Abstract
Department, Institute for Food and
Agricultural Sciences, University of     Background: The Environmental Determinants of Diabetes in the Young (TEDDY) is
Florida, Gainesville, USA                a prospective birth cohort designed to study type 1 diabetes (T1D) by following
6
 University of Florida Genetics          children with high genetic risk. An integrative multi-omics approach was used to
Institute, Gainesville, FL, USA
Full list of author information is       evaluate islet autoimmunity etiology, identify disease biomarkers, and understand
available at the end of the article      progression over time.
                                         Results: We identify a multi-omics signature that was predictive of islet autoimmunity
                                         (IA) as early as 1 year before seroconversion. At this time, abnormalities in lipid
                                         metabolism, decreased capacity for nutrient absorption, and intracellular ROS
                                         accumulation are detected in children progressing towards IA. Additionally, extracellular
                                         matrix remodeling, inflammation, cytotoxicity, angiogenesis, and increased activity of
                                         antigen-presenting cells are observed, which may contribute to beta cell destruction.
                                         Our results indicate that altered molecular homeostasis is present in IA-developing
                                         children months before the actual detection of islet autoantibodies, which opens an
                                         interesting window of opportunity for therapeutic intervention.
                                         Conclusions: The approach employed herein for assessment of the TEDDY cohort
                                         showcases the utilization of multi-omics data for the modeling of complex, multifactorial
                                         diseases, like T1D.

                                       Introduction
                                       Type 1 diabetes (T1D) manifests as a result of inappropriate activation of inflammation
                                       and the immune response against self-antigens, resulting in autoimmune destruction
                                       of pancreatic islet β cells. The onset of T1D is preceded by the appearance of islet
                                       autoantibodies against insulin (IAA), glutamic acid decarboxylase (GADA), zinc
                                       © The Author(s). 2021 Open Access This article is licensed under a Creative Commons Attribution 4.0 International License, which
                                       permits use, sharing, adaptation, distribution and reproduction in any medium or format, as long as you give appropriate credit to
                                       the original author(s) and the source, provide a link to the Creative Commons licence, and indicate if changes were made. The
                                       images or other third party material in this article are included in the article's Creative Commons licence, unless indicated otherwise
                                       in a credit line to the material. If material is not included in the article's Creative Commons licence and your intended use is not
                                       permitted by statutory regulation or exceeds the permitted use, you will need to obtain permission directly from the copyright
                                       holder. To view a copy of this licence, visit http://creativecommons.org/licenses/by/4.0/. The Creative Commons Public Domain
                                       Dedication waiver (http://creativecommons.org/publicdomain/zero/1.0/) applies to the data made available in this article, unless
                                       otherwise stated in a credit line to the data.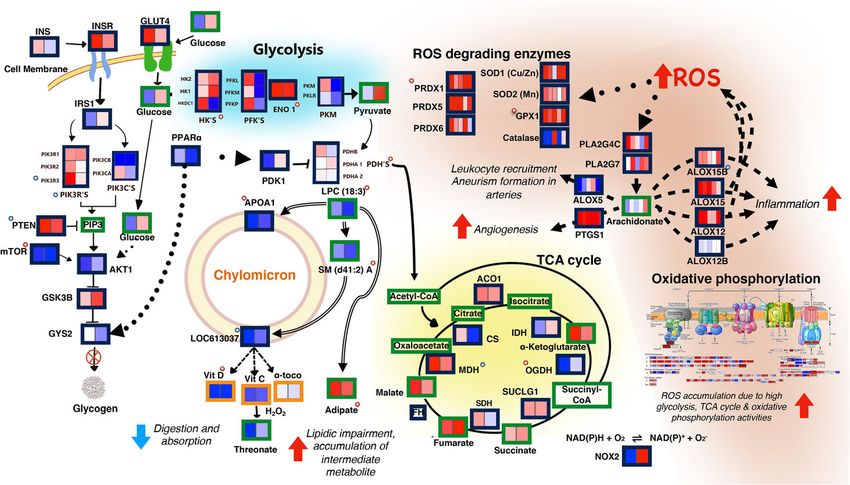
Balzano-Nogueira et al. Genome Biology   (2021) 22:39                                                          Page 2 of 27

                 transporter 8 (ZnT8A), and/or insulinoma associated antigen-2 (IA2A). The Human
                 Leukocyte Antigen (HLA) complex is the primary genetic contributor of T1D suscepti-
                 bility, with the highest risk conferred by specific allelotypes of the class II genes DQA1,
                 DQB1, and DRB1. The global incidence rate of T1D is increasing annually, with many
                 new cases appearing in western, developed countries [1]. Progression of the disease is
                 not well understood, because the death of pancreatic islet β cells, the primary pathology
                 of T1D, is inherently difficult to measure. Furthermore, the interplay between genetic
                 risk, physiological biomarkers, and environmental triggers is unclear. Multiple triggers
                 are thought to influence disease progression rates, degradation of islet β cells, and
                 ultimately, insulin dependence [2].
                    High-throughput omics approaches in human and rodent models, including genome-
                 wide association, transcriptomics, metabolomics, proteomics, and microbiome analyses,
                 have led to the discovery of features that are strongly associated with islet autoimmun-
                 ity [3–8]. Comparison of T1D-specific transcriptional signatures in blood mononuclear
                 cells to recent-onset patient cells facilitated detection of overexpressed interleukin-1
                 family members, which are involved in immunocyte chemotaxis and immune receptor
                 activity [9]. Accordingly, metabolomics studies suggest that a stress signature that im-
                 pacts levels of phospholipids, methionine, glutamate, and energy metabolites [10] is
                 present before seroconversion (SC). However, the magnitude and direction of these
                 metabolite changes are sometimes contradictory, possibly due to confounding factors
                 like age, disease severity, or demographics. While many studies have discovered key
                 biological processes that play an important role in T1D onset, these processes are rarely
                 integrated to analyze their collective role in this multifactorial disorder.
                    The Environmental Determinants of Diabetes in the Young (TEDDY) study is a pro-
                 spective study that was designed to identify T1D-associated environmental factors in
                 children carrying high genetic risk for the disease [11]. TEDDY investigators measured
                 a wide variety of environmental, demographic, and molecular factors in at-risk children
                 from birth to T1D diagnosis. An integrative approach was applied to these datasets to
                 model the relationship between disease state of subjects and their biomolecular profiles
                 across time. Ultimately, the novel, multi-omics approach employed to assess the TEDD
                 Y cohort provides new insights regarding molecular signatures that characterize T1D,
                 while informing a hypothetical model for disease progression. This model, which pro-
                 vides foundations for future studies, proposes that lipid metabolism impairment (LMI),
                 glycolysis dysregulation, and accumulation of intracellular reactive oxygen species
                 (ROS) may precede and exacerbate the autoimmune responses associated with T1D
                 progression. More importantly, our study reveals that this molecular signature can be
                 detected as early as 12 months before confirmed β cell autoimmunity, which opens an
                 exciting opportunity for early diagnosis and therapeutic intervention.

                 Results
                 Overview of the data analysis approach
                 Metabolomics, transcriptomics, and dietary biomarker data were binned in 3-month in-
                 tervals prior to seroconversion and arranged into a 3-way tensor structure where the
                 dimensions were subjects (first mode), omics features (second mode), and time (third
                 mode), with element xijk representing the value of the j omic variable in subject i at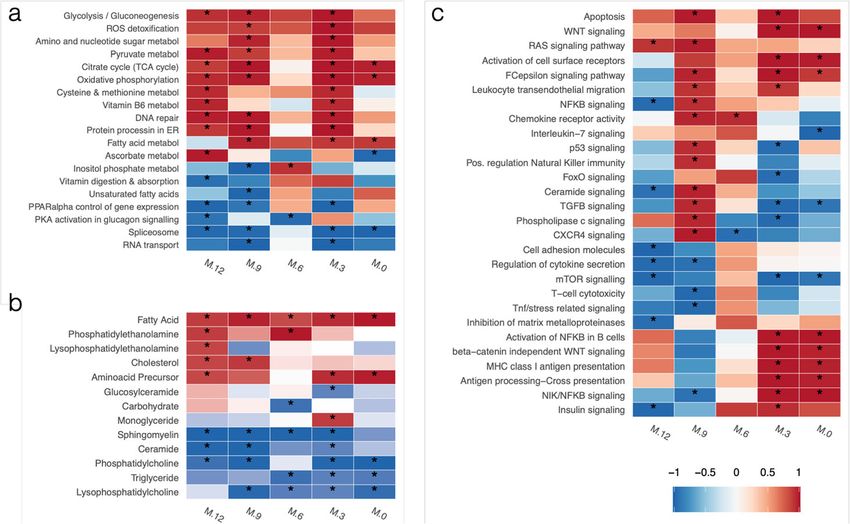
Balzano-Nogueira et al. Genome Biology         (2021) 22:39                                                                            Page 3 of 27

                 time point k (Fig. 1). Only subjects with complete case-control paired data for all
                 omics measurements in at least 3 out of 5 time points were considered. A
                 Tucker3 model-based approach was used to impute missing values within each
                 dataset (Additional file 13: Fig. S1). After within-normalization, each omics tensor
                 was analyzed by a multiblock strategy, N-way partial least squares-discriminant

                   Fig. 1 Overview of the data analysis strategy. The TEDDY case-control dataset was used. Preprocessing
                   entailed data binning, missing value imputation, and within case-control normalization. Statistical analysis
                   proceeded through NPLS-DA models on islet autoimmunity for each omics modality, selection of variables
                   using the VIP statistics, and a final multi-omics NPLS-DA model with selected variables. Integrative biological
                   interpretation used enrichment analysis to identify relevant pathways, partial correlation analysis to find novel
                   gene/metabolite relationships, and PaintOmics3 to add pathway models to multi-omics data visualization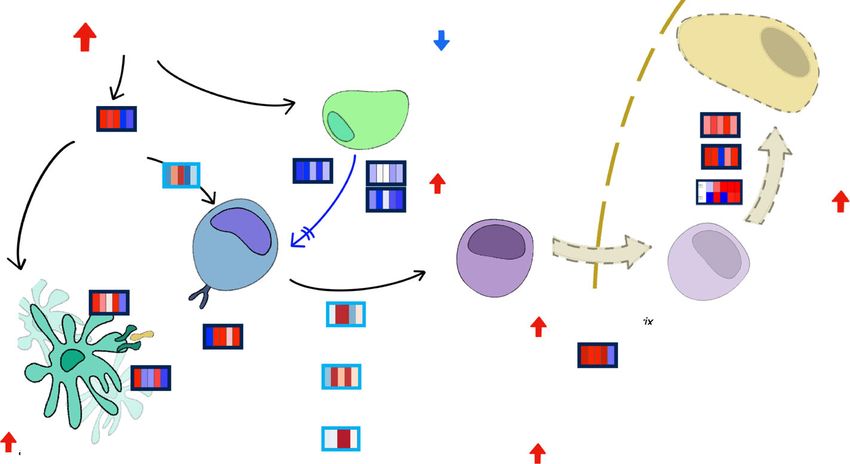
Balzano-Nogueira et al. Genome Biology   (2021) 22:39                                                               Page 4 of 27

                 analysis (NPLS-DA), using the case (confirmed autoimmunity) and control labels
                 as response variables. Features were selected by variable importance for projec-
                 tion (VIP) analyses. Selected genes, metabolites, and dietary biomarkers were
                 joined to create an integrated NPLS-DA model to assess classification power and
                 analyze the global dynamics of the multi-omics changes. Next, selected bio-
                 markers were analyzed by partial correlation to identify associations among them
                 and to create integrated metabolite/gene expression networks of disease progres-
                 sion. To aid in the interpretation of the results, enriched pathways/metabolite
                 classes were identified, and data were visualized with PaintOmics3 [12, 13], which
                 was manually edited to include associations found by partial correlation analysis.

                 Multiblock analysis of multi-omics TEDDY data predicts the onset of autoimmunity
                 Our analysis strategy requires that multi-omics data are available for both the matched
                 case-control pair at each binned time point. These resulted in the selection of 136
                 paired individuals (68 cases and 68 controls) that had complete measurements for at
                 least 3 out of 5 time points and in the overall integration 476 blood gene expression,
                 680 citrate plasma metabolomics, and 680 plasma dietary biomarker datasets. A total of
                 170 individuals, with multi-omics data in less than 3 time points, were used for model
                 validation at individual time points (Additional files 1, 2, 3, 4, 5, 6, 7, 8, 9, 10). Our final
                 dataset consisted of 48% females and 52% males; 29% Swedish, 7% German, 33% North
                 Americans, and 31% Finnish. The distribution of first-appearing autoantibody was 48%
                 IAA, 31% GADA, 17% GADA_IAA, and 4% others (Additional file 11). This subject se-
                 lection faithfully resembles the composition of the TEDDY cohort [14].
                   The NPLS-DAs calculated for transcriptomics, metabolomics, and dietary biomarkers
                 (DB) data for the TEDDY cohort resulted in models that explained between 40 and
                 94% of the autoimmunity phenotype. Some of these models were able to successfully
                 distinguish islet autoimmunity (IA) cases from controls (Additional file 13: Figs. S2-S6).
                 Feature selection by variable importance for projection (VIP) resulted in the identifica-
                 tion of 862 genes, 245 metabolites (91 from mass spectrometry, 91 negative-ion lipids,
                 and 63 positive-ion lipids), and 3 dietary biomarkers (vitamin C, vitamin D, and toc-
                 opherol) that differed in the time leading up to seroconversion (complete feature list
                 provided as Additional file 12). An integrated NPLS-DA model, which included all the
                 selected features (Fig. 2), was able to distinguish the outcome in 95.53% of subjects with
                 a predictive capability LOOCV Q2 of 0.761 (Fig. 2a). Fivefold and 10-fold cross-
                 validation strategies yield the same performance results (Additional file 13: Fig. S7).
                 The model retained most of the explained variance in the first (1,1,1) and second (2,2,
                 2) elements (Fig. 2b). The third mode revealed high absolute values 12 and 9 months
                 before seroconversion (MBSC), indicating that these time points retained most of the
                 disease-related information (Fig. 2c). Assessment of variable selection significance re-
                 vealed that, in both scenarios, the model with VIP-selected variables produced signifi-
                 cantly higher R2 and Q2 values (Fig. 2d). Evaluation on a set of independent samples
                 not used for variable selection showed that the predictive capability of the PLS-DA
                 models reached 88% at 12, and 66% at 9 MBSC (Additional file 13: Fig. S8a), and the
                 classification success was over 0.8 when 12-month samples were used to predict out-
                 come at 12 and 9 MBSC (Additional file 13: Fig. S8b).
Balzano-Nogueira et al. Genome Biology (2021) 22:39 Page 5 of 27
Fig. 2 NPLS-DA analysis of TEDDY data. a NPLS-DA model mode 1 projection with combined gene
expression, metabolites, and DBs showing separation between cases and controls. b R2, Q2, and element
values for the NPLS-DA model. Each element is a triad containing the combination of mode components
that captures the indicated explained variance. c NPLS-DA model mode 3 projection showing the relevance
of early time points in the model as they have high absolute values. d VIP variable selection-validation by
permutation analysis. For both gene expression and metabolomics datasets, the selected VIP-based features
have significantly higher R2 (circles) and Q2 (triangles) values compared to a randomly selected set of
features, (*) p < 0.001
Enrichment and partial correlation analysis of the IA progression signature
To assess the biological significance of the selected features, functional enrichment ana-
lyses for KEGG pathways and major metabolite classes were performed (Fig. 3, Add-
itional file 14). We identified a distinctive transcriptional signature, wherein metabolic
processes related to glucose utilization and energy (glycolysis, pyruvate metabolism, oxi-
dative phosphorylation, citrate cycle) were significantly upregulated across most time
points. This high-energy state was accompanied by the enrichment of ROS detoxifica-
tion and DNA repair genes, suggesting that an oxidative state resulting in cellular dam-
age is present in IA-developing children. Additionally, pathways associated with lipid
regulation, such as PPARα control of gene expression, and RNA metabolism (Spliceo-
some, RNA transport), were mostly downregulated (Fig. 3a). In parallel, the analysis of
enriched metabolic classes indicated that fatty acids, cholesterol, and phosphatidyletha-
nolamines were upregulated in IA cases, while Sphingomyelins, Phosphatidylcholines,
Triglycerides, and Ceramides were downregulated in cases at nearly all studied time
points (Fig. 3b). The upregulated metabolites are consistent with a lipid metabolismBalzano-Nogueira et al. Genome Biology (2021) 22:39 Page 6 of 27
Fig. 3 Heatmap of enriched pathways and metabolite groups before seroconversion. a KEGG metabolic
pathways. b Metabolite classes. c KEGG signaling pathways. Colors indicate mean up- (red) or down- (blue)
regulation of the pathway, while color intensity indicates significance level. For each time point, Gene Set
Enrichment Analysis of time-specific NPLS-DA VIP loadings was performed, p values for each pathway were
combined using Fisher’s method and adjusted for multiple testing. Pathway were selected for having a
combined, Fisher adjusted p value < 0.05 in at least one combination of time points
impairment landscape in IA-onset individuals, as has been reported previously [15].
Moreover, downregulation of ceramides has been associated with skin disorders like
ichthyosis and keratosis occurring in two thirds of children with T1D [16], and low
levels of sphingomyelin in pancreatic islets of NOD mice during progression to auto-
immune diabetes has also been reported [17].
A more complex regulatory pattern was observed when analyzing signaling pathways
that were enriched during the 12 months preceding seroconversion (Fig. 3c). While
some processes, such as apoptosis and RAS signaling pathway, appeared to be generally
upregulated, many pathways involved in immune system signaling and communication
were activated at 9 MBSC and either maintained activation (i.e., leukocyte transendothe-
lial migration, activation of cell surface receptors, chemokine receptor activity) or be-
came downregulated (regulation of natural killer immunity, CXCR4 signaling, TGFβ
signaling, FoxO signaling) near the time of seroconversion. Interestingly, some pathways
were constantly downregulated (mTOR signaling) or only strongly activated at 0–3
MBSC, such as antigen presentation (MHC Class I and cross-presentation), insulin sig-
naling, and activation of NFkB in β cells. This pathway activation-repression pattern
suggests a succession of signaling events that involve general cell maintenance, immun-
ity recognition, communication, and response pathways that may contribute to progres-
sion towards islet autoimmunity.
To further investigate the coordination of molecular changes occurring during auto-
immunity progression, partial correlation analysis (PCoA) networks were generated for
the transition between any two consecutive time points (Fig. 4). To capture a manage-
able set of most variable features across multiple time points, a variable shrinkage strat-
egy was applied (see “Methods”) resulting in a selection of 315 variables to be includedBalzano-Nogueira et al. Genome Biology (2021) 22:39 Page 7 of 27
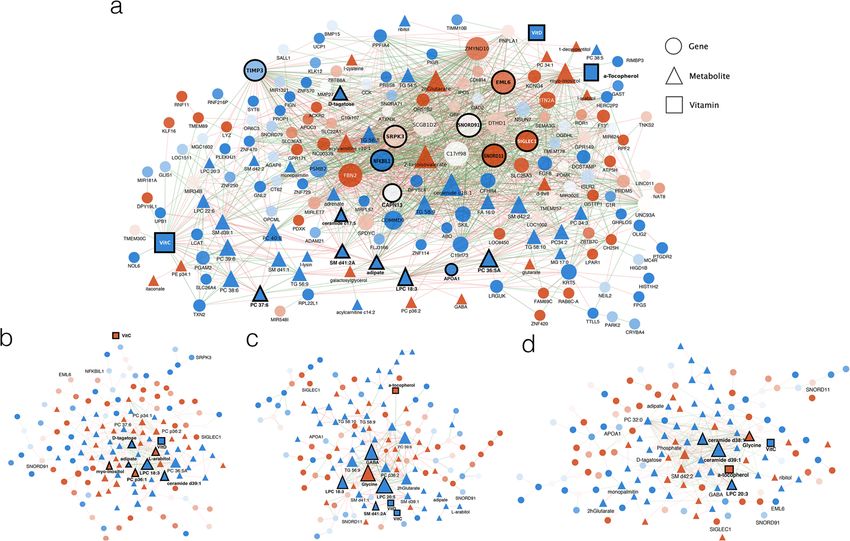
Fig. 4 Partial correlation analysis results of the autoimmunity predictive signature evaluated at different
timeframes before seroconversion. a 12–9 MBSC. b 9–6 MBSC. c 6–3 MBSC. d 3–0 MBSC. Genes,
metabolites, and vitamins are represented as circles, triangles, and squares, respectively. Node color
indicates mean up- (red) or down- (blue) regulation of the feature in cases at the first network time point.
Edges’ color indicates positive (blue) or negative (red) correlation. Only links with absolute partial correlation
values > 0.7 are represented
in the networks (Fig. 4). At earlier time points, networks were more densely connected
and had a higher representation of gene features (Fig. 4a). As time progressed towards
seroconversion, connectivity between genes decreased and more metabolites became
integrated into the networks (Fig. 4b–d). Network differences were confirmed by statis-
tical analysis of the distribution of correlation values. Kurtosis analysis indicated that
correlation values in the 12to9 network had a platykurtic distribution (kurtosis = −
0.12), indicating many extreme correlation values, while other time points had lepto-
kurtic distributions (0.24, 1.18, and 1.17 for 9to6, 6to3, and 3to0 respectively), indicat-
ing fewer high correlation values. Moreover, Kolmogorov-Smirnov tests indicated
significant differences between 12to9 and 9to6 (p value < 2.2e−16) and between 9to6
and 6to3 (p value = 0.03076) networks, while differences between 6to3 and 3to0 net-
works were not significant (p value = 0.1743). These results suggest that a coordinated
transcriptional response preceded the metabolic perturbations. These patterns are con-
sistent with our NPLS-DA results, in which the earliest time block (9–12 MBSC) pro-
vided information that best predicted the development of autoimmunity. We further
analyzed the molecular interaction network at the transition between 12 and 9 MBSC,
the period with the highest predictive value in our NPLS-DA model (Fig. 4a and Add-
itional file 13: Table S1). At 9–12 MBSC, network hubs included genes that are charac-
teristic of relevant disease processes. We found genes involved in alternative splicing
(SNORD11, SNORD91, SRPK3), a process that we previously showed to significantly
impact T1D-related genes [18]. Other hubs included genes involved in macrophage-to-
cell adhesion (EML6, SIGLEC1), regulation of extracellular metalloproteases activity
(TIMP3), and innate immune responses (NFkBIL1). Highly interconnected compoundsBalzano-Nogueira et al. Genome Biology (2021) 22:39 Page 8 of 27
included vitamin C and D, components of vesicle membranes (APOA1, SM d41:2, LPC
18:3), and intermediate metabolites (Adipate). This result agrees with the functional
classes observed in the enrichment analysis and suggests a strong interconnection
among energy synthesis, lipid metabolism, nutrient levels, cell signaling, and immune
responses in patients that eventually will progress towards autoimmunity.
Together, enrichment and partial correlation analyses reveal a coordinated metabolic
and gene expression response that involves sustained changes in energy and lipid com-
ponents and that is connected to multiple signaling mechanisms leading to immune
responses.
Analysis of the NPLS-DA model for IA progression
While the above enrichment and network analyses revealed major molecular events as-
sociated with an autoimmunity predictive signature, these results fall short of enabling
a mechanistic interpretation of the pathways to disease. We addressed this challenge by
projecting our predictive signature over the template of KEGG pathways using the
PaintOmics3 tool, which allows a joint display of gene expression and metabolomics
data. When necessary, pathways were edited and combined to include novel associa-
tions identified by our partial correlation analysis and to improve readability. The hypo-
thetical model resulting from this interpretive analysis is discussed in the following
sections.
Lipid metabolism irregularities are linked to decreased nutrient absorption, upregulation
of glycolysis, and TCA cycle activation in TEDDY IA subjects
Intestine-to-blood lipid and vitamin transport are facilitated by lipoprotein particles
known as chylomicrons [19]. A key chylomicron transmembrane protein, apolipopro-
tein A1 (APOA1), was identified in our analysis as a central model element (Fig. 5). At
9–12 MBSC, downregulation of APOA1 correlated with decreases in lysophosphatidyl-
choline LPC (18:3), sphingomyelin SM(d41:2) A, and the chylomicron transmembrane
protein LOC613037. The primary structural lipid constituents of chylomicrons—sphin-
gomyelins, phospholipids, and triglycerides—were decreased in abundance at all time
points in case versus control groups (Fig. 3b, Fig. 4). Moreover, the downregulation of
APOA1 and decrease of LPC (18:3) in cases was correlated with an increase in adipate
(Fig. 4a), a known marker of impaired β-oxidation of fatty acids [20]. Therefore, our
data suggest that the downregulation of structural lipids and chylomicron components
is highly correlated with increased adipate levels in patients progressing towards auto-
immunity. Furthermore, the low abundance of chylomicron structural lipids is associ-
ated with hydrolyzation of high-density lipoprotein (HDL) phospholipids during
inflammation, resulting in accumulation of deleterious, oxidized fatty acids and lipid
abnormalities [15]. This result may explain the link between chylomicron deficiency
and adipate levels and is consistent with the high levels of fatty acids and cholesterol
detected in IA subjects (Fig. 3b).
Vitamins C and D and α-tocopherol, nutrients transported by chylomicrons, are part
of our predictive signature, with lower levels identified in cases in comparison to con-
trols at 9–12 MBSC (Fig. 4a). Interestingly, downregulation of chylomicron constitutive
elements was associated with absorption deficiency of vitamin C and α-tocopherol inBalzano-Nogueira et al. Genome Biology (2021) 22:39 Page 9 of 27
Fig. 5 Model of metabolic processes leading to accumulation of reactive oxygen species (ROS) and
inflammation in TEDDY IA patients. Low expression of chylomicron membrane components is correlated
with secondary metabolites (adipate) and markers of impaired β-oxidation and is consistent with lower
vitamin levels and lower expression of the transcriptional regulator PPARα. Low PPARα levels may downregulate
glycogen synthesis and upregulate glycolysis. Increased glycolytic flux is liked to activation of the TCA cycle,
increased oxidative phosphorylation, and finally, to the production of ROS. ROS accumulation leads to increased
expression of ROS-scavenging enzymes and activation of prostaglandins (PLA2) and lipoxygenases (ALOX)
leading to inflammation. Continuous lines: association in KEGG; dashed lines: literature-based association;
dotted lines: transcriptional regulation; double lines: partial correlations analysis-based association; blunt ends:
negative relationship; arrowheads: positive relationship; red-background stars: VIP-selected variable; blue-
background stars: GSEA selected variable; green borders: metabolites; blue borders: genes; orange borders:
dietary biomarkers. Heatmap description: from left to right from time points 12 to 9 (2 boxes) or from 12 to 0 (5
boxes) months before seroconversion; blue: downregulation, red: upregulation in cases
NOD mice [21]. Notably, levels of threonate (Fig. 5), the major breakdown product of
vitamin C, were similar between cases and controls, suggesting that low vitamin C is
not caused by higher degradation rate, but rather, by restricted absorption. Similarly,
low levels of chylomicron components were related to vitamin D deficiency in humans
[22, 23], and low vitamin D absorption has been linked to lipid metabolism impairment
[22, 24–26]. Based on the collective evidence, we concluded that the lower vitamin
levels observed in TEDDY IA cases might be associated with a chylomicron dysfunction
leading to LMI.
Transcriptional dysregulation through low PPARα links energy imbalance, lipid
impairment, and ROS activation
Another key component of our model is the peroxisome proliferator-activated recep-
tor-α (PPARα), which displayed lower expression in cases (Fig. 5). This ubiquitous tran-
scription factor regulates fatty acid and glucose metabolism, as well as peroxisomal and
mitochondrial fatty acid β-oxidation [27]. The regulation of lipids by PPARα pathway
was down at 12, 9, and 3 MBSC (Fig. 3c). PPARα is the primary transcriptional regula-
tor of APOA1, which may explain its low levels in cases. Moreover, PPARα regulates
glycogen synthesis by modulating the expression of glycogen synthase 2 (GYS2), an en-
zyme that is downregulated in cases at 9–12 MBSC. GYS2 downregulation, togetherBalzano-Nogueira et al. Genome Biology (2021) 22:39 Page 10 of 27
with the high expression of glycogen synthase kinase 3-β (GSK3B) and the downregula-
tion of its inactivating enzyme AKT serine/threonine kinase 1 (AKT1), suggests that
the glycogen synthesis pathway is slightly repressed in IA cases compared to their
healthy controls (Fig. 5). PPARα is also a transcriptional activator of pyruvate dehydro-
genase kinase isoform 1 (PDK1), a major repressor of glycolysis that was downregulated
in our data. Notably, metabolic processes related to glucose utilization and energy syn-
thesis (glycolysis, pyruvate metabolism, oxidative phosphorylation, TCA cycle) were sig-
nificantly enriched and activated in cases at most time points before seroconversion
(Fig. 3a). IA subjects exhibited elevated expression of several glycolysis-associated genes
(Fig. 5), which presumably should result in increased flux through the glycolytic path-
way, leading to pyruvate and acetyl-CoA synthesis. Acetyl-CoA, a precursor to both the
TCA cycle and fatty acid synthesis, reacts with the TCA cycle intermediate succinyl-
CoA to produce adipate, but can also be transformed into more complex fatty acids.
Neither acetyl-CoA nor succinyl-CoA was measured in the study; however, the ob-
served accumulation of their anabolic products, adipate, and fatty acids, along with the
higher level of TCA metabolites measured, is suggestive of exacerbated TCA cycle in
IA subjects. Additionally, upregulation of oxidative phosphorylation (OP) pathway
genes was observed in IA subjects at all time points (Fig. 3a). Elevated OP enzyme ac-
tivities are known to be associated with increased production of ROS. In agreement, we
detected enrichment of detoxification process pathways (ROS detoxification and DNA
repair, Fig. 3a) and upregulation of genes encoding intracellular ROS-scavenging en-
zymes, including glutathione peroxidase (GPX1), peroxiredoxin (PRDX1), and super-
oxide dismutase (SOD) (Fig. 5).
Collectively, this molecular profile suggests a model in which IA-developing subjects
display an imbalance in lipid metabolism that is linked to reduced nutrient uptake, trig-
gers activation of glycolysis, and leads to intermediate metabolites and ROS accumula-
tion as early as 12 MBSC.
ROS accumulation disrupts arachidonic acid metabolism and leads to an inflammatory
response
We detected higher expression levels of several arachidonate-lipoxygenase genes like
ALOX12, ALOX15, ALOX15B, and prostaglandin synthase1 (PTGS1), known to be acti-
vated upon ROS accumulation [28, 29] (Fig. 5). These enzymes transform arachidonate
into a variety of proinflammatory and pro-angiogenic molecules such as prostaglandins
and eicosanoids [28]. Arachidonate is the result of phospholipases A2 (PLA2s), whose
activity is also induced by ROS. The gene expression data indicated upregulation of
two phospholipase isoforms, PLA2G4C and PLA2G7, in cases at multiple time points
before seroconversion. Interestingly, we did not detect a significant change in ara-
chidonate between cases and controls, which may indicate a rapid turnover be-
tween biosynthesis and catabolism. However, our data did suggest the participation
of the arachidonate metabolism pathway in the inflammatory response observed in
IA cases. This involvement is also supported by previous works showing that
ALOX12 was implicated in pancreatic inflammation induction and T1D disease
progression [30] and that ALOX5 was involved in leukocyte recruitment and
aneurysm formation in arteries [31]. These data reinforce the influence of highBalzano-Nogueira et al. Genome Biology (2021) 22:39 Page 11 of 27
ROS levels on the initial inflammatory response as well as chronic inflammation
experienced by IA-progressing subjects.
TNFα activation by ROS accumulation links metabolic imbalance to the observed
immune response marks
Further interpretation of our multi-omics predictive signature suggests possible links
between the observed metabolic dysregulation, ROS-related inflammatory events, and
T1D-related autoimmune responses. The data indicated early upregulation of tumor
necrosis factor-α (TNFα) (Fig. 6), known to be an effector of T1D development and to
be synthesized in response to elevated ROS levels [32]. TNFα activates forkhead box
protein O1 (FOXO1) through the PI3K-AKT1/3-FOXO1 pathway, which was found
upregulated at 6–9 MBSC (Fig. 3c). In mice, FOXO1 is required for inhibition of T cell
activity and its deficiency has been associated with spontaneous T cell activation and
differentiation into T-helper1 (Th1) and Th2 cells [33]. Thus, the low FOXO1 expres-
sion at 9–12 and 0–3 MBSC may indicate spontaneous activation and maturation of
Th cells in cases. We also observed upregulation of HLA-DMA/B genes at 12 and 3
MBSC, and significant activation of antigen presentation pathways at 3–0 MBSC
(Fig. 3c). HLA-DM is a heterodimer (1α and 1β chains) and is an invariant MHC
protein in humans involved in loading peptides onto MHC class II molecules [34].
Notably, PI3K-AKT1/3-FOXO1 pathway also stimulates the synthesis of HLA-DM
isoforms [34]. The changes in HLA-DM levels within antigen-presenting cells
(APC), in turn, have been shown to influence the presentation of autoantigens and
Fig. 6 Proposed model of autoimmune processes revealed by IA-predictive multi-omics signature. High
ROS levels of IA-developing individuals may induce early upregulation of TNFα, leading to increased activity
of APC and the activation of Th cells through FOXO1 pathway. Low levels of TGFβ and IL10 may indicate
inability to control T cell proliferation, with high MMP9 suggesting an environment favorable to cell
migration. This may result into inflammation, cytokinesis, and migration of immune (CD8+ T or NK) cells to
the pancreatic islet, which may provoke apoptosis activation through PRF1/GZMB/Casp3 pathway. Refer to
Fig. 5 for more meanings of used symbols. Heatmaps represent either gene expression levels (dark blue
boxes) or pathway enrichment data (light blue boxes). From left to right, 5 time points (12, 9, 6, 3, and 0
months before seroconversion) are represented. Blue indicates downregulation and red indicates
upregulation in casesBalzano-Nogueira et al. Genome Biology (2021) 22:39 Page 12 of 27
the development of autoimmune disorders such as T1D [35], which is additionally
supported by the pathway enrichment data showing a late upregulation of antigen
presentation via MHC Class I and Antigen processing−Cross presentation (Fig. 3c).
Therefore, the transcriptional signature found in the TEDDY IA-progressing indi-
viduals may represent a process by which ROS-mediated TNFα activation can be
linked to Th activation and higher APC activity operating in the development of
autoimmunity (Fig. 6).
Additionally, significant downregulation of the transforming growth factor-beta
(TGFβ) and interleukin-10 (IL10) genes was observed (Fig. 6). TGFβ and IL10 are pro-
duced in monocytes and T-regulatory cells (Tregs) and serve to regulate the prolifera-
tion of T-helper cells. This regulation is critical for the maintenance of self-tolerance
and immune homeostasis as well as for suppression of global immune response and
inflammation [36, 37]. Thus, low expression levels TGFβ and IL10 in cases suggest a
failure to sufficiently suppress immune response and inflammation.
IA-developing patients show changes in extracellular matrix components and increased
immune-cell mobility
The enrichment analysis revealed pathways implicated in chemotaxis (chemokine gene
expression, cytokine-cytokine receptor interaction) and immune-cell migration (leukocyte
transendothelial migration) (Fig. 3c) to be upregulated in cases at 3–9 MBSC. This in-
dicates the activation of immune system communication processes months ahead of
the actual detection of islet autoantibodies. Chemotaxis could also be favored by in-
creased levels of phosphatidylethanolamines at 6–12 MBSC, which are known to play a
role in the disassembly of contractile rings during cytokinesis [38]. Moreover, our pre-
dictive signature included the upregulation of metalloproteinase 9 (MMP9) at 3–12
MBSC, which could facilitate cell migration and autoimmune response by extracellular
matrix remodeling. In agreement, proteomics studies have identified both innate im-
munity and extracellular matrix proteins as T1D biomarkers [8, 39].
Simultaneous with the upregulation of MMP9, the metalloproteinase inhibitor TIMP3
was downregulated at early time points (Fig. 6). TIMP3 was one of the most intercon-
nected genes (Fig. 4, Additional file 13: Table S1), correlated at 12–9 MBSC with SIGL
EC1, an immunoglobulin superfamily member that facilitates macrophage-to-cell and
macrophage-to-lymphocyte adhesion [40], and NFKBIL1, a divergent member of the
IκB family that is involved in the negative regulation of innate immune response [41]
(Fig. 4). Altogether, these biomarker expression signatures suggest that cases may dis-
play a more permeable extracellular matrix (ECM) that would facilitate the cytokinesis-
dependent cell migration processes previously described (Fig. 6).
Processes disrupting cells might be detectable on peripheral blood mononuclear cells
(PBMC) samples of IA subjects
Since our blood multi-omic signature revealed T cell activation and immune-cell mi-
gration processes in IA-developing children, we searched for markers of β cell destruc-
tion in our data. Blood biomarkers, such as the islet autoantibodies, may be indicative
of distal organismal pathologies, which liberate molecular signals into the bloodstream.
The upregulation of apoptosis-associated genes, including perforin (PRF1), granzyme BBalzano-Nogueira et al. Genome Biology (2021) 22:39 Page 13 of 27
(GZMB), and caspase3 (Casp3), was identified in cases throughout the 12 MBSC
(Fig. 6). The PRF1/GZMB/Casp3 pathway is associated with CD8+ T- and Natural
Killer-mediated destruction of antigen-presenting β cells [42]. Notably, a significant en-
richment of the Natural Killer-mediated destruction pathway at 6 MBSC was also de-
tected by our analyses (Fig. 3c). These transcriptional profiles may reflect a progression
towards IA that involves a pro-apoptotic autoimmune process initiating β cell degrad-
ation at early time points. This may be followed by increased activity of Natural Killer
and/or CD8+ T cells at 6 MBSC, and finally, antigen presentation via MHC1 and
MHC2 at 0–3 MBSC leading to the appearance of autoantibodies as markers of IA
seroconversion in the blood (Fig. 6).
Altogether, our analysis of immune processes revealed by the blood multi-omics sig-
nature associated with IA progression lends support to a model in which ROS stimu-
lates increased activity of antigen-presenting cells and decreased activity of Tregs
within an environment that favors immune-cell patrol, activation of autoimmunity, and
migration of cytotoxic-CD8+ T and NK cells towards to pancreatic islets, where they
coordinate the degradation of β cells.
Discussion
High prevalence diseases such as type 1 diabetes are the consequence of the interaction
of a variety of genetic and environmental factors that contribute to the establishment
of a complex molecular phenotype leading to the onset of the disease. The molecular
dysregulation pattern of T1D has been extensively studied via high-throughput assays
such as genomics, transcriptomics, metabolomics, and metagenomics. However, few
studies measure these different features on the same set of individuals and over an ex-
tended period as the TEDDY project does. Such an experimental design allows for an
integrative analysis that can reveal the contributions and interactions of different mo-
lecular disease factors and their progression to autoimmunity. The realization of such
analysis potential requires advanced preprocessing and statistical tools capable of
harmonization, modeling, and interpretation of highly heterogeneous data. Here, we ad-
dressed these challenges by deploying an analysis pipeline that (a) makes use of the
TEDDY case-control design and a time-rescaling strategy to combine measurements
from individuals of different age, sex, and genetic background into a comparable and
sufficiently powered dataset; (b) models omics features through 3D tensor structures,
both separately and jointly, to recover the contribution of each molecular layer to dis-
ease progression while providing a unique predictive model; (c) combines multiple bio-
informatics pathway analysis methods to propose interpretable models of disease. This
analysis strategy strongly contrasts with most multi-omics disease studies where either
omics modalities are poorly integrated [43], have no temporal dimension [44], or are
restricted to evaluate predictive performance without biological interpretation [45]. We
believe the integrative/predictive/interpretative strategy presented here is a valuable
contribution to disease modeling that can be applied to other multifactorial
pathologies.
We used a multivariate approach (NPLS-DA) and combinatorial variable selection
strategy based on the VIP statistics to identify a predictive multi-omics signature. The
NPLS approach was preferred for this study as it naturally accommodates the three-
dimensional structure of our dataset to return information about patients, features, andBalzano-Nogueira et al. Genome Biology (2021) 22:39 Page 14 of 27
the dynamics of the disease progression. Moreover, the VIP-based variable selection re-
sults in a predictive signature that can be further analyzed and interpreted by enrich-
ment methods. We note that PLS may be prone to overfitting when the number of
variables largely exceeds the number of observations. Possible model overfitting was ad-
dressed here both at variable selection and prediction performance, in the first case by
implementing a permutation test for the final selected variables (Fig. 2d), and in the
second by providing performance values on a set of samples fully excluded from the
model build. These calculations indicated that the multi-omics predictive feature was
highly significant (0.77) with especially high predictive capacity (0.88) at 12 months be-
fore seroconversion (Fig. 2d and Additional file 13: Fig. 7). This 12-month predictive re-
sult was surprising, yet highly significant, as it reveals that an altered and disease-
distinctive molecular phenotype is already established in IA-progressing children as
early as 1 year before the actual detection of beta cell autoantibodies in blood. This
finding suggests that disease progression is a process extended over time but, more im-
portantly, it opens a window of opportunity for therapeutic intervention.
We present an interpretative analysis of the NPLS-DA autoimmunity predictive sig-
nature that combines time-resolved enrichment analyses to identify disease-evolving
cellular processes, partial correlation analysis to unravel novel molecular associations,
and PaintOmics-assisted data representation to incorporate existing pathway maps into
one integrated biological model. The results of the interpretative effort also revealed
many interesting patterns. First, we detect a metabolic phenotype in IA-developing chil-
dren that is sustained during the analyzed 12-month period before seroconversion. This
phenotype consists of the upregulation of energy-producing pathways and fatty acids,
and the downregulation of structural lipids, triglycerides, and a major transcriptional
regulator of lipid metabolism. Different elements of the metabolic signature reported in
this work have been previously described in the literature as having links with T1D. For
example, the metabolic stress before seroconversion has been reported to impact levels
of phospholipids and energy metabolites [10, 46]. Low levels of lysophosphatidylcholine
and sphingomyelins were related to T1D [17], but also to HDL phospholipid levels dur-
ing inflammation, accumulation of oxidized fatty acids, and disruption of the structure
of APOA1 [47]. Similarly, low levels of APOA1 have been associated with lipid abnor-
malities in young T1D subjects [15]. Finally, vitamin D deficiency is a reported marker
of islet autoimmunity [22, 23]. Our analysis reports similar behaviors of these features
in the same group of individuals, thereby corroborating previous findings. Additionally,
our study provides deeper and time-informed mechanistic insights of disease progres-
sion where additional features expanding multiple molecular layers are revealed. Com-
bined, we propose a model for TEDDY autoimmune children that stresses the lipid
metabolism impairment (LMI) phenotype present at 12 months before seroconversion,
which is associated with lower vitamin levels, possibly due to defects in nutrient uptake.
Compared to healthy individuals, cases progressing to IA showed lower glycogenesis
and higher glycolytic activity, indicating that consumption, rather than storage of glu-
cose, prevails. Products of glycolysis feed into the TCA cycle, which in turn provides
substrate for the electron transport chain and oxidative phosphorylation, both pro-
cesses were strongly upregulated throughout the year before autoantibody detection.
High-energy and oxidative state may result in an excess of ATP synthesis, which could
explain the observed accumulation of fatty acids, cholesterol, and toxic secondaryBalzano-Nogueira et al. Genome Biology (2021) 22:39 Page 15 of 27
metabolites like adipate [20]. Besides, upregulated oxidative phosphorylation in cases
could lead to the accumulation of reactive oxygen species (Fig. 3), possibly resulting in
systemic damage and inflammation [48], as corroborated by the measured high expres-
sion of genes coding for ROS-degrading enzymes and phospholipases.
This metabolic signature prevails for months before the detection of autoantibodies
while signaling and immune-related mechanisms seem to follow a more complex regu-
latory pattern in which some pathways are activated at 6–9 months before seroconver-
sion while others become active closer to diagnosis. Here, evidence of ROS-related
inflammation, angiogenesis, and immune responses was observed (Figs. 3 and 4). Usu-
ally, inflammatory responses occur only in consequence of existing cellular dysfunc-
tions. As both LMI and high ROS levels result in cellular damage, the immune system
is likely to respond. High ROS is also known to induce TNFα/FOXO1-related path-
ways, leading to maturation and proliferation of cytotoxic lymphocytes and effector
Th1 cells, which stimulate the synthesis and release of pro-inflammatory cytokines [28].
Our model then proposes that increased activities of APCs and Th1 cells, along with
low activity of Tregs, propitiate cytokinesis. An increased ECM permeability allows for
enhanced motility and communication between macrophages and other innate immune
cells. Overall, this may facilitate the activity of an already in-alert-state immune system,
thereby increasing the likelihood of an autoimmune response, and leading recruitment
of CD8+ and/or NK cells to the pancreatic islets. Ultimately, this series of events may
result in the activation of apoptosis, and consequent destruction of β cells, which is
characteristic of T1D (Fig. 4). The activated APC phenotype 3–0 MBSC may accelerate
β cell destruction and the ultimate detection of islet autoantibodies, which is the end-
point of our study.
In summary, our analysis proposes a series of events that start as early as 12 months
before seroconversion and involve metabolic, inflammatory, and autoimmune pro-
cesses, inferred by the combination of transcriptomic, metabolomic, and dietary bio-
marker profiles. While data were obtained from different biological compartments
(PBMC and plasma) and their communication has not been modeled, there is overlap
in the metabolic processes that are present and active in both. Interestingly, results of
recent work indicate a similarity in the overall metabolic profiles of PBMC and plasma
of diabetic patients, with differences between cases and controls being larger in PBMC
extracts [49]. These results indicate that integrative analysis of PBMC transcriptomic
and plasma metabolites is meaningful to elucidate the metabolic and regulatory trends
that operate in the bloodstream of affected individuals. Conversely, a benefit of the
multi-compartmental nature of this study is that it offers a broad range of insights on
the underlying factors of T1D progression at a systems level, as demonstrated by our
detection of significant correlations between molecular features of diverse nature.
Additionally, results shown here combine most of the TEDDY cohort in one unique
analysis, regardless of important disease factors such as type of first-appearing autoanti-
body, ethnicity, or country of origin. Unfortunately, further stratification of the multi-
omic data based on these factors results in limitations at the effective sample size.
Therefore, we acknowledge that the results shown here do not represent a complete
disease model nor capture possible differences in disease subtypes. Still, this study dem-
onstrates the power of the integrative approach to model complex disease processes
with temporal resolution and to identify molecular disease phenotypes months beforeBalzano-Nogueira et al. Genome Biology (2021) 22:39 Page 16 of 27
the current diagnosis capacity. Ultimately, the results provide information that will
guide the development of strategies for early diagnosis and treatment of T1D.
Finally, while our study establishes a metabolically impaired and high inflammatory
state in children with HLA risk genotypes who progress towards autoimmunity, it does
not provide any insights on the origin of this physiological condition. Causes could be
either genetic or environmental. The genetics of T1D has been extensively studied with
nearly 50 SNPs found to have a significant association with T1D [50]. T1D genetic risk
scores have also been proposed [51]. While many of the identified SNPs are related to
genes of the immune system [50], the vast majority of them are non-coding and their
regulatory effects remain uncertain. The results of our analyses provide new hypotheses
for targeted studies evaluating the extent to which T1D-associated genetic variations
impact the metabolic processes described in this study. Similarly, a wealth of literature
exist that associate external environmental factors with T1D [52]. For example, viral in-
fections [53], nutritional factors [54–56], and stressful life events [57, 58] have been
linked to increased IA and T1D incidence.
However, some other environmental factors showed contradictory results. For ex-
ample, cow milk intake in childhood has been associated with both an increased risk of
IA [59] and T1D [60], and a decreased risk of T1D [61]. More research is definitely
needed to delineate the contribution of environmental factors and their interactions
with predisposing and/or protective genes to the development of IA and T1D.
The TEDDY study, which also collects lifestyle and exposure data, represents a
unique opportunity to analyze the relationship between environmental factors and the
molecular phenotypes discovered here. Additional studies have the potential to further
elucidate the type and timing of environmental triggers affecting the onset of islet auto-
immunity as well as the subsequent course of disease in those who ultimately develop
T1D.
Methods
TEDDY study design
TEDDY is an international study that enrolled 8676 newborn infants with a high- or
moderate-risk class II HLA genotype between 2004 and 2010 [62]. The individuals used
in this study were selected based on their HLA-DR-DQ genotype [63], which indicated
high risk of developing T1D. Participants are closely followed for the development of
IA or type 1 diabetes, with study visits every 3 months from birth to age 48 months,
and every 3 or 6 months thereafter. Patients were followed either until development of
T1D (30% or enrolled individuals) or to the age of 15 (control individuals). Participating
study centers included Georgia/Florida, Colorado, and Washington in the USA, and
Finland, Sweden, and Germany. IA cases were defined by confirmed autoantibody posi-
tivity to either insulin (IAA), GAD (GADA), or IA-2 (IA-2A) in two consecutive visits,
the first of which defines the case’s event age. At each visit, blood samples were taken
to profile gene expression, metabolomics, and dietary biomarkers. The study methods
were carried out in accordance with the approved guidelines by local Institutional Re-
view or Ethics Boards [62, 64]. Due to the large number of samples involved, specific
procedures were applied to minimize batch effect. Briefly, samples from each case and
matched controls were run in the same analytic batch. When this was not feasible dueBalzano-Nogueira et al. Genome Biology (2021) 22:39 Page 17 of 27
the limited number of samples that the batch can process, samples to be compared
with each other (i.e., collected at the same visit) were arranged to be run in the same
analytic batch [14]. Data are available upon request from the NIDDK Central Reposi-
tory at https://www.niddkrepository.org/studies/teddy.
Gene expression
Blood sampling from enrolled children began at 3 months of age, with subsequent sam-
ples taken at 3-month intervals for 48 months, after which they were taken biannually.
Total RNA was extracted from 2.5 mL peripheral blood per sample using high-
throughput (96-well format) extraction protocol that applies magnetic (MagMax) bead
technology at the TEDDY RNA Laboratory, Jinfiniti Biosciences in Augusta, GA. Puri-
fied RNA (200 ng) was further used for cRNA amplification and labeling with biotin
using Target Amp cDNA synthesis kit (Epicenter catalog no. TAB1R6924). Approxi-
mately 750 ng of labeled cRNA was hybridized to the Illumina HumanHT-12 Expres-
sion BeadChips per the manufacturer’s instructions. The HumanHT-12 Expression
BeadChip provides coverage for more than 47,000 transcripts and known splice variants
across the human transcriptome. After hybridization, arrays were washed, stained with
Cy3-conjugated streptavidin, and scanned. Gene expression data were generated for
306 individuals. The beadarray and lumi Bioconductor packages were used for prepro-
cessing microarray data, including image analysis, quality control, variance stabilization
transformation, normalization, and gene annotation. The Median Background method
was used for local background correction. Also, the BeadArray subversion of harshlight
(BASH) method was used for bead artifact detection, which takes local spatial informa-
tion into account when determining outliers. Each probe is replicated a varying number
of times on each array; the summarization procedure produces bead summary data in
the form of a single signal intensity value for each probe. Illumina’s default outlier func-
tion and modified mean and standard deviation were used to obtain the bead summary
data. Variance-stabilizing transformation (vst) and robust spline normalization (RSN)
methods, which combine features of quantile and loess normalization, were applied to
correct for batch effect and obtain between-array data normalization. The pairwise
structure of the data permits elimination of biases associated with the characteristics of
the pair, such as gender, age, and country of origin, as previously described [14]. Qual-
ity control leads to exclusion of arrays with any of the following undesirable attributes:
corrupted image files, high gradient effects on probe intensities, high percentage of
beads masked by the BASH method, low mean or median number of beads used to cre-
ate the summary values for each probe on each array after outlier removal, low propor-
tion of detected probes, low percentage of housekeeping genes expressed above the
background level of the array, gender discrepancies assessed with massiR package, or
poor pairwise array correlations.
Metabolomics
The Fiehn laboratory at the NIH West Coast Metabolomics Center (University of Cali-
fornia, Davis) quantified metabolomics abundance measures (metabolites and lipids)
for all cases and controls for each available study visit from birth until the case event
time. Primary metabolites and complex lipids were quantified from citrate plasma usingBalzano-Nogueira et al. Genome Biology (2021) 22:39 Page 18 of 27
GC-TOF MS and CSH-QTOF MS data acquisition, respectively, at the NIH West
Coast Metabolomics Center at the University of California, Davis [65]. GC-TOF MS
data were acquired as previously described [66], with data processing and compound
identification using the BinBase algorithm [67]. LOESS followed by batch ratio
normalization (QC samples were used to adjust sample batch median to global study
median) was performed across all metabolomics samples to estimate and remove ana-
lytical variance and batch effect. For complex lipids, samples were extracted by methyl-
tert-butyl ether/methanol/water [65], followed by chromatogram peak detection and
alignments using Mass Profiler Professional (Agilent, Santa Clara, CA). Peaks detected
in a minimum of 30% of samples were aligned, with missing peaks recovered by back-
filling strategies. Lipids were identified using the Fiehn laboratory’s LipidBlast spectral
library [68]. Briefly, after LOESS signal correction, quality control samples were used to
adjust sample batch median to global study median of all samples to reduce batch ef-
fect. Normalization was performed across all the samples to estimate and remove ana-
lytical variance. GC-TOF metabolomics, positive-ion lipidomics, and negative-ion
lipidomics contained 1556, 514, and 443 features respectively. Metabolomics data were
generated for 1556 individuals. Further details on the TEDDY metabolomics data can
be found at [69].
Dietary biomarkers
Plasma from blood drawn into light-protected tubes (BD Vacutainer®CPT™ Cell Prepar-
ation Tubes) was used to determine dietary biomarkers at the Genomics and Bio-
markers Unit at the National Institute for Health and Welfare, Helsinki, Finland.
25(OH) D concentrations were measured using the ARCHITECT 25-OH Vitamin D
chemiluminescent microparticle immunoassay (CMIA) [23]. For ascorbic acid measure-
ments, 50 μL plasma was transferred into cryovials and stabilized by adding 0.2 ml of
5% trichloroacetic acid (TCA) plus 200 mg disodium EDTA with subsequent freezing
at − 70 °C. Ascorbic acid concentration was determined by an ion-paired, reversed-
phase, high-performance liquid chromatographic method using electrochemical detec-
tion, as described [70, 71]. Isoascorbic acid was used as internal standard for the quan-
titation of ascorbic acid. Fatty acids were analyzed from erythrocytes stabilized with 2-
propanol and butylated hydroxytoluene. A gas chromatographic method [72] modified
from previously published methods [73, 74] was used. Erythrocyte fatty acid composition
was analyzed using an Agilent 6890 gas chromatograph (Hewlett Packard, Palo Alto, CA,
USA) with a split injector and hydrogen as the carrier gas on a capillary column Omega-
wax 320 (length: 30 m, I.D.: 0.32 mm, phase layer: 0.25 μm; Supelco, Bellefonte, PA, USA).
The percentage composition of fatty acid methyl esters was normalized to 100%. Plasma
retinol, carotenoids and tocopherols were extracted from 50 μl of plasma by liquid-liquid
extraction using n-hexane and ethanol [75]. First, tocopherols were determined from the
samples using HPLC and fluorescence detection, after which retinol and carotenoids were
determined by using HPLC and multiwavelength detection, using a modified version of a
previously published method [75]. Cholesterol analysis was performed using an enzymatic
cholesterol assay on the Architect ci8200 analyzer (Abbott Laboratories, Abbott Park, IL,
USA). Dietary biomarker data were generated for 1621 individuals. Further details on the
TEDDY dietary biomarker data can be found at [23].You can also read