BREAKING OLD GROUND - ECONOMIC IMPACT OF HYDRAULIC FRACTURING OF OIL AND GAS WELLS IN NEW ZEALAND - VENTURE TARANAKI
←
→
Page content transcription
If your browser does not render page correctly, please read the page content below

Unlocking
 Breaking the
          Oldpotential
              Ground

economic impact of hydraulic fracturing
   of oil and gas wells in New Zealand

                       Venture
              TARANAKI
               Te Puna Umanga    Unlocking
                                         THE
                                           the
                                             ROAD
                                               potential
                                                  AHEAD    1
Foreword
    The goal of economic transformation requires both the careful management of risks and
    the strategic optimisation of economic rewards.

    That the oil and gas industry has risk associated with it, and   We also understand how these rewards can align with
    that this risk largely sits with environmental and health and    national goals of economic transformation. In an industry
    safety outcomes, is accepted. But what hasn’t been fully         where a single well strike can add $1 billion onto the
    explored is the flip side – the economic reward the industry     nation’s balance sheet, the value in optimising the
    can and could contribute.                                        productivity of existing wells cannot be underestimated.

    In 2010 Venture Taranaki, the regional development               Having hosted the industry in Taranaki for over 150 years,
    agency for New Zealand’s foremost energy province,               we too understand what it can mean for our ability to
    released the Wealth Beneath Our Feet report, which went          provide New Zealand’s future generations with a means to
    a long way towards quantifying the value of the industry         have a great job, a great standard of living and that New
    in terms of employment, GDP and community economic               Zealand remains a fantastic place to live, work and play.
    impact. This report extends that economic analysis to the
    issue of hydraulic fracturing.                                   There are perceptions that profits from oil and gas activity
                                                                     in New Zealand disappear offshore or into a central
    As an independent and apolitical agency, Venture                 royalties fund, that it employs few New Zealanders, or that
    Taranaki has initiated and driven this project under its         the nation does not benefit. Both this report and our earlier
    regional mandate of leading Taranaki’s economic growth.          Wealth Beneath Our Feet have found that this simply isn’t
    The report offers a robust and impartial analysis of the         the case; both reports confront these perceptions with a
    economics behind hydraulic fracturing, and how the               balanced economic argument.
    outlook may be optimised to deliver maximum benefit to
    the New Zealand economy.                                         The economic rewards from oil and gas extend far
                                                                     beyond royalties. The value that could be added by
    The Taranaki region’s oil and gas reserves have brought          hydraulic fracturing lies in jobs, innovation, added-value
    global corporate citizens to the province. In doing so, the      manufacturing, regional growth and greater energy
    energy sector and its local supply chains have ensured the       security for our national economy.
    region’s economic performance has been well ahead of
    the national curve. On a regional basis our communities          Our nation’s base load domestic energy demand is around
    understand the risks, and we understand the rewards that         160-170 petajoules of energy a year. By 2018 New Zealand
    come with oil and gas.                                           is forecast to experience a shortfall between demand and
                                                                     supply, which will require either increased imports, new

2    Unlocking the potential
“In creating this report we have sought to provide
         a clear, concise and accurate resource to stimulate
         discussion, inform our nation’s communities – both
              Maori and Pakeha - and our political leaders.”

discoveries and/or embracing new technologies that enable          GDP could increase by $799 million and an additional 7,400
the extension of existing fields.                                  people would be employed each year. Around 65 percent of
                                                                   this GDP and employment could occur outside the Taranaki
Hydraulic fracturing is one of those technologies, and can         region, spreading the benefits across the nation. Royalties
help New Zealand meet the energy demands of current and            paid to central government over the next ten years could
future generations. It extends the economically recoverable        reach $4.4 billion.
levels of energy stored in existing wells and strengthens our
ability to manage the potential shortfalls between demand          Whatever our nation’s future holds for the practice of
and supply.                                                        hydraulic fracturing, it is critical that we take a view that
                                                                   balances risk and reward. Industry practice in New Zealand
We face, and must prepare for an unknown energy future.            should be managed within one of the tightest health,
Ensuring we maximise the efforts and results of existing           safety and environmental regimes in the global oil and gas
wells, within a managed risk profile, is critical. In doing that   industry. The environmental risks need to be heavily assessed
we need to acknowledge that greater short term investment          and actively managed.
is required to ensure that regional New Zealand shares in the
economic prosperity of the nation, and can meet the needs          This report informs the national debate and quantifies for the
of this industry.                                                  first time the economic benefits that new technologies can
                                                                   deliver in helping to unlock the wealth beneath our feet.
This report analyses three plausible scenarios for hydraulic
fracturing in New Zealand; moratorium, expansion, and the          In doing so New Zealand will move closer to fully and safely
status quo. It supports these scenarios with projections out       optimising our natural resources to benefit not just current
to 2022. Balancing the risk of the current hydraulic fracturing    but future generations of all New Zealanders.
regulatory model is a fiscal reward of $215 million in GDP
and 2,000 jobs annually and up to $1.6 billion in royalties
over the next decade.

A moratorium on the practice of hydraulic fracturing would
minimise any risk, but would also see most of those rewards
extinguished.

Conversely, were hydraulic fracturing to become a regulated,       Stuart Trundle
consented activity acceptable throughout other regions,            Chief Executive, Venture Taranaki Trust
then the economic gains could be even greater. On average,         December 2012

                                                                                                   Unlocking the potential          3
“New Zealand’s future will be underpinned by
its natural resources. It is critical these resources
are carefully managed for future, not just current
generations. Economic resources are no different.”

4   Unlocking the potential
Contents
            Executive Summary ....................................................................................................... 6
            Introduction.................................................................................................................... 9
            Background ................................................................................................................... 11
                    Hydraulic Fracturing................................................................................................. 11
                    Hydraulic Fracturing in New Zealand........................................................................ 12
            Method............................................................................................................................ 16
                    Context.................................................................................................................... 17
                    Oil and Gas production in New Zealand................................................................... 17
                    Gas Production......................................................................................................... 18
            Scenarios........................................................................................................................ 23
                    Summary................................................................................................................. 23
                    Scenario 1 – Low activity.......................................................................................... 25
                    Scenario 2 – Business as usual (BAU)........................................................................ 26
                    Scenario 3 – Non conventional plays........................................................................ 27
            Economic Impact of Hydraulic Fracturing................................................................ 28
                    BAU scenario............................................................................................................ 29
                    BAU+ scenario.......................................................................................................... 30
            Other Impacts................................................................................................................ 31
                    Mangahewa Developments...................................................................................... 31
                    Natural Gas as an energy source............................................................................... 32
                    Role of Gas in electricity generation.......................................................................... 32
            Bibliography.................................................................................................................. 34

Figures & Tables
Figure 1   Hydraulic fracturing in Taranaki, 1989 - 2011                           12      Table 1      Summary of activity – scenario (Low)                        25
Figure 2   Hydraulic fracturing in Taranaki by year, 1989 - 2011                   13      Table 2      New Zealand annual average economic activity 2013 - 2022    25
Figure 3   Net national oil and gas production (PJs), 1974 - 2011                  17      Table 3      Taranaki annual average economic activity 2013 - 2022       25
Figure 4   Net national gas production by field, 1974 - 2011                       19      Table 4      Summary of activity – scenario (BAU)                        26
Figure 5   Net national gas production, onshore and offshore,                              Table 5      New Zealand annual average economic activity 2013 - 2022    26
           1974 - 2011                                                             19
                                                                                           Table 6      Taranaki annual average economic activity 2013 - 2022       26
Figure 6   Net National Gas Production, treated vs. non-treated
           fields, 1974 - 2011                                                     20      Table 7      Summary of activity – scenario (Low)                        27

Figure 7   Onshore net national gas production, treated vs. non                            Table 8      New Zealand annual average economic activity 2013 - 2022    27
           treated fields, 1974 - 2011                                             20      Table 9      Taranaki annual average economic activity 2013 - 2022       27
Figure 8   Wells drilled 1999 -2011, onshore vs. offshore                          21      Table 10     Activity generated by hydraulic fracturing (BAU Scenario)   29
Figure 9   Onshore oil and gas production scenarios to 2022, PJs                   23      Table 11     Economic impact of hydraulic fracturing on New Zealand      29
Figure 10 Onshore gas production scenarios to 2022, PJs                            24      Table 12     Economic impact of hydraulic fracturing on Taranaki         29
Figure 11 Onshore oil production scenarios to 2022, PJs                            24      Table 13     Economic impact of hydraulic fracturing on New Zealand      30
Figure 12 Economic impact of hydraulic fracturing                                  28      Table 14     Economic impact of hydraulic fracturing on Taranaki         30
Figure 13 Activity generated by hydraulic fracturing (BAU+ scenario)               30
Figure 14 Total primary energy supply, 2011                                        32
Figure 15 Electricity generated by fuel type, 2011                                 32
Figure 16 Electricity generation by fuel type in a dry year, 2008                  33
Figure 17 Natural gas use by sector, 2011                                          33

                                                                                                                                          Unlocking the potential        5
Executive Summary
    BERL was commissioned by Venture Taranaki to estimate the potential economic impact
    of hydraulic fracturing of oil and natural gas wells in Taranaki and New Zealand.

    This report presents an estimate of future economic activity associated with the
    production of natural gas, oil and condensates that can be attributable to the ability to
    incorporate hydraulic fracturing treatments.

    The scope of the report is on the economic activity enabled by hydraulic fracturing. The
    report does not take a position on hydraulic fracturing in relation to the environment.

    Approach                                                         included to emphasise the potential benefits that hydraulic
                                                                     fracturing will enable.
    The analysis uses a production scenario approach over a
    ten year period from 2013-2022. There are three scenarios        This additional activity can be measured in terms of
    that are compared:                                               production, and can also be converted to revenues,
                                                                     royalties, GDP and employment.
        • A low scenario, where a moratorium on hydraulic
        fracturing is put in place.                                  BAU scenario
        • A BAU scenario, where a resource consent is required       Under the BAU scenario, the ability to perform hydraulic
        to undertake hydraulic fracturing treatments as per the      fracturing activity could result in the production of an extra
        current environment but current activity is limited to       773PJs of gas and an extra 277PJes of oil and condensate
        conventional plays in the Taranaki region.                   over the ten year period 2013 to 2022.1

        • A BAU+ scenario, where hydraulic fracturing is accepted    Over ten years, additional production between the low and
        as an integral part of oil and gas production throughout     BAU scenario means extra:
        New Zealand and can be applied as needed to both
        conventional and unconventional plays.                        • revenue of $10.5 billion;

    All scenarios relate to onshore activity only, which currently    • exports of $5.1 billion; and
    accounts for around 28-30 percent of net gas produced in
                                                                      • royalties of between $1.0 billion and $1.6 billion.
    New Zealand.
                                                                     The expenditure required to achieve that extra production
    Production levels under the three scenarios are based
                                                                     would have economic impacts at a national and a regional
    on current and historical activity and estimates of likely
                                                                     level.
    production under the scenario parameters. These have
    been developed in discussion with a majority of the oil and      • For New Zealand, additional expenditure of $190 million
    gas companies currently operating in New Zealand.                each year over the next ten years would contribute $86
                                                                     million to GDP and employ 761 FTEs annually. Applying
    Economic activity                                                multipliers, GDP increases to $215 million and employment
                                                                     increases to 1,986 FTEs annually.
    The difference in production between the BAU and the low
    scenario can be considered the additional activity that is       • For Taranaki, additional expenditure of $190 million
    generated as a result of the ability to undertake hydraulic      each year over the next ten years would contribute
    fracturing. A further scenario (BAU+), which includes non-       $86 million to GDP and employ 760 FTEs annually.
    conventional activity (coal seam gas and shale oil), is also     Applying multipliers, GDP increases to $133 million and

    1
        PJe (equivalent).

6       Unlocking the potential
employment increases to 1,190 FTEs annually.                      • For New Zealand, additional expenditure of $705
                                                                  million each year over the next ten years would
You could argue that this is the likely GDP, employment,          contribute $321 million to GDP and employ 2,829 FTEs
exports and royalties that would be lost if hydraulic             annually. Applying multipliers, GDP increases to $799
fracturing is not allowed.                                        million and employment increases to 7,386 FTEs annually.

BAU+ scenario                                                     • For Taranaki, additional expenditure of $248 million
                                                                  each year over the next ten years would contribute
Under the BAU+ scenario the ability to perform hydraulic          $112 million to GDP and employ 994 FTEs annually.
fracturing activity could result in the production of an extra    Applying multipliers, GDP increases to $174 million and
809PJs of gas and an extra 1,293PJes of oil and condensate        employment increases to 1,556 FTEs annually.
over the ten year period 2013 to 2022.

Over ten years, additional production between the low and
                                                                 Additional activity and benefits
BAU+ scenario means extra:                                       of natural gas
 • revenue of $29 billion;                                       Natural gas can be used as a feedstock to produce
                                                                 methanol, which makes a major contribution to economic
 • exports of $23.7 billion; and                                 activity in Taranaki and New Zealand. There is potential for
                                                                 methanol exports to exceed $1 billion.
 • royalties of between $2.9 billion and $4.4 billion.
                                                                 Natural gas also plays a key role in ensuring the effective
The expenditure required to achieve that extra production
                                                                 functioning of electricity supply and supporting the high
would have economic impacts at a national and a regional
                                                                 level of renewable electricity generation in New Zealand.
level.

                                                                                                                       BAU+

                                                                                                                       BAU

                                                                                                                       Low

Source: BERL

                                                                                                Unlocking the potential         7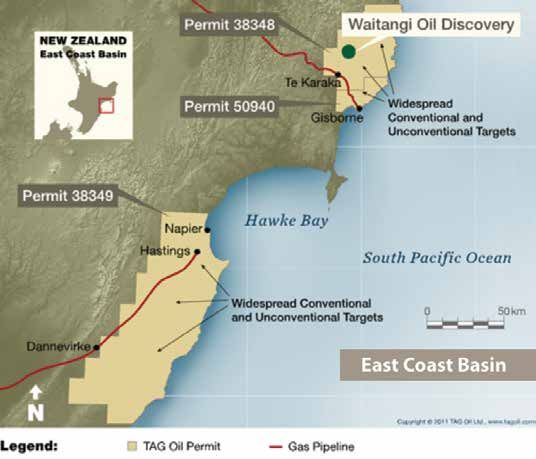
Defining the economic impact
                                     of hydraulic fracturing

8   Unlocking the potential
Introduction
This report looks at the economic impact of hydraulic fracturing of oil and gas wells to
the Taranaki and New Zealand economy. It focuses on two areas of economic impact,
namely additional oil, condensate and gas generated as a result of hydraulic fracturing,
and the economic activity (capital and operational expenditure) resulting from the
ability to undertake hydraulic fracturing.

Between 1989 and mid-2011, 65 hydraulic fracturing                  in terms of GDP and employment as well as increased
procedures were undertaken on 39 wells across 13 onshore            exports.
Taranaki fields. Hydraulic fracturing has been responsible
for the viability, extension and improved yield of a number         In addition, natural gas plays a crucial role in New
of onshore wells in the Taranaki region. Hydraulic                  Zealand’s energy supply. While industry can substitute
fracturing has provided confidence in the supply of natural         other forms of energy into their process (albeit likely at
gas that has resulted in significant new investment in              higher cost), ensuring continuous electricity generation
the Taranaki region. Indeed, an increasing proportion               is dependent upon the on-demand supply of peaking
of natural gas production is as a result of hydraulic               electricity that gas can provide. With current gas
fracturing of existing wells in existing fields rather than the     reserves falling, it is important that new sources of gas
introduction of new production wells or fields.                     are developed to ensure that on-demand electricity can
                                                                    continue to be generated in periods of low renewable
Looking ahead, it is likely that hydraulic fracturing is critical   output.
to sustaining and growing natural gas and oil production
in the Taranaki region and, indeed, in New Zealand.                 Furthermore, the role of gas in terms of export growth and
                                                                    added-value manufacturing should not be underestimated.
This report shows the economic contribution of hydraulic            Natural gas is a feedstock into methanol production.
fracturing to the New Zealand economy by comparing                  Methanex is a major New Zealand exporter, contributing
three future scenarios of production activity that reflect          around $300 million to New Zealand’s exports. With
different policy settings in respect to hydraulic fracturing.       access to the necessary gas at the appropriate price,
These include a low, a business as usual (BAU), and a high          Methanex’s exports can potentially exceed $1 billion.
activity (BAU+) scenario. The difference between the low
and the BAU scenario is the economic impact that can
be attributed to hydraulic fracturing. The BAU+ scenario
includes major unconventional plays in South Taranaki and
on the East Coast.

The economic impact is limited to the additional activity
generated as a result of increased well construction,
hydraulic fracturing activity, and natural gas, oil and
condensate production. This impact can be identified

                                                                                                   Unlocking the potential       9
Detailed Independent Analysis
                               Undertaken by BERL

10   Unlocking the potential
Background
The process of hydraulic fracturing has been around since the 1940s. It has been applied
a number of times in onshore fields in the Taranaki and Waikato regions since 1989.
The process of hydraulic fracturing has been around and exports enabled by the ability to include hydraulic
since the 1940s. It has been applied a number of times in fracturing in the oil and gas production process.
onshore fields in the Taranaki and Waikato regions since
1989. Hydraulic Fracturing
Hydraulic fracturing has extended the life and yield of Hydraulic Fracturing is a well stimulation process used
a number of existing fields, and is responsible for an to maximise the extraction of underground resources;
increasing proportion of gas production. As technology including oil, natural gas, geothermal energy, and even
and techniques develop, hydraulic fracturing is increasingly water.
considered an integral component of optimising any
onshore field assessments in New Zealand. The oil and gas industry uses hydraulic fracturing to
enhance subsurface fracture systems to allow oil or natural
There is currently considerable concern around hydraulic gas to move more freely from the rock pores to production
fracturing and its impacts on the environment. Public wells that bring the oil or gas to the surface.2
interest is high, with calls from some groups for a
moratorium on hydraulic fracturing in New Zealand. Hydraulic fracturing was first used to stimulate the flow
of natural gas from the Hugotan field in Kansas in 1947.
This report does not take a position on hydraulic fracturing Halliburton, an oil services company, performed the
in relation to the environment. The Parliamentary first commercial fracturing treatment in 1949. Hydraulic
Commission for the Environment is currently investigating fracturing has now been used for over 60 years, and in
the effect of hydraulic fracturing on the environment in the US alone, over one million oil and gas wells have
New Zealand and will provide an informed assessment of been hydraulically fractured.3 In the United States it is
the process and its environmental impacts. estimated that 9 out of 10 wells require hydraulic fracturing
treatments to remain or become viable.4
This report has been commissioned by Venture Taranaki,
an independent economic development agency, who A visual example of hydraulic fracturing in Taranaki is
is interested in understanding the economic impacts of available on the Petroleum Exploration and Production
hydraulic fracturing on the New Zealand and Taranaki Association New Zealand (PEPANZ) website at http://www.
economies. These economic impacts are an important pepanz.com/news-and-issues/issues/fracking/how-it-
part of informing the debate around hydraulic fracturing works-/.
by providing an assessment of the employment, GDP
Unconventional gas generally do not require well stimulation to produce.
Unconventional gas is differentiated from conventional Unconventional natural gas deposits are very diverse and
gas on the basis of the nature of the geologic reservoirs it difficult to characterise overall, but in general are often
is found within and the types of technologies required to lower in resource concentration, more dispersed over
extract the gas. large areas, and require well stimulation or some other
extraction or conversion technology.
Conventional natural gas deposits have a well-defined
areal extent, the reservoirs are porous and permeable, the This includes gas extracted from shale formations, as well
gas is produced easily through a wellbore, and reservoirs as coal seams.
2
United States Environmental Protection Agency (EPA). Downloaded from the EPA website at http://water.epa.gov/type/groundwater/
uic/class2/hydraulicfracturing/wells_hydrowhat.cfm on 29 August 2012. Hydraulic fracturing in New Zealand is described in the Taranaki
Regional Council report (pp 3-11).
3
(Energy Institute, 2012).
Unlocking the potential 11Hydraulic Fracturing in low porosity/permeability rock to the wellbore; to a
New Zealand ‘skinfrac’, which is a very short, usually high, fracture to
provide a better connection between the wellbore and
The technique of hydraulic fracturing was first applied in the reservoir. The amount of time, proppant and pressure
New Zealand in 1989, when Petrocorp Exploration Ltd applied varies significantly for different treatment types.
treated the Kaimiro-2 well on 11 May 1989.5 Further, the same wells can be treated multiple times, and
it is commonplace for hydraulic fracturing treatments to be
In the US, hydraulic fracturing is generally applied to repeated after a number of years.
coal or shale at shallow levels (3km) and into fracturing treatments in the Taranaki region between 1989
‘conventional’ sandstone reservoirs to get better flowpaths. and 2011.
It is important to note that treatments can vary from a Looking at Figure 1, the map on the right-hand side shows
production fracture, which is needed to carry gas through the fields where hydraulic fracturing has occurred. The bar
Figure 1 Hydraulic fracturing in Taranaki, 1989 - 2011
Source: Taranaki Regional Council
4
Halliburton. Downloaded from their website at http://www.halliburton.com/public/projects/pubsdata/hydraulic_fracturing/fracturing_101.
html on 29 August 2012.
5
(Taranaki Regional Council, 2012, p. 3).
12 Unlocking the potentialchart on the left shows the geological sub-surface structure Trends and Future Possibilities
of each field; the fresh water aquifer depth; and the depth
where hydraulic fracturing has occurred. The number of As technologies and techniques improve, the general trend
well sites that have undergone hydraulic fracturing is in is that hydraulic fracturing is becoming an increasingly
brackets above each field.6 accepted and integral process in optimising production
flows in new fields rather than just extending the output
As noted earlier, hydraulic fracturing has been applied in of existing wells. For unconventional plays, such as shale
New Zealand since 1989, at the Kaimiro 2 and Kaimiro 3 gas and coal seam gas (CSG), hydraulic fracturing is often a
wells. Between 1989 and mid-2011, there have been a necessary process.
total of 65 hydraulic fracturing procedures in 39 wells in
13 fields in the Taranaki region.7 All hydraulic fracturing to Taranaki fields where hydraulic fracturing have occurred
date has occurred onshore. include Turangi, Mangahewa, Kowhai, Kaimiro, Ngatoro,
Cardiff, Cheal, Kapuni, Rimu, Kauri and Manutahi.
Hydraulic fracturing was applied intermittently until
around 2002, when a re-estimation of Maui reserves saw All recent hydraulic fracturing treatments, apart from four
a significant reduction in recoverable gas reserves and a procedures at Kaimiro and three at Cheal, have occurred
need to increase gas production. Since then, the level in gas fields. As a result, increased output has largely been
of hydraulic fracturing activity has gradually increased as in relation to gas (although some increase in condensate
shown Figure 2. has also occurred). Hydraulic fracturing is also likely to be
applied to shale oil production on the east coast.
Activity peaked in 2005 at 13, with hydraulic fracturing
occurring on wells at Kauri, Cardiff, Kapuni and Manutahi. In the Taranaki region, Greymouth Petroleum, Shell Todd
In 2010, six wells at Kapuni, Mangahewa, Cheal and Oil Services, and Todd Energy have all commissioned
Radnor underwent 12 hydraulic fracturing treatments.8 hydraulic fracturing treatments, while Origin/Contact have
purchased fields that have undergone hydraulic fracturing
Between 2001 and 2006 the hydraulic fracturing activity previously. All hydraulic fracturing services in the Taranaki
had an oil focus, while the more recent activities are region are provided by either BJ Services or Halliburton.9
primarily focused on gas.
Figure 2 Hydraulic fracturing in Taranaki by year, 1989 - 2011
Source: Taranaki Regional Council
6
(Taranaki Regional Council, 2012). Hydrogeologic Risk Assessment of Hydraulic Fracturing for Gas recovery in the Taranaki Region.
7
2011 only includes activity up to March.
8
Note that a well can be treated multiple times, so the amount of hydraulic fracturing treatments is not the same as the amount of wells that
have received treatmen
9
(Taranaki Regional Council, 2012, p. 16).
Unlocking the potential 13Solid Energy has undertaken hydraulic fracturing activity Hydraulic fracturing has been proven to allow extraction
in the Waikato region near Huntly. In 2007, Solid Energy of CSG from the Huntly coal field, which has similar coal
undertook four hydraulic treatments on four wells. In characteristics to Eastern Taranaki. Test wells have yielded
2011, they undertook hydraulic fracturing on four wells, a high quality gas containing 98 percent methane and just 1
total of six treatments. percent CO2.
Looking forward, it is expected that hydraulic fracturing It is highly unlikely that this CSG can be extracted
activity will increase, as operators seek to extend and economically without at least some hydraulic fracturing.
enhance productivity from existing wells. This is
particularly the case in onshore Taranaki, where much of Solid Energy has applied to New Zealand Petroleum and
the growth in gas production is in existing or new fields Minerals for a seven-year extension of its Taranaki permit
where hydraulic fracturing treatments have been used or to allow the CSG project to move to appraisal/discovery
are likely to be required to improve economic viability. phase.
It is less likely that hydraulic fracturing activity will extend
offshore, particularly over the next 10 to 20 years, mainly
due to the higher costs of offshore hydraulic fracturing What is Coal Seam Gas (CSG)?
procedures.
Coal Seam Gas is another form of indigenous natural
gas that can offset the declining production of New
Unconventional Plays
Zealand’s Maui gas field.
As well as hydraulic fracturing to extend production from
• It creates fewer greenhouse emissions than any other
conventional wells, hydraulic fracturing potentially makes
thermal energy.
it possible to economically extract gas from coal seams and
oil and gas from shale formations. • It supports distributed generation by potentially
contributing electricity to the national grid from
Coal Seam Gas (CSG) multiple points around the country, possibly avoiding
With CSG, permeability enhancement may, or may not expensive transmission upgrades.
be required depending on the geological situation. If • Electricity from CSG would provide base load
permeability enhancement is required, hydraulic fracturing generation to support further renewable electricity
is just one of the options available. All the options have generation projects.
limitations and situations when they work best. It is
unlikely that any significant CSG production will eventuate CSG’s significant potential is being recognised around
in New Zealand without hydraulic fracturing being at least the world — it already provides 15 percent of the USA’s
part of the operation. gas supply and close to 90 percent of Queensland’s
(Australia) gas supply.
In Eastern Taranaki, a contingent resource of 900PJ 2C of
CSG has been identified by Solid Energy.
14 Unlocking the potentialShale gas and oil TAG Oil and New Zealand Energy Company (NZEC) are
exploring oil-shale source rocks across the East Coast
Shale gas and oil refers to natural gas and oil that is frontier. The initial target is fractured oil shale, with
trapped within shale formations. Shales are fine-grained conventional prospects maintained as secondary targets.
sedimentary rocks that can be rich sources of petroleum
and natural gas. The potential oil production from the East Coast frontier
is very significant and will require high levels of capital
The combination of horizontal drilling and hydraulic investment.
fracturing has made the extraction of shale gas and oil
economically viable.
East Coast Basin Permits
TAG Oil
Unlocking the potential 15Method
Hydraulic fracturing improves the viability and ability to extract gas and oil from new
discoveries and existing wells.
Hydraulic fracturing enhances permeability, allowing Scenarios
fluids to flow to the well bore. The economic impacts are
therefore the additional: A number of oil and gas companies were asked to
provide their assessment of activity under each of the
• gas and oil produced, which: three scenarios. This included production, capital
expenditure and operational expenditure. These figures
• increases tax and royalty payments to government
were extrapolated out to provide aggregate production
• enables increased downstream activity around and expenditure flows over the next ten years. Where
feedstock, electricity generation and retail gas the associated condensate volumes produced alongside
gas production has not been provided by the operators
• improves energy security the volume is calculated based on historical ratios for that
field.10
• reduces energy prices.
All hydraulic fracturing activity to date has been onshore.
• jobs and GDP generated from It is unlikely that offshore hydraulic fracturing will occur
within the scenario timeframe. While the majority of
• hydraulic fracturing construction activity
hydraulic fracturing activity has focused on gas fields, there
• ongoing operations. are associated condensates extracted as well. Further, non-
conventional plays on the East Coast are targeting oil. The
The approach in this analysis is to identify changes in analysis does not consider offshore activity.
production, construction and operational activity under
a range of policy scenarios with regard to hydraulic Economic impact
fracturing activity. The analysis looks at three scenarios
over a ten year period from 2013 to 2022. The economic impact analysis is based on the earlier
framework developed for the Wealth beneath our Feet
1. Constrained (low) – Under this scenario, tighter report. In particular, this report is used for the level of
restrictions are placed on hydraulic fracturing activity. This expenditure that occurs in New Zealand and the split of
reduces the level of production as new activity is restricted that expenditure across industries.11
to fields where hydraulic fracturing are not required and
potential wells become less economic due to the inability Export revenue is based on production levels for oil and
to apply hydraulic fracturing treatments. gas. Natural gas and oil prices for the scenario are $7 per
GJ of natural gas and NZ$110 (US$90) per barrel of oil
2. Business as usual (BAU) – Under this scenario, the policy equivalent ( BOE) out to 2022. These prices are consistent
settings stay the same. Oil and gas companies are able with current oil and gas prices.
to undertake hydraulic fracturing activity through the
current consenting process. However, non-conventional Because there are different royalty regimes for when
plays, which are dependent upon hydraulic fracturing, do different fields were developed, and the application of
not occur because of uncertainty around the regulatory either accounting profit of 20 percent or five percent of
environment. revenues (whichever is greater), it is difficult to identify
exactly the likely royalties on a particular scenario. The
3. Non-conventional plays (BAU+) – This scenario includes analysis provides a high and low projection based on
activity from non-conventional plays including coal seam historical levels of production and royalties paid and likely
gas in South Taranaki and shale oil in the East Coast. activity going forward. The high projection is based on
11
(Venture Taranaki, 2010).
12
This is consistent with the estimated breakdown of expenditure identified in Wealth Beneath our Feet (Venture Taranaki, 2010).
10
Condensate is also referred to as ‘wet gas’ and is a mixture of light hydrocarbons that exist as a gas in underground reservoirs which
condense to form a liquid at atmospheric conditions. Condensates are used to make chemicals and other high-value oil products.
16 Unlocking the potentialroyalties of 15 percent of revenue, while the low projection Context
assumes royalties of 10 percent of revenues.
Most of the hydraulic fracturing treatments have occurred
All prices and dollar values are in New Zealand dollars and on onshore gas fields. This section discusses historical
are nominal. Historical prices and production activity are production of oil and gas and puts the level of activity from
taken from New Zealand Petroleum and Minerals data. those fields where hydraulic fracturing has occurred into
perspective.
For the economic impact analysis for Taranaki fields, 60
percent of capital expenditure is used, as it is considered
that 40 percent of expenditure goes directly offshore.12
Oil and Gas production in
However, in relation to East Coast production, the analysis New Zealand
is based on 80 percent of capital expenditure and 40 To compare oil and gas production they are both
percent of operational expenditure occurring in Taranaki, presented in term of petajoules (PJs), which is a measure
which is where the production capability and many of the of energy. Oil and gas production from 1974 to 2011 are
resources reside. This is relevant for the Taranaki economic shown in Figure 3.
impacts under the BAU+ scenario.
In relation to oil and gas production, gas accounted for
From the economic activity (expenditure) each year, direct, around 60 percent (in terms of energy produced in PJs) in
indirect and induced GDP and employment measures are 2011. However, oil production has increased significantly
calculated using multiplier analysis. These measures of since 2007. In 2006, gas accounted for close to 80 percent
activity are aggregated and then presented as an average of oil and gas produced in New Zealand.
annual impact over the next decade. In reality, much of
the activity, particularly in the BAU+ scenario, is likely to
occur in the latter half of the decade.
Figure 3 Net national oil and gas production (PJs), 1974 - 2011
Source: Ministry of Business, Innovation & Employment
Unlocking the potential 17Gas Production The first hydraulic fracturing treatment occurred in Kaimiro
in 1989, followed by Kapuni in 1993. Figure 6 shows
Gas production peaked in 2001, which was the height production from fields where wells have undergone
of Maui production. Production then declined, as Maui treatment against fields where treatment has not occurred.
output declined. Production by field is shown in Figure 4.
Note that the graphic does not suggest that hydraulic
A number of smaller fields have also been producing over fracturing was responsible for the total production from
that time although there has been a marked increase from those fields but rather represents the contribution of fields
the early 2000s. In terms of larger contributions, Pohokura where hydraulic fracturing has occurred. For example,
came on-stream in 2006, ramping up from 2007, and then only part of Kapuni and Kaimiro production came from
Kupe started contributing from 2010. treated wells, whereas all production from Mangahewa,
Turangi and Kowhai can be attributed to hydraulic
However, the majority of gas produced comes from
fracturing.
offshore fields as shown in Figure 5.13
Between 2006 and 2011, fields where wells have received
From 2007 to 2011, onshore fields have accounted for
hydraulic fracturing treatments accounted for between 23
around 28 to 30 percent of total gas production. Offshore
and 27 percent of total net gas produced.
gas initially came from the Maui field and, more recently,
Pohokura and Kupe. However, when considering gas production, fields where
hydraulic fracturing has occurred account for almost all
Onshore, Kapuni is the largest gas field, followed by
onshore production in 2011. This is shown in Figure 7.
Mangahewa and Turangi. A number of smaller fields,
including McKee, Kaimiro, Ngatoro, Kowhai, Rimu/Kauri,
Tariki, Waihapa, Ngaere, Cheal, Sidewinder, Surrey and
Manutahi contribute to onshore gas production.
13
Pohokura has been classed as an offshore field, although half of the wells and processing of gas occurs onshore.
18 Unlocking the potentialFigure 4 Net national gas production by field, 1974 - 2011
Source: Ministry of Business, Innovation & Employment
Figure 5 Net national gas production, onshore and offshore, 1974 - 2011
Source: Ministry of Business, Innovation & Employment
Unlocking the potential 19Figure 6 Net National Gas Production, treated vs. non-treated fields,
1974 - 2011
Source: BERL
* Production relates to fields where a well has received treatments as apposed to production from wells within fields that have
received treatments. The graphic does not present production dure to hydraulic fracturing.
Figure 7 Onshore net national gas production, treated vs. non
treated fields, 1974 - 2011
Source: BERL
* Production relates to fields where a well has received treatments as apposed to production from wells within
fields that have received treatments. The graphic does not present production dure to hydraulic fracturing.
20 Unlocking the potentialGas Production continued... been onshore targeting gas. While the dwindling supply
has been a major driver of this additional activity, the
As a result of the majority of activity occurring onshore, economics due to hydraulic fracturing has enabled further
combined with the unlikely prospect of offshore hydraulic production from these existing fields.
fracturing occurring in the short to medium term (the
scenario timeframe), the focus of the analysis is on onshore A total of 405 wells have been drilled between 1999 and
fields. 2011. Of these, around 80 percent have been drilled
onshore. In 2011, 52 wells were drilled, of which 96
Wells drilled percent were drilled onshore.
A significant proportion of well drilling in recent times has
Figure 8 Wells drilled 1999 - 2011, onshore vs. offshore
Source: New Zealand Petroleum & Minerals
Unlocking the potential 21Implications for New Zealand’s
economic future
22 Unlocking the potentialScenarios
This analysis uses a scenario approach, which allows us to compare the future onshore
activity of the New Zealand oil and gas sector under contrasting environments. Two
environments incorporate hydraulic fracturing into its activity (BAU and BAU+) and one
that does not (low).
Multiplier analysis shows the direct and total economic PJs. Onshore production then eases, with 133 PJs expected
impact of activity in the oil and gas sector in terms of to be produced in 2022.
expenditure, GDP and employment. The difference
between the low and high scenarios reflects the economic The low scenario sees production rise slightly to 2013 as
value of hydraulic fracturing to the economy. The analysis existing activity flows through to production. Production
looks at the impact on New Zealand and Taranaki. then falls consistently to 16PJ by 2022.
The BAU+ scenario sees solid growth as development
Summary projects, such as coal seam gas, get underway in Taranaki.
In 2011, onshore gas production was around 33 PJs. Under This ramps up from 2018 as oil production starts on the
each of the three scenarios, onshore production changed East Coast.
as shown in Figure 9.
The breakdown between oil and gas production is shown
Under the BAU scenario, production remains on a relatively in Figure 10 and Figure 11.
consistent path, with production peaking in 2018 at 154
Figure 9 Onshore oil and gas production scenarios to 2022, PJs
BAU+
BAU
Low
Source: BERL
Unlocking the potential 23There are relatively consistent projections for onshore gas Currently, much of the onshore oil production is a result
production under the BAU and BAU+ scenarios. Both the of condensate gathered as a result of gas production. The
BAU and the BAU+ scenarios see rapid growth to 2018 and change in condensate is therefore directly related to the
then an easing after that. The BAU scenario sees onshore change in gas production. However, under the BAU+
gas production at a slightly lower level than the BAU+ scenario, the development of the oil shale fields in the East
scenario from 2016. Under the low scenario there is lumpy Coast over the period to 2017 sees production ramp up
movement to 2014 before a consistent easing out to 2022. significantly independent of gas production from 2018.
Oil production activity, on the other hand is largely The economic impact of these production scenarios are
represented by the BAU+ scenario, as shown in Figure 11. presented individually in the next sections.
Figure 10 Onshore gas production scenarios to 2022, PJs
BAU+
BAU
Low
Source: BERL
Figure 11 Onshore oil production scenarios to 2022, PJs
BAU+
BAU
Low
Source: BERL
24 Unlocking the potentialScenario 1 – Low activity
A hydraulic fracturing moratorium is put in place, which bans all future hydraulic
fracturing activity. As a result no existing wells receive further hydraulic fracturing
treatments and few new wells are drilled onshore due to uncertainty around viability. Oil
and gas from current fields are extracted at 90 percent of the previous year until they are
exhausted. Fields where hydraulic fracturing is not required are developed as per normal.
Activity Economic Impact
Table 1 shows the production, revenue, royalties and Economic impact analysis is based on the proportion of
expenditure generated under the low activity scenario. capital expenditure (CAPEX) spent nationally and the total
OPEX, which equates to $980 million. The economic
Onshore natural gas production drops from 41PJs in impact on New Zealand is shown in Table 2.
2013 to 13PJs in 2022. Over the same period, onshore oil
production drops from 12PJs to 3PJs. Direct expenditure of $980 million over the ten year
period results in direct annual GDP of $45 million and
This results in a drop in revenue from just over $500 directly employs 392 FTEs. Adding indirect and induced
million in 2013 to $155 million in 2022. Royalties fall from effects results in total annual GDP of $111 million and the
between $50 and $75 million to between $15 million and employment of 1,025 FTEs.
$23 million. Oil and condensate exports average $125
million each year, although they drop from $217 million in Table 3 shows the economic impact of the low scenario on
2013 to $63 million in 2022. Expenditure drops from $149 the Taranaki region.
million to $88 million, largely due to a fall in operating
expenditure (OPEX). Direct expenditure of $980 million over the ten year
period results in direct annual GDP of $44 million and
directly employs 392 FTEs. Adding indirect and induced
effects results in total annual GDP of $68 million and the
employment of 614 FTEs.
Table 1 Summary of activity – scenario (Low)
Source: BERL
Table 2 New Zealand annual average Table 3 Taranaki annual average
economic activity 2013 - 2022 economic activity 2013 - 2022
Source: BERL Source: BERL
Unlocking the potential Unlocking the potential 25Scenario 2 – Business as usual (BAU)
Oil and gas exploration and activity continues along the current pathway. However,
developments outside of Taranaki that will likely require hydraulic fracturing do not
occur due to uncertainty around the consenting process. Similarly, non-conventional
plays, such as shale oil and coal seam gas are put on hold due to uncertainty.
Activity Economic Impact
Table 4 shows the production, revenue, royalties and Economic impact analysis is based on the proportion of
expenditure generated under the BAU scenario. CAPEX spent nationally and the total OPEX, which equates
to $2,875 million. The economic impact on New Zealand
Onshore natural gas production increases from 62PJs in is shown in Table 5.
2013 to 112 PJs in 2018. Production then eases to 96PJs in
2022. Over the same period onshore oil and condensate Direct expenditure of $2,875 million over the ten year
production increases from 19PJs in 2013 to 40PJs in 2019 period results in direct annual GDP of $131 million and
before easing to 37 PJs in 2022. directly employs 1,153 FTEs. Adding indirect and induced
effects results in total annual GDP of $326 million and the
This results in total revenue of $785 million in 2013, employment of 3,011 FTEs.
increasing to $1,520 million in 2019and easing to $1,341
million by 2022. Table 6 shows the economic impact of the BAU scenario on
the Taranaki region.
Royalties over the ten years are expected to be between
$1.3 billion and $2.0 billion. Exports of oil and Direct expenditure of $2,875 million over the ten year
condensates are $6.3 billion. period results in direct annual GDP of $130 million and
directly employs 1,152 FTEs. Adding indirect and induced
Expenditure as a result of activity averages $325 million effects results in total annual GDP of $201 million and the
over the ten years. employment of 1,804 FTEs.
Table 4 Summary of activity – scenario (BAU)
Source: BERL
Table 5 New Zealand annual average Table 6 Taranaki annual average
economic activity 2013 - 2022 economic activity 2013 - 2022
Source: BERL
Source: BERL
26 Unlocking the potentialScenario 3 – Non conventional plays (BAU+)
Hydraulic fracturing is accepted politically and publicly as a safe technique to extract gas
from conventional and unconventional plays. Hydraulic fracturing activity follows strict
guidelines and monitoring to ensure it is done appropriately. As a result, unconventional
plays, such as CSG and shale oil, are developed.
Activity Economic Impact
Table 7 shows the production, revenue, royalties and Economic impact analysis is based on the proportion of
expenditure generated under the BAU+ scenario. CAPEX spent nationally and the total OPEX, which equates
to $8,029 million for New Zealand and $3,459 million for
Onshore natural gas production increases from 63PJs in Taranaki. The economic impact on New Zealand is shown
2013 to 120 PJs in 2018. Production then eases to 101PJs in in Table 8.
2022. Over the same period onshore oil and condensate
production increases from 19PJs in 2013 to 369 PJs in 2022. Direct expenditure of $8,029 million over the ten year
period results in direct annual GDP of $365 million and
This results in revenue of just under $790 million in 2013, directly employs 3,221 FTEs. Adding indirect and induced
increasing to almost $7.5 billion in 2022. effects results in total annual GDP of $910 million and the
employment of 8,410 FTEs.
Royalties over the ten years are expected to be between
$3.2 billion and $4.8 billion. Exports of oil and Table 9 shows the economic impact of the BAU+ scenario
condensates are worth $25 billion. on the Taranaki region.
Expenditure as a result of activity averages $1.05 billion Direct expenditure of $3,459 million over the ten year
over the ten years. period results in direct annual GDP of $156 million and
directly employs 1,387 FTEs. Adding indirect and induced
effects results in total annual GDP of $242 million and the
employment of 2,170 FTEs.
Table 7 Summary of activity – scenario (Low)
Source: BERL
Table 8 New Zealand annual average Table 9 Taranaki annual average
economic activity 2013 - 2022 economic activity 2013 - 2022
Source: BERL Source: BERL
Unlocking the potential 27Economic Impact of Hydraulic
Fracturing
The economic impact of hydraulic fracturing over the 10 potential impact, where unconventional activity including
years to 2022 is represented by the difference between CSG and oil shales are included. The additional activity is
the low scenario, where there is no hydraulic fracturing represented by the shaded areas in Figure 12.
allowed; and the BAU scenario, where activity continues
within the current environment. The BAU+ scenario is a
Figure 12 Economic impact of hydraulic fracturing
BAU+
BAU
Low
Source: BERL
28 Unlocking the potentialBAU scenario level. These are shown in Table 11 and Table 12.
The activity generated by hydraulic fracturing is shown in For New Zealand, additional expenditure of $190 million
Table 10. each year over the next ten years would contribute $86
million to GDP and directly employ 761 FTEs annually.
Over the ten year period 2013 to 2022, the ability to
perform hydraulic fracturing activity could result in the Applying indirect and induced effects, GDP increases to
production of an extra 773PJs of gas and an extra 277PJs of $215 million and employment increases to 1,986 FTEs
oil and condensate. annually.
Over the ten year period, this additional production For Taranaki, additional expenditure of $190 million each
converts to additional: year over the next ten years would contribute $86 million
to GDP and directly employ 760 FTEs annually.
• revenue of $10.5 billion; and
Applying multipliers, GDP increases to $133 million and
• royalties of between $1.0 billion and $1.6 billion. employment increases to 1,190 FTEs annually.
The expenditure required to achieve that extra production
would have economic impacts at a national and regional
Table 10 Activity generated by hydraulic fracturing (BAU Scenario)
Source: BERL
Table 11 Economic impact of Table 12 Economic impact of
hydraulic fracturing on New Zealand hydraulic fracturing on Taranaki
Source: BERL Source: BERL
Unlocking the potential 29BAU+ scenario The expenditure required to achieve that extra production
would have economic impacts at a national and a regional
A second scenario, where non-conventional activity occurs level. These are shown in Table 13 and Table 14.
onshore suggests a significant upside to the economic
impacts of hydraulic fracturing. The difference between For New Zealand, additional expenditure of $705 million
the low and BAU+ scenarios are presented in Figure 13. each year over the next ten years would contribute $321
million to GDP and employ 2,829 FTEs annually.
Over the ten year period 2013 to 2022, the ability to
perform hydraulic fracturing activity could result in the Applying multipliers, GDP increases to $799 million and
production of an extra 809PJs of gas and an extra 1,293PJs employment increases to 7,386 FTEs annually.
of oil.
For Taranaki, additional expenditure of $248 million each
Over the ten year period, this additional production year over the next ten years would contribute $112 million
converts to additional: to GDP and employ 994 FTEs annually.
• revenue of $29.4 billion; and Applying multipliers, GDP increases to $174 million and
employment increases to 1,556 FTEs annually.
• royalties of between $2.9 billion and $4.4 billion.
Figure 13 Activity generated by hydraulic fracturing (BAU+ scenario)
Source: BERL
Table 13 Economic impact of Table 14 Economic impact of
hydraulic fracturing on New Zealand hydraulic fracturing on Taranaki
Source: BERL Source: BERL
30 Unlocking the potentialOther impacts
The economic impact analysis does not consider downstream activity that is enabled as a
result of access to gas. These include its use as feedstock in the production of methanol,
and the role gas plays in electricity generation.
Mangahewa Developments According to an earlier BERL report capital expenditure
by Todd energy over the seven-year development process
Todd Energy is expected to have spent a total of $760 is expected to contribute $274 million to the Taranaki
million over the seven year period to 2018 developing the economy and employ 1,064 FTEs.14 Once fully operational,
Mangahewa field. Hydraulic fracturing has occurred at a Mangahewa will contribute $9 million to GDP and create
number of wells in its Mangahewa field, which has resulted employment for 60 people annually. At a national level,
in major improvements in well productivity and extended capital expenditure would contribute $403 million and
the life of the field to 23 years. employ 1,356 FTEs, while operational activity would
contribute $14 million to GDP and employ 83 FTEs
Improved performance at this and other fields (Pohokura)
annually.
has supported a $75 million investment in a new LPG
plant at the McKee production station. The LPG plant has If Methanex were to run at full capacity, it would
a production capacity of 27,000 tonnes per year, which contribute a further $646 million in GDP and employ
is equivalent to around 15 percent of New Zealand’s LPG 4,100 people in New Zealand annually. The export value
needs. LPG is exported out of Taranaki to the rest of the of methanol would increase by 300 percent to over $1
North Island and parts of the South Island. billion.15
Additional gas has also enabled Todd Energy to sign a 10 This additional activity would have flow-on effects to Port
year security of supply agreement with Methanex, which Taranaki, which is a key strategic asset in the Taranaki
is one of New Zealand’s largest exporters. This agreement region. Methanol is currently the second largest product
has enabled Methanex to expand its own activity; with exported out of Port Taranaki and at full capacity would
the potential of increasing production by 100 percent (the potentially be the largest single product exported. This
2nd Motonui train was refurbished to accommodate the supports the viability and ability of Port Taranaki to provide
gas from Todd Energy). Methanex is looking at investing a full range of port services to businesses in the Taranaki
even further in increased production capacity and re- region and support the national transport infrastructure
commissioning the Waitara Valley plant. system.
14
(BERL, 2012). Todd Energy: Economic Impact of Oil and Gas Investment in Taranaki and Nationally.
15
(BERL, 2012). Economic Impact Analysis of Methanex 2012.
Unlocking the potential 31Natural Gas as an energy source for a number of days.17
Natural Gas is used for a variety of purposes – electricity Increased supply of natural gas can also result in lower-
generation, industry, residential and feedstock. This is in priced energy for New Zealand industries and consumers
contrast to Hydro and Geothermal. For Hydro, 100 percent making it less expensive to produce goods, heat homes
of supply is used to generate electricity. For Geothermal, and generate electricity.
93 percent of supply goes into generating electricity.
Similarly, 100 percent of renewables energy is converted Role of Gas in electricity
into electricity. generation
The majority of natural gas (one-third) is used to generate Gas is an important energy source within New Zealand
electricity. Industry is the second largest user, with 28 accounting for around 19 percent of energy supplied in
percent (and 12 percent which goes into co-generation). 2011 as shown in Figure 14.
Non-energy use, or feedstock accounts for around 15
percent of natural gas used, while residential, commercial Gas is New Zealand’s third largest energy source behind oil
and agriculture each account for less than five percent of and geothermal.
natural gas used.16
As well as being used directly by industry and residential
The role of natural gas in supporting industry was customers, gas is a key source of energy into electricity
highlighted with the disruption to the Maui Pipeline in generation. In 2011, 29 PJs of gas went into electricity
2011, where supply was interrupted to all businesses generation, accounting for around 18 percent of electricity
north of Waikato, including a number of major businesses, generated.
forcing them to close or significantly limit their operation
Figure 14 Total primary energy Figure 15 Electricity generated
supply, 2011 by fuel type, 2011
waste
heat;
2;
0%
hydro;
90;
11%
gas;
159;
19%
Gas;
28.6
;
18%
geothermal;
159;
20%
Coal;
7.3
;
5%
Hydro;
Wind;
7.0
;
4%
89.4
;
58%
Wood;
1.3
;
1%
Biogas;
0.8
;
1%
other
renewable;
71;
oil;
276;
34%
9%
Geothermal;
20.8
;
13%
coal;
61;
7%
Source: New Zealand Petroleum & Minerals Source: Energy Data File 2012
16
(Ministry of Economic Development, 2012). New Zealand Energy Data File 2012.
17
Such as the Chelsea sugar refinery, Tip Top Ice-cream Factory and Goodman Fielder bakeries, Fonterra, Sanitarium, Lion Breweries.
32 Unlocking the potentialYou can also read


