Bristol City Council Clean Air Local Plan: Assessment of Charging Measures Against Secondary Critical Success Factors - Bristol City Council
←
→
Page content transcription
If your browser does not render page correctly, please read the page content below
Bristol City Council Clean Air Local
Plan: Assessment of Charging
Measures Against Secondary Critical
Success Factors

Prepared for

Bristol City Council

05 April 2018
Contents
Introduction ........................................................................................................................................ 2
       1.1       Overview ............................................................................................................................. 2
       1.2       Options ................................................................................................................................ 2
       1.3       Critical Success Factors and Evaluation Criteria ................................................................. 4
Strategic Evaluation Criteria ................................................................................................................ 5
       2.1     Evaluation Criteria 1: Deliver compliance with NO2 air quality Limit Values and Air
               Quality Objectives in the shortest possible timescales ...................................................... 5
       2.2     Evaluation Criteria 2: Provide equity across different vehicle type and trip purpose........ 5
       2.3     Evaluation Criteria 3: Compliance with the CAZ framework, including minimum
               requirements ...................................................................................................................... 5
Economic Evaluation Criteria............................................................................................................... 7
      3.1     Evaluation Criteria 4: Mitigate financial impact on low income households ..................... 7
      3.2     Evaluation Criteria 5: Improve health of low income households ..................................... 9
      3.3     Evaluation Criteria 6: Economic effect................................................................................ 9
      3.4     Evaluation Criteria 7: Improve public health .................................................................... 11
Commercial Evaluation Criteria ......................................................................................................... 12
     4.1     Evaluation Criteria 8: Delivery timescale risks of procurement ....................................... 12
Financial Evaluation Criteria .............................................................................................................. 13
       5.1     Evaluation Criteria 9: Likelihood of CAZ charges revenue equating to implementation /
               operational costs .............................................................................................................. 13
       5.2     Evaluation Criteria 10: Upfront capital required for scheme ........................................... 13
       5.3     Evaluation Criteria 11: Risk of financial penalty to the Council/s ..................................... 14
Management Evaluation Criteria ....................................................................................................... 15
     6.1    Evaluation Criteria 12: Public acceptability ...................................................................... 15
     6.2    Evaluation Criteria 13: Political acceptability ................................................................... 15
Summary .......................................................................................................................................... 15

Appendices
Appendix A 2015 Measured Annual Mean NO2
Appendix B Changes in emissions from CAZ Class D
Appendix C Socio‐economic Mapping

Table(s)
Table 1‐1: Evaluation Criteria........................................................................................................................ 4
Table 3‐1: CAZ impacts on low‐income households, car ownership patterns .............................................. 8
Table 3‐2: CAZ impacts on low‐income households, journey to work patterns ........................................... 9
Table 3‐3: Summary of jobs and GVA within each geographical boundary ............................................... 11
Table 5‐1: Summary of ANPR cameras required and approximate capital costs ....................................... 14
Table 7‐1: Scoring of Charging Measures against Evaluation Criteria .......................................................... 1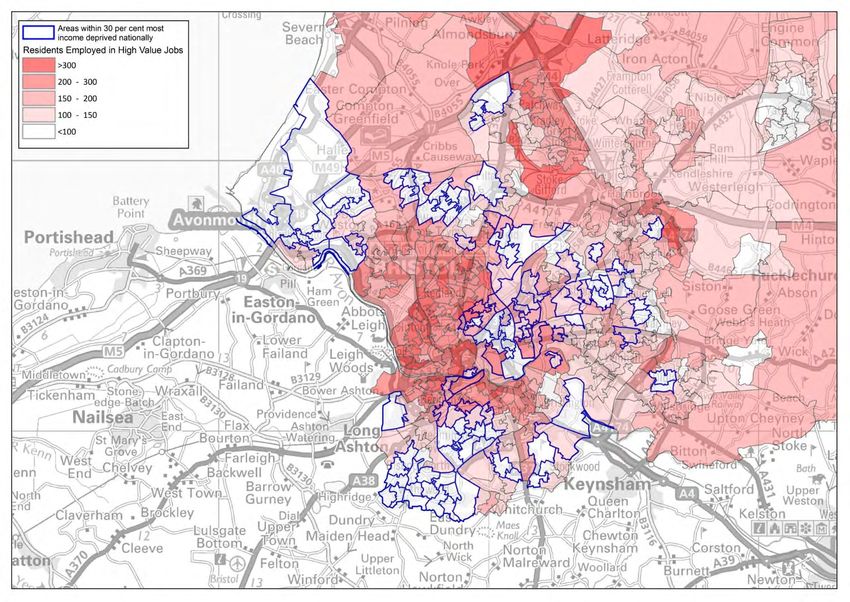
CONTENTS

Figure(s)
Figure 1‐1: Initial CAZ geographies ............................................................................................................... 3
Figure 3‐1: Distribution of low‐income households across Bristol and the West of England (source:
Indices of Multiple Deprivation, 2015) ......................................................................................................... 8
Figure 3‐2: Distribution of employment across Bristol and the West of England (source: Business Register
and Employment Survey, 2015) .................................................................................................................. 10
Document history
673846.CD.55.01 Bristol City Council Clean Air Local Plan: Assessment of Charging Measures Against
Secondary Critical Success Factors

This document has been issued and amended as follows:

  Version       Date      Description          Created by            Verified by        Approved by
   1        18/12/2017     Draft         Chris Bushell, Clare         Becky Lloyd       Bruce Slattery
                                         Beattie (AQC), Karan
                                         Monga, Stephen
                                         Alexander

   2        09/02/2018     Final Draft   Chris Bushell, Luke          Becky Lloyd       Bruce Slattery
                                         Farrugia, Clare Beattie
                                         (AQC), Karan Monga,
                                         Stephen Alexander

   3        26/02/2018     Final         Chris Bushell, Luke          Becky Lloyd       Bruce Slattery
                                         Farrugia, Clare Beattie
                                         (AQC), Karan Monga,
                                         Stephen Alexander

   4        05/04/2018     Final         Chris Bushell, Luke          Becky Lloyd       Bruce Slattery
                                         Farrugia, Clare Beattie
                                         (AQC), Karan Monga,
                                         Stephen Alexander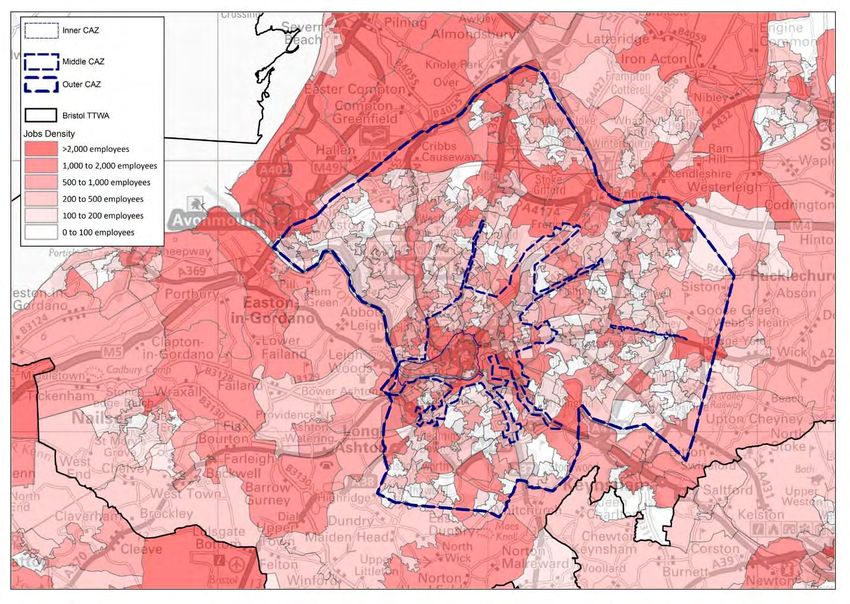
Introduction
1

1.1 Overview
Due to forecast air quality exceedances Bristol City Council has been directed by the Defra to
produce a Local Plan to achieve air quality improvements in the shortest possible time. As part of the
Local Plan, Bristol City Council is considering implementation of a Clean Air Zone (CAZ), including
both charging and non‐charging measures. CH2M has been commissioned by Bristol City Council
(BCC) produce a Strategic Outline Case for the delivery of a package of measures which will bring
about compliance with the European Limit Value for annual mean nitrogen dioxide in the shortest
time possible in Bristol.
The Economic Case of the Strategic Outline Case (SOC) considers a long list of potential options and
refines them to a short list of packages, to be assessed in greater detail in the Outline Business Case.
To support the assessment of the long list of options, this report provides justification for the scoring
of the charging measures proposed against the defined evaluation criteria.

1.2 Options
Charging options considered include all possible combinations of five geographical scopes and four
charging classes of CAZ.
The five geographical scopes of the project include:
1. Large ‐ the Bristol urban area within the boundary of the M4 and M5 and excluding areas within
   B&NES and NSC.
2. Medium ‐ BCC AQMA
3. Medium ‐ BCC & SGC AQMA combined
4. Medium ‐ BCC & SGC AQMA separate
5. Small ‐ within the Inner Ring Road

Figure 1‐1 shows the boundary of each zone assessed. These are anticipated to evolve throughout
the length of the study.
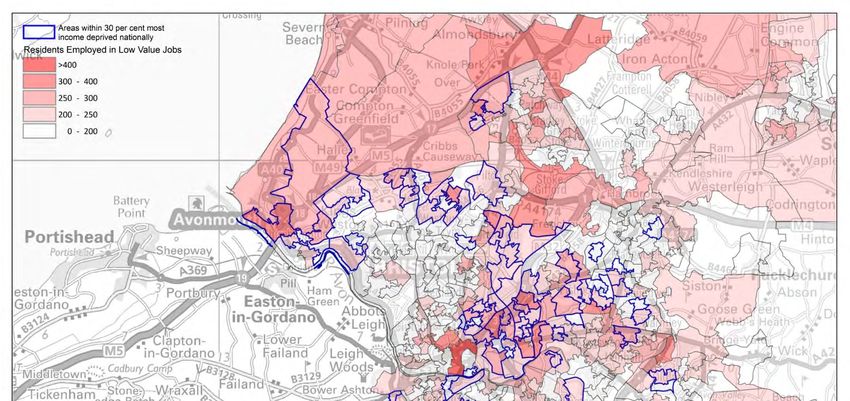
Figure 1‐1: Initial CAZ geographies

The CAZ classes assessed are as defined in the Defra/DfT’s Clean Air Zone Framework. The
framework sets out which vehicles are affected by each CAZ class and what the minimum Euro
standards are for each vehicle type. The four CAZ classes include:
1.   Class A charging – buses, coaches, taxis, private hire vehicles
2.   Class B charging – buses, coaches, taxis, private hire vehicles and HGVs
3.   Class C charging – buses, coaches, taxis, private hire vehicles, HGVs and LGVs
4.   Class D charging – buses, coaches, taxis, private hire vehicles, HGVs, LGVs and cars
All potential combinations of the five geographic scopes and four CAZ charging classes results in a
long list of twenty charging options for the project.
1.3 Critical Success Factors and Evaluation Criteria
In total thirteen evaluation criteria have been defined against which to assess the potential options.
The list of evaluation criteria includes a primary Critical Success Factor (CSF), deliver compliance with
NO2 air quality Limit Values and Air Quality Objectives in the shortest possible timescales, and
twelve secondary CSFs. The evaluation criteria are summarised in Table 3‐2.
Table 1‐1: Evaluation Criteria

 Cases             ID    Evaluation Criteria                                                    Priority
                         Deliver compliance with NO2 air quality Limit Values and Air Quality
                   1                                                                            Pass/Fail
                         Objectives in the shortest possible timescales
 Strategic          2    Provide equity across different vehicle types and trip purposes        Low
                    3    Compliance with the CAZ framework, including minimum requirements      High
                   4     Mitigate financial impact on low income households                     Very High
                    5    Improve health of low income households                                Very High
 Economic
                    6    Economic effects                                                       Medium
                    7    Improve public health                                                  Very High
 Commercial        8     Delivery timescale risks of procurement                                Low
                   9     Likelihood of revenue equating to implementation/operational costs     n/a
 Financial          10   Upfront capital required for   schemeError! Bookmark not defined.      n/a
                    11   Risk of financial penalty to the Council/s                             Low
                   12    Public acceptability                                                   Medium
 Management
                    13   Political acceptability                                                Medium

The primary CSF, evaluation criteria 1, is scored on a pass or fail basis. For all other evaluation
criteria, a scoring system was devised for the option assessment which provides a score of High (3),
Medium (2) or Low (1) for each option. The options have been scored relatively within each
evaluation criteria; a low score does not necessarily indicate a negative impact, just that of all the
options considered it is among the worst performing (and vice versa for high).
Each evaluation criteria was given a priority level of either Low (1), Medium (2), High (3), or Very
High (4) based on judgement of their importance. These priority scores were multiplied with the 1‐3
score to give an overall weighted score for each option. The priority score of each criteria is
summarised in Table 1‐1.
The legal test which was set out by the High Court in November 2016 in R (ClientEarth) (No2) V
Secretary of State for Environment Food and Rural Affairs [2016] EWHC 2740 (Admin) confirms that
when selecting measures to tackle air quality exceedances, the determining factor must be which
measure will achieve compliance in the shortest time. The test also indicates that only where two
measures are equally timely and effective can considerations such as cost be taken into account.
Hence, no assessment is undertaken for the Financial Evaluation Criteria 9 and 10 as part of the
shortlisting of options. The shortlisted options which meet compliance in the shortest possible time
and perform better than other alternatives have been appraised across these criteria and the
analysis is presented in the Financial Case chapter of the SOC.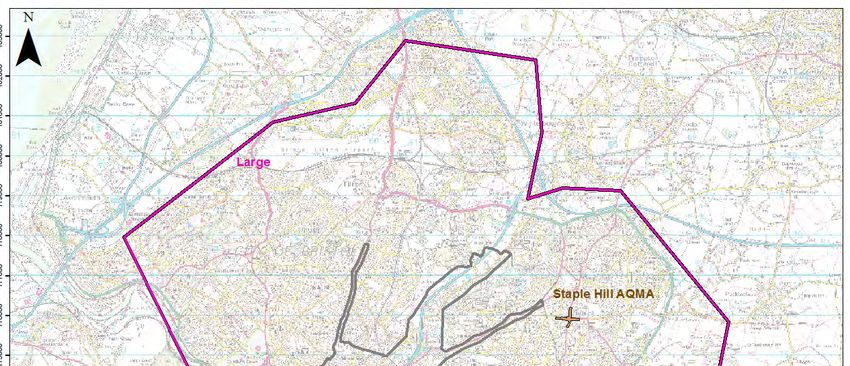
Strategic Evaluation Criteria
2
2.1 Evaluation Criteria 1: Deliver compliance with NO2 air
quality Limit Values and Air Quality Objectives in the
shortest possible timescales
The assessment of the options against this evaluation criteria, the primary CSF, is not provided in this
report. It is summarised within the Economic Case of the SOC, and is reported in detail in ‘Bristol City
Council Clean Air Local Plan: Transport and Air Quality Compliance Timescales, Assumptions and
Calculations’, December 2017. The primary CSF test reduced the list of charging options to the
following;
Medium (BCC AQMA) geography, CAZ Class C – charging
Medium (BCC AQMA) geography, CAZ Class D – charging
Medium (BCC & SGC Kingswood‐Warmley AQMA combined) geography, CAZ Class C – charging
Medium (BCC & SGC Kingswood‐Warmley AQMA combined) geography, CAZ Class D – charging
Medium (BCC & SGC Kingswood‐Warmley AQMA separate) geography, CAZ Class C – charging
Medium (BCC & SGC Kingswood‐Warmley AQMA separate) geography, CAZ Class D – charging
Small geography, CAZ Class C – charging
Small geography, CAZ Class D – charging
These options are assessed against the remainder of the evaluation criteria within this document.
2.2 Evaluation Criteria 2: Provide equity across different
vehicle type and trip purpose
The assessment of each charging CAZ option against this evaluation criteria has focused on the
vehicle types included and the likely trip purposes of these vehicles. Clearly, the more vehicle types
included within a CAZ, the greater equity is achieved, and so a Class C CAZ scores poorly in
comparison to a Class D.
Both Class C and D zones include buses, coaches, taxis, private hire vehicles and goods vehicles. This
is anticipated to primarily affect leisure trips or business related trips but also some commuting
trips. In particular, the inclusion of LGVs may disproportionately impact small and medium sized
businesses who rely on the use of their vehicles to operate their business. A Class D CAZ includes all
vehicle types and hence has the most equitable impact.
2.3 Evaluation Criteria 3: Compliance with the CAZ
framework, including minimum requirements
The ‘DfT/Defra Clean Air Zone Framework’, May 2017, sets out the classes and standards of charging
CAZ that would be acceptable for implementation. All CAZ options assessed apply one of these CAZ
Classes and as such are in compliance with this part of the Clean Air Zone Framework.
In addition, the Clean Air Zone Framework sets out minimum requirements which any CAZ should
meet including the expectation that it should ‘be in response to a clearly defined air quality problem,
seek to address and continually improve it and ensure this is understood locally’. The Framework
also states that ‘A Clean Air Zone designed in line with the principles in this framework will give an
additional advantage to an authority bidding for competitive central government funding’. Hence,
any CAZ which is not in compliance with the minimum requirements reduces the likelihood of
central funding being obtained.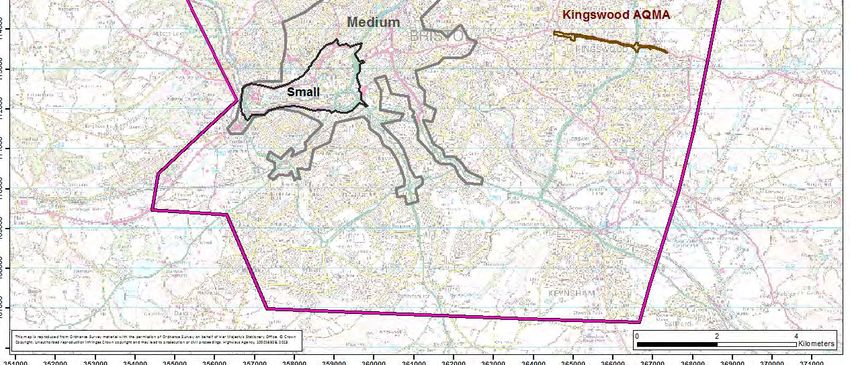
The medium geographies are defined by the AQMA boundaries and therefore are clearly in response
to an existing air quality problem, complying with the Clean Air Zone Framework minimum
requirements. Similarly, the smallest geographical boundary is a subsection of the medium one and
hence only includes areas where there is an evidenced air quality issue.
The level of exceedance above the Limit Values and Air Quality Objectives in the South
Gloucestershire’s AQMAs is not large in comparison to many measurements in Bristol city centre.
The PCM model predicts that by 2020 compliance with the Limit Values will be achieved in these
locations without intervention, through the gradual improvement of the vehicle fleet. Analysis of the
local monitoring locations also suggests that compliance with the National Air Quality Objectives will
be achieved in these locations by 2020. The implementation of measures within Bristol city centre
would further improve the NO2 concentrations by improving the fleet of traffic travelling through the
SGC AQMA’s.
The inclusion of the SGC AQMA’s (either as a separate or combined zone) within the medium zone is
therefore not required to achieve compliance with the Limit Values or the Air Quality Objectives.
Their inclusion is not in response to clearly defined air quality problem and hence these options are
not in compliance with the minimum requirements.
Economic Evaluation Criteria
3
3.1 Evaluation Criteria 4: Mitigate financial impact on low
income households
Implementation of CAZ has the potential to disproportionately penalise vulnerable groups in society,
depending on the geographic location, scale and the structure of vehicle compliance standards. In
line with HM Treasury Green Book recommendations, any public‐sector intervention must consider
the differential impacts of proposals on vulnerable groups, including low income groups.
For the purpose of this study, low‐income groups are defined as those communities in Bristol that
fall within the bottom 30% of lower super output areas (LSOAs) nationally in terms of income
deprivation. Various indicators reveal that such low‐income groups are economically disadvantaged
across a number of metrics and could be particularly susceptible to the introduction of CAZ charging.
From an occupational status perspective, residents in low income areas have a higher tendency
(38%) to work in unskilled professions/low value occupations (e.g. administrative, primary activities,
sales). This is significantly higher than the proportion of residents working in similar occupations
across the rest of Bristol/South Gloucestershire (25%). The reverse is the case for high value
occupations (e.g. managerial, senior, associate occupations), with 31% of residents in low income
areas employed in such occupations compared to 46% elsewhere. The contrast between low and
high value jobs undertaken by residents within the low‐income areas and residents outside is
demonstrated in the Figures C.1 and C.2 in Appendix C to this report.
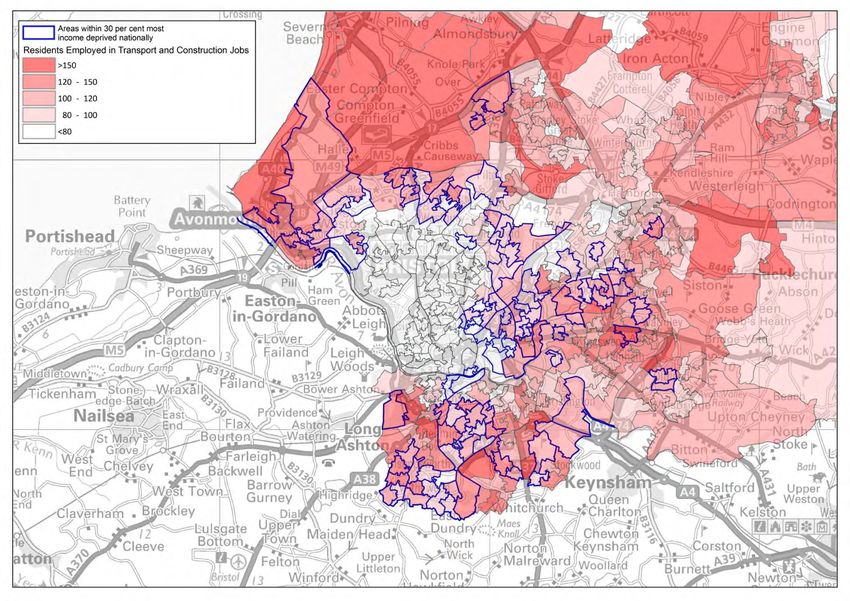
At the same time, a disproportionately high number of residents in low‐income areas are employed
in the transport and construction industries (5% and 8% respectively, compared to 4% and 7% for
residents across other areas in Bristol and South Gloucestershire). This is demonstrated in Figure C.3
appended to this report. Employees in these sectors typically require access to or use of a vehicle to
perform day‐to‐day tasks. This increases their exposure to public health issues resulting from
emissions but also implies they are more likely to be exposed to CAZ charges, particularly if working
for small businesses or as self‐employed workers which is common in the transport and construction
sectors.
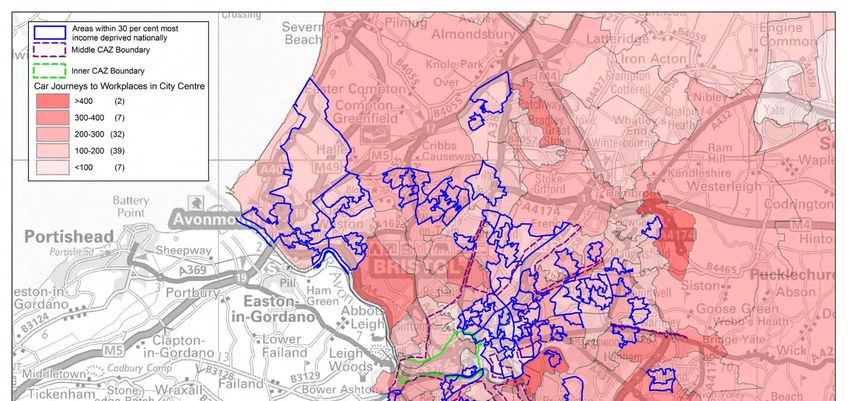
Further, Journey to Work data reveals 51% of all commuting trips from low‐income areas are made
as car drivers, rising to 58% when taxi and car passenger modes are also included. This implies a
significant proportion of commuters from low‐income areas could be exposed to CAZ charges. Figure
C.4 appended to this report demonstrates that some low‐income areas provide a significant number
of car driver commuters to Bristol city centre specifically.
In light of these indicators, it is appropriate to consider the differential impacts of the various CAZ
options on low income groups in particular.
The primary focus of equality and social inclusion is around how affordable the scheme will be for
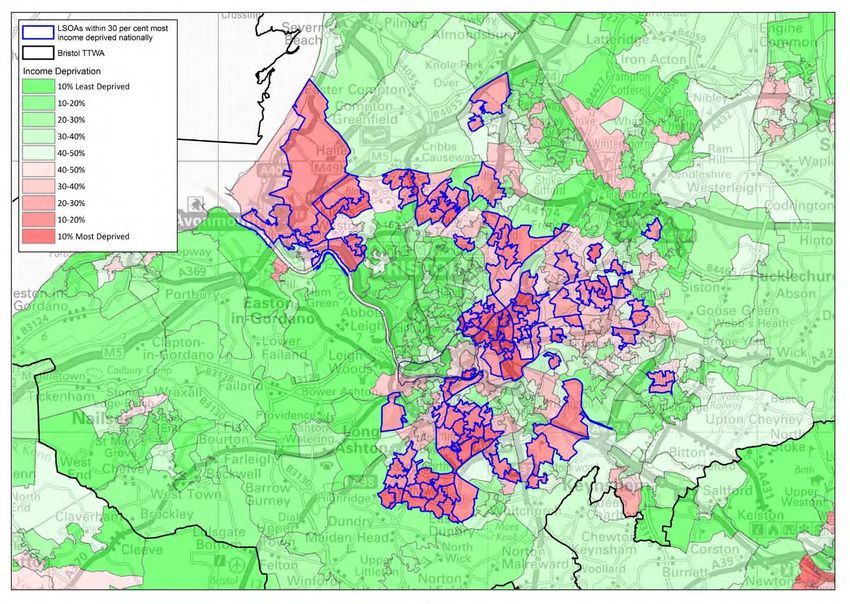
low income groups in Bristol and South Gloucestershire. Firstly, the distribution of low income
groups in Bristol has been determined through analysis of the Indices of Multiple Deprivation (2015)
‘Income Domain’ to demonstrate which CAZ geographies incorporate specific concentrations of
income‐deprived communities. Figure 3‐1 maps the distribution of low income households, and
demonstrates that whilst Bristol and the wider West of England region is considered to be a
relatively affluent location in the UK, there are significant areas with high levels of income
deprivation, particularly to the north and north west of Bristol City Centre and South Bristol in
general. Indeed, 39% of all LSOAs in Bristol fall within the bottom 30% of LSOAs nationally, based on
income deprivation. These areas lie within the ‘Medium’ and the already discounted ‘Large’ CAZ
geographies, suggesting that a higher proportion of low‐income households are likely to be affected
by these options that propose wider boundaries.Figure 3‐1: Distribution of low‐income households across Bristol and the West of England (source: Indices of
Multiple Deprivation, 2015)
Where low‐income groups are disproportionately exposed to a CAZ, residents may suffer from
affordability issues. Affordability issues are likely to be a material factor under Class D CAZ options,
as a significant proportion of private vehicles will not be compliant with CAZ rules under such
conditions and will therefore be charged.
Analysis of car ownership and fleet statistics in low‐income areas reveals that a high proportion,
37%, of households do not own a car, compared to 23% across Bristol and South Gloucestershire as
a whole and 18% in the non‐low income areas. That said, it is anticipated that for those low‐income
households that do own a car, a higher proportion of vehicles will be uncompliant with the Class D
regulations for the clean air zones (i.e. Euro 4+ Petrol, Euro 6 Diesel) since older vehicles are less
costly. Hence car owners in the low‐income areas are more likely to be impacted by CAZ proposals as
more of their vehicles would not be compliant with standards. Moreover, those within the low‐
income areas may not be able to afford to purchase a compliant vehicle. Therefore, existing car
owners in low‐income areas are likely to be disproportionately penalised by CAZ proposals.
These findings are borne out by 2011 Census data reported in Table 3‐3 which demonstrates that
the quantum of low‐income households who own cars increases in absolute terms and as a
proportion of all car‐owning households as CAZ geographical boundaries extend. This suggests that
more low‐income households could suffer from affordability issues under options that propose a
wider geographical extent for the CAZ.
Table 3‐1: CAZ impacts on low‐income households, car ownership patterns
Low‐Income As % of All
Geography All Hholds with Total Low Hholds with As % of All Low Hholds with
All Hholds Cars Income Hholds cars Income Hholds Cars
Small CAZ 53,189 34,898 15,355 8,898 58% 25%
Medium CAZ 203,395 158,356 77,642 56,798 73% 36%Similar patterns are found when analysing journey to work data for low‐income groups in Bristol.
The quantum of low‐income commuters who travel to work as car drivers increases in absolute
terms and as a proportion of all car‐owning households as CAZ geographical boundaries extend. As
above, this suggests that more low‐income households could suffer from affordability issues
surrounding the commuting patterns under options that propose a wider geographical extent for the
CAZ.
Table 3‐2: CAZ impacts on low‐income households, journey to work patterns
Low‐Income Low Income BCC/SGC Jtw:
Geography Low‐Income JTW: Car JtW: Car Driver BCC/SGC JtW: BCC/SGC JtW: Car Driver
JtW: All Modes Drivers Mode Share All Modes Car Drivers Mode Share
Small CAZ 531 147 28% 5,888 1,541 26%
Medium CAZ
21,663 7,997 37% 52,322 19,300 37%
(Bristol)
As a result, the best performing options from the perspective of minimising equality and social
inclusion issues are those options which propose a smaller geography and those options that do not
seek to extend the CAZ charge to private vehicles (i.e. all Classes other than D).
3.2 Evaluation Criteria 5: Improve health of low income
households
To evaluate the effect of reduced emissions on public health, the annual emissions of NOx within
each CAZ was assessed to understand the potential for reductions in ambient concentrations and
human exposure. Options which cover a larger geographical area, and restrict a greater proportion
of the vehicle fleet, will provide the greatest benefits in terms of public health. However, the analysis
in the previous section of this report highlights that low‐income households are likely to be
disproportionately exposed to pollutants due to the types of vehicles they drive, the locations in
which they live and the type of jobs that they undertake. To capture this impact, the public health
effects of each option on low income households has been assessed separately to general public
health impacts.
3.3 Evaluation Criteria 6: Economic effect
A CAZ has the potential to have significant impacts on Bristol’s economy. Evidence from congestion
zones and other forms of charging in other locations (e.g. London) suggest that implementation of
such schemes can have a range of positive and negative implications on local economies. Overall,
London’s experience with its congestion zone suggests a broadly neutral impact of the scheme on
economic and business activity once all positive and negative effects are combined. Given the
complex economic impacts reported elsewhere and the distinct range of options proposed for
Bristol’s CAZ, it is appropriate to consider how each option could complement or weaken the local
economy in Bristol.
Two broad types of economic impacts are considered in this assessment:
Transport economic efficiency impacts: related to journey time, delay and reliability
enhancements.
‘Real’ Economy Impacts: related to safeguarding existing economic activity and promoting
economic development to unlock new additional economic activity.Transport economic efficiency analysis is typically undertaken as part of conventional WebTAG‐ compliant economic appraisal for transport business cases. For this project, such detailed analysis is not proposed until short‐listed options are taken forward to the next stage. Therefore, to inform the shortlisting process, a high‐level review of modelling outputs describing network‐wide performance under each option has been undertaken to identify which options have the potential to support enhancements to transport economic efficiency most significantly. This review, combined with CH2M’s professional experience, indicates that vehicle delay/journey times/congestion would be lowest where the CAZ is implemented over the widest geographical area. Similarly, these metrics are likely to be most favourable where a wider definition of vehicles are subjected to CAZ charging. The volume of traffic and non‐compliant road‐users would increase as geographic scale and types of vehicle targeted increases. As such, options with wider coverage would have the largest impact in terms of reducing congestion and improving journey times, vehicle delay and reliability. ‘Real’ economy impacts relate to change in metrics such as the number of jobs and gross value added (GVA), which are key indicators of economic activity and economic growth. Such impacts are increasingly being considered within the strategic case of transport business cases rather than being formally incorporated into DfT‐compliant economic appraisals. The assessment of potential real economy impacts across CAZ options is underpinned by the assumption that implementation of CAZ could reduce the attractiveness of Bristol as a location to work and do business. Figure 3‐2 presents the distribution of jobs across Bristol and the wider West of England sub‐region. The mapping demonstrates high concentrations of employment in Bristol City Centre, which will feature in all CAZ geographical extents. Further, there are other significant, localised areas of high employment distributed across the sub‐region which feature prominently in the medium CAZ area. Figure 3‐2: Distribution of employment across Bristol and the West of England (source: Business Register and Employment Survey, 2015) Within this context, it is unsurprising that the scale of existing economic activity potentially affected by CAZ boundaries increases with geographic coverage of CAZ, as shown in Table 3‐3. The analysis demonstrates that nearly all economic activity in Bristol local authority area and a significant portion of economic activity in South Gloucestershire could be affected by implementation of the CAZ.
Table 3‐3: Summary of jobs and GVA within each geographical boundary
Geography Jobs GVA (per annum)
Small CAZ 57,595 £3,456,726,563
Medium CAZ (Bristol) 139,025 £7,932,400,889
Medium CAZ (Bristol & Kingswood‐Warmley) 147,010 £8,344,671,360
Taken together, this evidence suggests that from a ‘real’ economy impacts perspective, those
options which propose a tighter geographical boundary and minimise the potential for vehicle non‐
compliance are likely to pose less of a threat to existing and future economic activity in Bristol.
As noted, the case study evidence from London suggests that the net effect of congestion charges
and similar interventions on economic activity is neutral overall. This is borne out in the high level
analysis above, which suggests there may be a trade‐off between transport economic efficiency
impacts and ‘real’ economy impacts, with those options that induce improvements to transport
economic efficiency potentially putting ‘real’ economy metrics (jobs/GVA) at risk and vice versa. In
effect, schemes with a wider geographical coverage and wider definition of vehicles subject to the
CAZ charging could lead to most beneficial impacts in terms of journey time savings but the most
detrimental impacts from an employment and GVA uplift perspective. Conversely, schemes with a
narrow geographical coverage and narrow definition of vehicles subject to the CAZ will have more
limited positive effects on journey times and congestion, but a more limited negative impact on the
attractiveness of Bristol as a place to do business also.
3.4 Evaluation Criteria 7: Improve public health
There are two core elements to the assessment of public health impacts:
Impacts associated with changes in air quality/emissions;
Impacts associated with mode shift to sustainable travel modes.
To evaluate the effect on public health with reductions in emissions, the exposure to air pollutants
(NO2 and PM10 and PM2.5) are assumed to be directly related to the gross emissions from vehicles.
Health experts now believe that there is no threshold for harm from NO2 and particulate matter and
hence the EU Limit Value or national Air Quality Objectives have less significance here.
Improvements in public health are anticipated with reduced emissions regardless of compliance with
the legal standard. To evaluate the options, the annual emissions of NOx within each CAZ was
assessed to understand the potential for reductions in ambient concentrations and human exposure.
Options which cover a larger geographical area, and restrict a greater proportion of the vehicle fleet,
will provide the greatest benefits in terms of public health.
The health impacts associated with mode shift have been estimated based on transport modelling
outputs which predict the extent of mode shift to sustainable transport induced across each option.
In particular, the analysis focusses on mode shift to walking and cycling, which has positive health
impacts by increasing physical activity, resulting in reduced risk of premature death and reduced
absenteeism from work. The scale of uplift in these modes can act as a proxy for the health impacts
of an option, with greater uplift in walking and cycling associated with greater health impacts.
The transport modelling demonstrates that those options with wider coverage in terms of
geographic extent and inclusion of vehicle types (i.e. Large CAZ and Vehicle Class D options), will
achieve the greatest level of mode shift to walking and cycling. This is because greater volumes of
traffic will be affected by CAZ under these conditions, inducing a greater degree of mode shift.Commercial Evaluation Criteria
4
4.1 Evaluation Criteria 8: Delivery timescale risks of
procurement
A significant commercial risk for a CAZ is the ability to deliver an effective service for monitoring and
managing of the CAZ within a defined timescale. This risk exists for all proposed charging CAZ
options and relies upon adopting a suitable approach to design, procurement, supplier selection and
implementation of the chosen solution. Currently, monitoring of a CAZ can only be done effectively
through the use of technology, specifically that which identifies the vehicle registration mark (VRM,
commonly known as the ‘number plate’) of all vehicles entering and/or moving within the CAZ.
The procurement approach for the CAZ is likely to be the same, or similar, regardless of the chosen
CAZ option and is discussed further in the Commercial Case. The key determining factors for risks
related to procurement and installation of an ANPR system within the identified timescale are the
number of ANPR cameras required and the associated signage and road markings to be installed.
The central system, being largely unaffected by the extent of the CAZ, is less of an issue in terms of
deliverability. The larger the number of ANPR cameras needed, and the greater volume of signage
required, the longer time period will be needed for:
CAZ system designers to determine locations and provide designs for each boundary and intra‐
zone ANPR camera and all associated road signage and road markings;
CAZ system supplier(s) to manufacture and supply the ANPR cameras;
CAZ system supplier(s) (or the camera installer(s), if different) to install, test and commission the
cameras;
road signage suppliers to manufacture and supply the required signage; and
civils works contractors to install signage and road markings, as well as any other associated
physical changes to the road network (e.g. road/junction realignment, barriers).
Each of the identified CAZ areas was examined to determine the extent of roadside equipment (i.e.
ANPR cameras) and road signage/markings needed to provide effective monitoring of vehicles
entering and moving within the CAZ, and to ensure that drivers were made aware when they were
about to enter the CAZ or were inside it. A direct correlation was then made between the volume of
cameras and road signage/markings needed and the delivery risk whereby the greater the volume
needed, the greater the risk.
It was determined that the small CAZ required the lowest volume of cameras and road
signage/markings from all options and therefore carries the lowest delivery risk. In comparison, the
medium zones require a considerable volume of cameras and road signage/markings and therefore
could carry a considerably higher delivery risk. It is noted that the AQMA boundary could be further
refined to produce a more logical boundary for a CAZ, and reduce the number of cameras required.
This will be considered within the OBC if the medium charging option is progressed for further
assessment.Financial Evaluation Criteria
5
5.1 Evaluation Criteria 9: Likelihood of CAZ charges
revenue equating to implementation / operational
costs
Defra’s Clean Air Zone Framework states that the level of charging for a CAZ should not be set in
order to raise revenue, however any excess revenue above the costs of operation should be ‘re‐
invested to facilitate the achievement of local transport policies and these should aim to improve air
quality and support the delivery of the ambitions of the zone’. This is interpreted as any additional
revenues received above the operating and maintenance costs for CAZ could be used by the Council
to pursue other ‘Clean Air’ initiatives that are outside of the compliance criteria of the CAZ scheme.
Currently, detailed revenue modelling has not been undertaken. However, initial qualitative
assessment for charging elements of shortlisted options suggests that:
Options with larger geographic coverage will have larger implementation and ongoing
operational and maintenance costs
Options with less overall traffic concentrations within them will provide less revenue even with
all vehicle categories included
On the above basis, it is expected that shortlisted options that have a higher concentration of
traffic per square mile are most likely to recover sufficient revenues to cover operational and
maintenance costs.
Excluding vehicle categories from the charging mechanisms would reduce revenue and thus
affordability of options.
Increased proportions of non‐charging components of options will reduce the affordability of
options
5.2 Evaluation Criteria 10: Upfront capital required for
scheme
The assessment summarised in this section presents initial ranges of upfront capital costs required
to implement the options.
The key drivers for the cost analysis have been:
The number and location of ANPR cameras: Cameras are critical to effective monitoring and
identification of vehicles entering and moving within the CAZ. This requires an ANPR camera at
each point of entry into the CAZ (referred to herein as the “boundary camera”) as well as ANPR
cameras within the CAZ (referred to herein as an "inter‐zone" camera) to identify those vehicles
that move within the CAZ. The more complex the road network and the more entry points the
greater the number of cameras that will be required.
Costs associated with road signs, road markings, equipment mounting and housing, data
communications links and power supplies: The required number of ANPR cameras and
associated roadside infrastructure, and the associated costs related to road signage and road
markings (to make drivers aware of the CAZ entry points, make up a significant proportion of the
overall cost of a CAZ and these elements are related to the geographic size of the CAZ.
Adjustments were made to equipment quantities where shared facilities could be used at each
location (e.g. multiple cameras at a single location may only need a single data communication
link, not one link per camera). Costs associated with back office facilities, such as the central CAZ system. These items are also
related to the geographic size of the CAZ albeit to a lesser extent than for roadside equipment;
as such, costs were derived partially upon the estimated number of ANPR cameras but with
adjustment to allow for economies of scale.
Based on the above criteria, each of the CAZ areas was assessed using a desktop (Google Earth©)
analysis of the road network and analysis of link flow.
The approach was as follows:
To determine the number of boundary cameras, roads entering the CAZ boundary were
identified and the number of cameras required for each entry point was determined based on
the traffic lanes requiring monitoring. This also took account of any restrictions that could
influence the number of cameras needed at each entry point (e.g. number of lanes, no entries,
banned turns).
To determine the number of inter‐zone cameras, a more holistic view was taken. This involved:
A professional view of where inter‐zone cameras would be required for small CAZ areas
using the same desktop review approach as for the boundary cameras;
For the medium and large scheme, a desktop approach was not considered practical due
to the larges areas involved so the number of medium or large road links in each zone
was estimated by excluding those with an AADT of less than 6,800 vehicles. For those
remaining (i.e. with 6,800 or more AADT) a simple correlation of two ANPR cameras per
link was assumed to determine the total number of inter‐zone cameras. In practice,
more than two cameras will be required on many links but many others will only need
one or even none, so it was considered that two per link was sufficient.
At this SOC stage we have not considered the need for additional traffic management to restrict
alternative movements around the CAZ.
The summary of the charging elements of each of the shortlisted options is summarised in Table 5‐1
below. The analysis confirms that the costs are sensitive to the geographic scale rather than the
charging classes. In summary, the options which cover larger geographies will result in higher
implementation costs.
Table 5‐1: Summary of ANPR cameras required and approximate capital costs
Number of ANPR Cameras Approximate Capital Cost
Medium Zone 1091 £50m ‐ £60m
Medium Zone (including SGC AQMAs) 1116 £50m ‐ £60m
Small Zone 146 £5m ‐ £10m
5.3 Evaluation Criteria 11: Risk of financial penalty to the
Council/s
This evaluation criteria captures the potential risk that financial penalties could be enforced by the
EU on the UK government in response to ongoing exceedances of the legal limit of NO2. This risk is
minimised by options which improve the concentrations within Bristol to below the legal limits.
Analysis undertaken has demonstrated that it is unlikely that any of the options assessed will be
sufficient in isolation to rectify exceedances in all locations in the year of implementation. The small
geography assessed is unlikely to reduce this risk significantly since there are of number of known
exceedances outside of the boundary where concentrations would not be significantly impacted by
the CAZ. The medium geography includes all known exceedances and so has a greater potential to
reduce this risk.Management Evaluation Criteria 6 6.1 Evaluation Criteria 12: Public acceptability To date, very little public engagement or consultation exercises have been undertaken in relation to implementing this project in Bristol. Hence the scoring of each option against this evaluation criteria has been undertaken by assessing the likely response from the public based on the proportion of the population included within the CAZ, and the types of vehicles and trips impacted by the CAZ. Particular focus has been given to the impact on businesses and low income areas. Those options which include car trips, Class D, are anticipated to provoke the strongest public reaction. In addition, the larger the proportion of the city included within the CAZ, the greater the potential for public opposition since a higher number of residents are included within it. A larger zone also has higher potential to impact on low income groups and businesses since a wider geographic coverage incorporates a larger number of both. 6.2 Evaluation Criteria 13: Political acceptability Politicians are elected to represent the public in local and national government. As such, the political acceptability of a CAZ scheme is intrinsically linked to the public acceptability. However, there is mounting pressure on the UK government to tackle the issue of air quality in the UK and particularly in urban areas where the associated damage to public health is most pronounced. The ‘UK Air Quality Plan for tackling nitrogen dioxide concentrations’ July 2017, places much of the responsibility for implementing measures to effectively reduce concentrations of harmful pollutants in the hands of local authorities. In Bristol in November 2016 a motion was proposed by the Green party at the full Council meeting entitled ‘Clean air now for Bristol’ which promoted urgent action to tackle air quality including the implementation of a Clean Air Zone in Bristol. This motion was passed, indicating some local political acceptance of the need for a Clean Air Zone and its urgent implementation. In addition, a petition entitled ‘Let Bristol Breathe Clean Air’ accumulated 4,370 signatures by May 2017, well above the limit of 3,500 after which a full Council debate can be requested. The petition included reference to the implementation of CAZs in other cities and stated that ‘Bristol should not be left behind’. Accounting for all these elements, it is anticipated that those schemes most likely to accumulate public acceptance may be better received by local politicians. Summary 7 The final scores allocated to each option against each evaluation criteria is set out in Table 7‐1 overleaf.
Table 7‐1: Scoring of Charging Measures against Evaluation Criteria
Medium ‐ Medium ‐ Medium ‐ Medium ‐
BCC & SGC BCC & SGC BCC & SGC BCC & SGC Medium ‐ Medium ‐
Small: C ‐ Small: D ‐
Scheme AQMA AQMA AQMA AQMA BCC AQMA: BCC AQMA:
charging charging
combined: C combined: D separate: C ‐ separate: D ‐ C ‐ charging D ‐ charging
‐ charging ‐ charging charging charging
Timescale to achieve compliance 2021 2021 2021 2021 2021 2021 2021 2021
Deliver compliance with NO2 air quality limit values
Pass Pass Pass Pass Pass Pass Pass Pass
and objectives in the shortest possible timescales
Provide equity across different vehicle types and
2 3 2 3 2 3 2 3
trip purposes
Compliance with the CAZ framework 1 1 1 1 3 3 3 3
Mitigate financial impact on low income
2 1 2 1 2 1 3 2
households
Improve health of low income households 2 2 2 2 2 2 1 2
Economic effect 1 1 1 1 1 1 2 1
Improve public health 2 2 2 2 2 2 1 2
Delivery timescale risks of procurement 2 2 2 2 2 2 3 3
Likelihood of revenue equating to
1 2 1 2 1 2 2 3
implementation/operational costs
Upfront capital required for scheme 2 2 2 2 2 2 3 3
Risk of financial penalty to the Council/s 2 3 2 3 2 3 1 2
Public acceptability 2 1 2 1 2 1 2 1
Political acceptability 2 2 2 2 2 2 2 2
Weighted Average Score (excluding financial CSFs) 43 39 43 39 49 45 47 49
Reject ‐ Low Reject ‐ Low Reject ‐ Low Reject ‐ Low
Decision Feasible Feasible Feasible Feasible
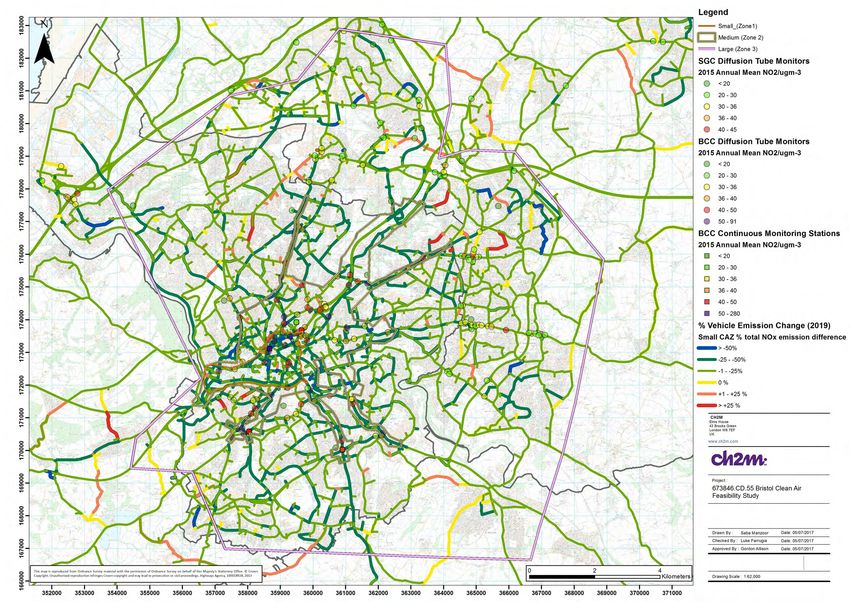
scoring scoring scoring scoringAppendix A 2015 Measured Annual Mean NO2
¯
2015 Measured
Annual Mean
179000
[NO2] / µg m-3
< 20
20 - 30
178000
30 - 36
36 - 40
40 - 50
177000
50 - 91
CMS Annual Mean
[NO2] / µg m-3
176000
< 20
20 - 30
30 - 36
175000
36 - 40
40 - 50
> 50
174000
Geographical boundary
Small (Zone 1)
Medium (Zone 2)
Large (Zone 4)
173000
CH2M
Elms House
172000
43 Brooks Green
London W6 7EF
UK
www.ch2m.com
171000
Project :
673846.CD.55 Bristol Clean Air
Feasibility Study
Figure
Mapping of Air Quality Monitoring Diffusion Tube
2015 Annual mean NO2 data for Bristol City Council
170000
Drawn By : Saba Manzoor Date: 19/06/2017
Checked By : Luke Farrugia Date: 19/06/2017
Approved By : Gordon Allison Date: 19/06/2017
This map is reproduced from Ordnance Survey material with the permission of Ordnance Survey on behalf of Her Majesty's Stationery Office. © Crown 0 1 2
Copyright. Unauthorised reproduction infringes Crown copyright and may lead to prosecution or civil proceedings. Highways Agency, 100018928, 2013
Kilometers Drawing Scale : 1:37,760
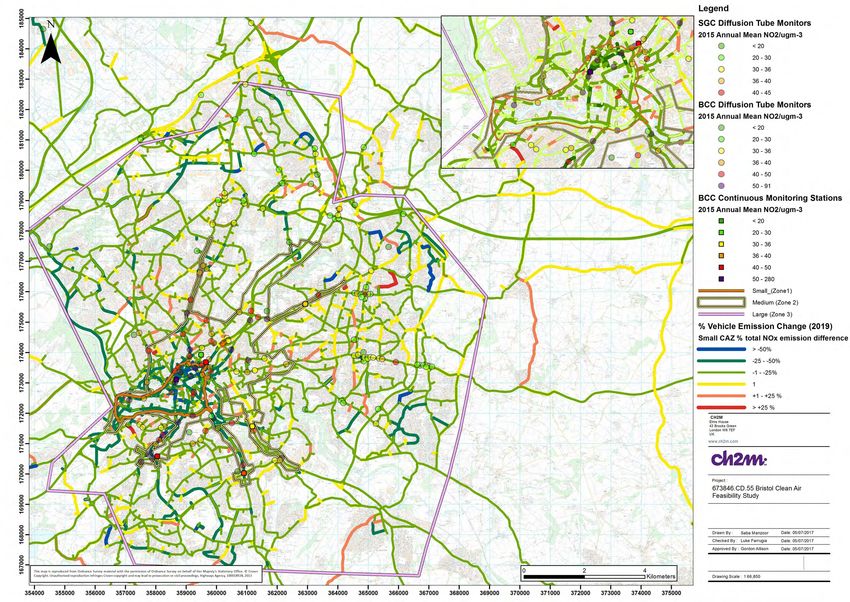
352000 353000 354000 355000 356000 357000 358000 359000 360000 361000 362000 363000¯
2015 Measured
190000
SGC Annual Mean
[NO2] /µg m-3
189000
< 20
188000
20 - 30
187000
30 - 36
186000
36- 40
40 - 45
185000
Geographical boundary
184000
Small (Zone 1)
Medium (Zone 2)
183000
Kingswood AQMA (Zone 3)
182000
Large (Zone 4)
GBATS Model
181000
180000
179000
178000
N.B
1= No change
0.75 = 25 % reduction
177000
CH2M
Elms House
43 Brooks Green
London W6 7EF
UK
176000
www.ch2m.com
175000
Project :
673846.CD.55 Bristol Clean Air
Feasibility Study
174000
Figure
Relative NOx Emission Rate
173000
Drawn By : Saba Manzoor Date: 19/06/2017
Checked By : Luke Farrugia Date: 19/06/2017
Approved By : Gordon Allison Date: 19/06/2017
172000
This map is reproduced from Ordnance Survey material with the permission of Ordnance Survey on behalf of Her Majesty's Stationery Office. © Crown 0 2 4
Copyright. Unauthorised reproduction infringes Crown copyright and may lead to prosecution or civil proceedings. Highways Agency, 100018928, 2013 Kilometers Drawing Scale : 1:69,431
353000 354000 355000 356000 357000 358000 359000 360000 361000 362000 363000 364000 365000 366000 367000 368000 369000 370000 371000 372000 373000 374000 375000Appendix B
Changes in emissions from CAZ Class
DAppendix C Socio‐economic Mapping
Figure C.1 – Residents in High Value Jobs
Figure C.2 – Residents in Low Value Jobs
Figure C.3 – Residents employed in Transport and Construction Jobs
Figure C.4 – Car Journeys to Workplaces in the City Centre
You can also read