Brookfield Renewable - National Bank Resource Library
←
→
Page content transcription
If your browser does not render page correctly, please read the page content below
Brookfield Renewable
C O R P O R AT E P R O F I L E
M AY 2 0 2 1
Cautionary Statement Regarding Forward-Looking Statements
This presentation contains forward-looking statements and information, within the meaning of Canadian securities laws and “forward-looking statements” within the meaning of Section 27A of the U.S. Securities
Act of 1933, as amended, Section 21E of the U.S. Securities Exchange Act of 1934, as amended, “safe harbor” provisions of the United States Private Securities Litigation Reform Act of 1995 and in any
applicable Canadian securities regulations, concerning the business and operations of Brookfield Renewable. Forward-looking statements may include estimates, plans, expectations, opinions, forecasts,
projections, guidance or other statements that are not statements of fact. Forward-looking statements in this presentation include statements regarding the quality of Brookfield Renewable’s assets and the
resiliency of the cash flow they will generate, Brookfield Renewable’s anticipated financial performance and payout ratio, future commissioning of assets, contracted nature of our portfolio, technology
diversification, acquisition opportunities, expected completion of acquisitions and dispositions, including the pending sales of our 391 MW wind portfolio in the United States and our 927 MW operating and
development wind portfolio in Ireland and Scotland, financing and refinancing opportunities, BEPC’s eligibility for index inclusion, BEPC’s ability to attract new investors as well as the future performance and
prospects of BEPC and BEP, the prospects and benefits of the combination of Brookfield Renewable and TerraForm Power, including certain information regarding the combined company’s expected cash flow
profile and liquidity, future energy prices and demand for electricity, economic recovery, achieving long-term average generation, project development and capital expenditure costs, energy policies, economic
growth, growth potential of the renewable asset class, the future growth prospects and distribution profile of Brookfield Renewable and Brookfield Renewable’s access to capital. In some cases, forward looking
statements can be identified by the use of words such as “plans”, “expects”, “scheduled”, “estimates”, “intends”, “anticipates”, “believes”, “potentially”, “tends”, “continue”, “attempts”, “likely”, “primarily”,
“approximately”, “endeavours”, “pursues”, “strives”, “seeks”, “targets”, “believes”, or variations of such words and phrases, or statements that certain actions, events or results “may”, “could”, “would”, “should”,
“might” or “will” be taken, occur or be achieved. Although we believe that our anticipated future results, performance or achievements expressed or implied by the forward looking statements and information in
this presentation are based upon reasonable assumptions and expectations, we cannot assure you that such expectations will prove to have been correct. You should not place undue reliance on forward
looking statements and information as such statements and information involve known and unknown risks, uncertainties and other factors which may cause our actual results, performance or achievements to
differ materially from anticipated future results, performance or achievement expressed or implied by such forward-looking statements and information.

Factors that could cause actual results to differ materially from those contemplated or implied by forward-looking statements include, but are not limited to changes to hydrology at our hydroelectric facilities, to
wind conditions at our wind energy facilities, to irradiance at our solar facilities or to weather generally, as a result of climate change or otherwise, at any of our facilities; volatility in supply and demand in the
energy markets; our inability to re-negotiate or replace expiring PPAs on similar terms; increases in water rental costs (or similar fees) or changes to the regulation of water supply; advances in technology that
impair or eliminate the competitive advantage of our projects; an increase in the amount of uncontracted generation in our portfolio; industry risks relating to the power markets in which we operate; the
termination of, or a change to, the MRE balancing pool in Brazil; increased regulation of our operations; concessions and licenses expiring and not being renewed or replaced on similar terms; our real property
rights for wind and solar renewable energy facilities being adversely affected by the rights of lienholders and leaseholders that are superior to those granted to us; increases in the cost of operating our plants;
our failure to comply with conditions in, or our inability to maintain, governmental permits; equipment failures, including relating to wind turbines and solar panels; dam failures and the costs and potential
liabilities associated with such failures; force majeure events; uninsurable losses and higher insurance premiums; adverse changes in currency exchange rates and our inability to effectively manage foreign
currency exposure; availability and access to interconnection facilities and transmission systems; health, safety, security and environmental risks; energy marketing risks; disputes, governmental and regulatory
investigations and litigation; counterparties to our contracts not fulfilling their obligations; the time and expense of enforcing contracts against nonperforming counter-parties and the uncertainty of success; our
operations being affected by local communities; fraud, bribery, corruption, other illegal acts or inadequate or failed internal processes or systems; some of our acquisitions may be of distressed companies,
which may subject us to increased risks, including the incurrence of legal or other expenses; our reliance on computerized business systems, which could expose us to cyber-attacks; newly developed
technologies in which we invest not performing as anticipated; labor disruptions and economically unfavorable collective bargaining agreements; our inability to finance our operations due to the status of the
capital markets; operating and financial restrictions imposed on us by our loan, debt and security agreements; changes to our credit ratings; our inability to identify sufficient investment opportunities and
complete transactions, including the pending sales of our 391 MW wind portfolio in the United States and our 927 MW operating and development wind portfolio in Ireland and Scotland; the growth of our
portfolio and our inability to realize the expected benefits of our transactions or acquisitions; our inability to develop greenfield projects or find new sites suitable for the development of greenfield projects;
delays, cost overruns and other problems associated with the construction and operation of generating facilities and risks associated with the arrangements we enter into with communities and joint venture
partners; Brookfield Asset Management’s election not to source acquisition opportunities for us and our lack of access to all renewable power acquisitions that Brookfield Asset Management identifies, including
by reason of conflicts of interest; we do not have control over all our operations or investments; political instability or changes in government policy; foreign laws or regulation to which we become subject as a
result of future acquisitions in new markets; changes to government policies that provide incentives for renewable energy; a decline in the value of our investments in securities, including publicly traded
securities of other companies; we are not subject to the same disclosure requirements as a U.S. domestic issuer; the separation of economic interest from control within our organizational structure; future sales
and issuances of our LP units, preferred limited partnership units or securities exchangeable for LP units, including BEPC’s Shares, or the perception of such sales or issuances, could depress the trading price
of the LP units or preferred limited partnership units; the incurrence of debt at multiple levels within our organizational structure; being deemed an “investment company” under the U.S. Investment Company
Act of 1940; the effectiveness of our internal controls over financial reporting; our dependence on Brookfield Asset Management and Brookfield Asset Management’s significant influence over us; the departure
of some or all of Brookfield Asset Management’s key professionals; changes in how Brookfield Asset Management elects to hold its ownership interests in Brookfield Renewable; Brookfield Asset Management
acting in a way that is not in the best interests of Brookfield Renewable or its unitholders; the severity, duration and spread of the COVID-19 outbreak, as well as the direct and indirect impacts that the virus
may have; broader impact of climate change; failure of BEPC’s systems technology; involvement in disputes, governmental and regulatory investigations and litigation; any changes in the market price of the
BEP units; and the redemption of exchangeable shares by BEPC at any time or upon notice from the holder of BEPC class B shares. We caution that the foregoing list of important factors that may affect future
results is not exhaustive. The forward-looking statements represent our views as of the date of this presentation and should not be relied upon as representing our views as of any subsequent date. While we
anticipate that subsequent events and developments may cause our views to change, we disclaim any obligation to update the forward-looking statements, other than as required by applicable law. For further
information on these known and unknown risks, please see “Risk Factors” included in the Form 20-F of BEP and other risks and factors that are described therein.

Non Solicitation

No securities regulatory authority has either approved or disapproved of the contents of this presentation. This presentation shall not constitute an offer to sell or the solicitation of an offer to sell or the
solicitation of an offer to buy any securities, nor shall there be any sale of securities in any jurisdiction in which such offer, solicitation or sale would be unlawful prior to registration or qualification under the
securities laws of any such jurisdiction. No offer of securities shall be made except by means of a prospectus meeting the requirements of Section 10 of the Securities Act of 1933, as amended.

Unless otherwise indicated, information presented is as of March 31, 2021.

                                                                                                                                                                                                                             2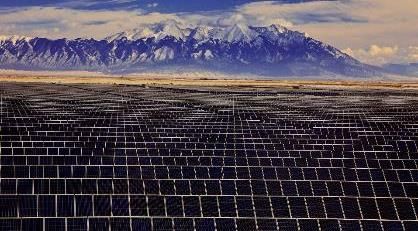
Overview of Brookfield Renewable

We are a global leader in decarbonization, with integrated operating platforms on
four continents with operating, development and power marketing expertise

                M AR K E T S Y M B O L                                             M AR K E T                                B R O O K F I E LD
                                                                              C AP I TAL I Z AT I O N                       PAR T I C I PAT I O N

               NYSE: BEP, BEPC                                                                                         ~48% Equity Interest; GP
              TSX: BEP.UN, BEPC
                                                                                        ~$28B1                              & Manager

           CAPITALIZATION                                                                                  DISTRIBUTION PROFILE

           Credit Rating                                          S&P BBB+                                 Current Distribution        $1.22 per unit
           Average debt term                                                                               Target Annual Growth               5 – 9%
                                                                       13 years
           to maturity
                                                                                                           Implied Yield2                      ~2.7%
           Available Liquidity                                              $3.4B

1)   Combined market capitalization of BEP and BEPC. Based on the NYSE closing prices on March 31, 2021.
2)   Based on the average closing prices of BEP and BEPC on March 31, 2021.

                                                                                                                                                        3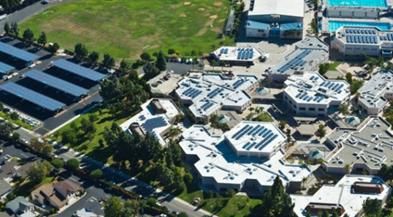
Decarbonization will require a whole
economy transition and creates the
greatest commercial opportunity of
our time requiring $100+ trillion over
       the next three decades

                                         4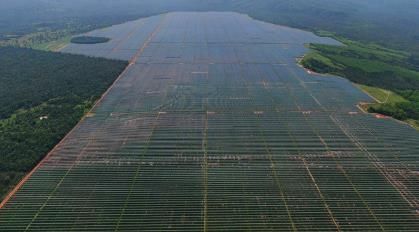
Decarbonization Is a Global Goal…

2020 saw increasing momentum among some of the largest carbon-emitting
governments to adopt ambitious climate plans and targets

                                  U.K. committed to emissions reductions of
Canada committed to reduce        at least 68% below 1990 levels by 2030
     emissions by 30% below
   2005 levels by 2030 and is
legislating to raise the carbon        E.U. agreed to reduce emissions to at
         tax to C$170 by 2030          least 55% below 1990 levels by 2030

                                                                                  Japan and South Korea
                                                                                  vowed to achieve net-
                                                                                  zero emissions by 2050

    U.S. is reentering the
   Paris Agreement, and
                                                                              China pledged to achieve
    announced plans for
                                                                              carbon neutrality before 2060
 100% carbon-free power
                  by 2035
                                                                        India is on track to achieve
                                                                        its “2˚C compatible” rated
                                                                        Paris Agreement climate
                                                                        action targets
                                  Australia has committed to
                                    reducing GHG emissions
                                  26–28% below 2005 levels
                                                   by 2030

                                                                                                         5
…Shared by All Key Stakeholders
We believe that changing consumer preferences and new climate policies are
creating a significant commercial opportunity for experienced owner-operators
• Nearly 130 governments have committed to net-zero targets
GOVERNMENTS
• Approximately 1,200 companies have agreed to science-
based climate-related targets to reduce emissions in line with
the Paris Agreement
• Over 500 investors have organized to engage the world’s CORPORATIONS
highest GHG emitters in helping drive the clean energy
transition
• An alliance of asset owners with $5 trillion of AUM have
pledged to transition their investment portfolios to net zero
INVESTORS
• More than 200 banks have signed on to the Principles for
Responsible Banking, aligning financing portfolios with the
Paris Agreement
• Organizations representing $139 trillion of AUM have LENDERS
agreed to support TCFD-aligned climate disclosures
6…Impacting All Industries
ELECTRICITY TRANSPORTATION OIL, GAS AND COMMODITIES
GRIDS ENERGY
Renewables Electric vehicles, Green hydrogen Green steel and
displacing coal batteries, storage and production and ammonia
and gas charging carbon capture
systems
Electrification will drive the largest decarbonization effort globally
7Over 70% of global greenhouse gas
emissions can be traced back to the
power generation and energy sector
8$100+ Trillion Investment Opportunity
To Decarbonize Energy Systems
$3.5T
$300B
HISTORICAL PROJECTED
Annual Investment Annual Investment
in Renewable Power to Support Decarbonization
Generation of Energy Systems
Over the Next 30 Years
Upscaling renewables remains critical to energy transition and must be complemented
with additional investment in efficiency and low-carbon technology across end-use sectors
9Reducing CO2, An Unprecedented Commercial Opportunity…
…that will require significant capital and deep operational expertise
Expertise in Clean Energy
Deep Operating and Development Capabilities
Global Reach
Proven and Repeatable Growth Strategy
Access to Capital and Strong Balance Sheet
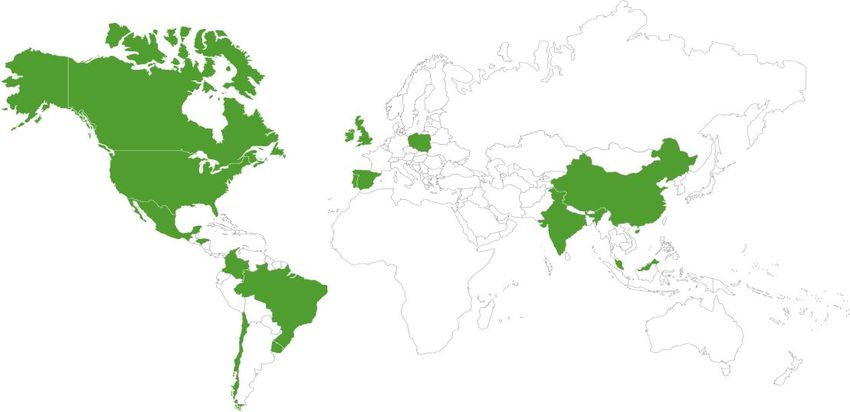
10Built Scale Across 5 Continents with ~21 GW of Operating Assets
Hydro
Wind
Solar
Storage/Other
Distributed
Generation
NORTH EUROPE
AMERICA 4,700 MW
9,900 MW
ASIA-PACIFIC
1,100 MW
SOUTH
AMERICA
4,900 MW
11…And Established a Diverse Development Pipeline of ~27 GW
EUROPE
CANADA 8,000 MW
1,600 MW
UNITED STATES ASIA-PACIFIC
5,600 MW 4,700 MW
SOUTH AMERICA
7,200 MW
12… We Have Delivered Decarbonization and Energy Solutions for Years
We have been investing for multiple decades in the acquisition, operations and
development of clean energy and are increasingly focused on energy transition
and decarbonization investments
2015
1980s
Renewable Power Generation Energy Transition and Decarbonization
Operating Development Technical Distributed Storage and Corporate Utility Green
Assets Pipeline Capabilities Generation Flexible Partnerships Transformation Hydrogen
Capacity
13A Global Leader in Decarbonization
21 GW 27 GW
OPERATING ASSETS DEVELOPMENT ASSETS
currently avoiding with the potential to avoid
29M tCO2e 32M tCO2e
equivalent to equivalent to
100% 6 million 100% 6 million
of London’s vehicles of Houston’s homes’
annual removed from annual electricity use
1 2 1 2
emissions the road emissions for one year
14… Across Multiple Industries
Signed agreements with corporate offtakers across all major industries, including
many of the largest counterparties by market capitalization in the world
Utilities: Partnering on renewable transformations, clean energy conversions, and
decarbonization
Energy Companies: Providing 24x7 renewable power for green hydrogen
production in Canada
Technology Companies: Providing clean power to largest technology companies
Financial Services: Selling renewable credits across portfolios of real estate
Industrials & Manufacturing: Providing renewable power to leading industrials
and manufacturers
Behind the meter: Largest owners and developer of C&I distributed generation
solar in the US
1520+ Year Track Record…
…Of delivering growing distributions and long-term value for unitholders
Annualized Total Return
Since
(As at March 31, 2021) 5-Year Inception
BEP (NYSE)1 28% 20%
BEP (TSX)1 27% 19%
S&P 500 Index1 16% 7%
S&P 500 ESG Index1 15% 12%
S&P Utilities Index1 12% 10%
S&P/TSX Composite Index1 10% 7%
Includes dividend reinvestment.
1) S&P 500 Index, S&P Utilities Index and S&P/TSX Composite index returns since BEP spin out on 11/17/1999 (BEP was formerly Great Lakes Hydro Income Fund
until BEP spun out in 2011). S&P 500 ESG Index returns since its inception on 4/30/2010. 16Our Strategy is Simple and Repeatable
Consistently leverage our global scale, reach and global operating and
development capabilities to generate attractive long-term risk-adjusted returns
1
Invest or
develop on a
value basis
12–15% Returns
3 on Invested Capital 2
Monetize Optimize
mature cash
assets flows
17Diverse High-Quality Cash Flows
10% 2%
15%
21%
16%
Growing 14-year
Technologically Global
52% Average PPA
Diversified1 Footprint1
61%
term2
16%
22%
85%
Hydro Wind Utility Solar Energy Transition North America Europe Latin America Asia Contracted Merchant
1. Figures based on normalized revenue for the last twelve months, proportionate to BEP.
2. Figures based on revenue, proportionate to BEP. Excludes financial contracts and Brazil and Colombia, where we would expect the energy associated with maturing
18
contracts to be re-contracted in the normal course given the construct of the respective power markets.Robust Balance Sheet
DEBT MATURITY LADDER
BBB+ US$ Billions as at March 31, 2021
INVESTMENT GRADE BALANCE SHEET $5.0
Highest rating in the sector
$4.0
$3.4 Billion
AVAILABLE LIQUIDITY $3.0
With $4 Billion partner capital to invest along side
$2.0
90%
FIXED RATE FINANCINGS $1.0
Minimal exposure to rising interest rates
$0.0
90% (consolidated basis)
2021 2022 2023 2024 2025 After
NON-RECOURSE FINANCINGS Non-Recourse Maturities Recourse Maturities
Structured on an investment grade basis with no financial
maintenance covenants
$2.5 Billion 13 YEARS AVERAGE DEBT
RAISED THROUGH CAPITAL RECYCLING TERM TO MATURITY
In the last two years
19Supported by Deep Operational Expertise
Differentiated operating, development, commercial and business transformation
capabilities are critical in driving value in our investments
3,000 140+ 6,000 5 24x7
OPERATING POW ER RENEW ABLE CENTRALIZED RENEW ABLE
EMPLOYEES IN 21 MARKETING GENERATING CONTROL POW ER
OFFICES GLOBALLY EXPERTS FACILITIES CENTERS CAPABILITIES
Generation Management, Asset Equipment Engineering and
Planning and Dispatch Integration Procurement Development
HSSE
Fully integrated operating capabilities Construction
Capabilities in all major markets around the world Management
Regulatory Operational
Energy Marketing Grid Optimization
Expertise Turnarounds
Expertise
20With Multiple Levers for Cash Flow Growth
FFO PER-SHARE GROWTH
Up to
9%
3–5%
10%+ 2–4%
CAGR
1–2%
2010 2020 Inflation Margin Development M&A Growth 2 2025
Escalation Enhancement Pipeline 1
1. Assumes $250 million to $350 million of equity is deployed per annum to build out 450 MW to 700 MW per annum at 15% FFO accretion
2. Assumes up to $1.5 billion of equity per annum deployed into M&A at 10% FFO accretion 21Key Takeaways
Leader in renewable energy and decarbonization
technology
Proven track record of growth across all major
technologies
Global platform with diverse development pipeline
Deep customer relationships, focused on delivering
compelling solutions
Strongest investment grade balance sheet and access
to capital in the sector
22Appendix I – Investment Spotlights
23Investment Spotlight
TerraForm Power Merger
TRANSACTION OVERVIEW
• Acquired controlling interest in TerraForm Power, one of the
largest owners of wind and solar globally, following the
bankruptcy of its sponsor in 2016
• Merged the remaining interest into Brookfield Renewable on
an all-stock basis in 2020
VALUE-ENHANCING THESIS
• One of the few organizations with the scale and operating
capability to acquire the business through the restructuring,
and immediately stabilize the business by implementing an
operating plan and resuming growth
• Drove significant value to TerraForm Power shareholders
‒ Delivered 35% annualized total return and over two >4 GW
times their money from the time of our initial ACROSS SOLAR
investment AND WIND
• Merger was accretive to Brookfield Renewable and
strengthened our business in North America and Europe
$5B
TRANSACTION
VALUE
24Investment Spotlight
U.S. Distributed Generation
TRANSACTION OVERVIEW
• Acquired a distributed generation (DG) development
platform
‒ 360 MW of operating distributed solar across nearly
600 sites throughout the U.S.
‒ 700 MW under development and a dedicated
development and PPA origination team
• Portfolio is contracted under long-term contracts
• Will leverage our scale and operating and commercial
capabilities to drive additional value
• Transaction closed in Q1 2021
VALUE-ENHANCING THESIS
• Entered the DG space in 2017
360 MW
‒ Identified opportunity to build a high-quality scale DISTRIBUTED
business in a rapidly growing market GENERATION
• Grew the business as solar cost declines and
decarbonization goals from C&I clients accelerated
• Today, we own one of the leading DG businesses in
the U.S., with deep operating, development and origination
capabilities, and an ~2,000 MW portfolio that generates
high-quality contracted cash flows that are diversified by
$810M
PURCHASE
geography and customer.
PRICE
• Furthers our goal of partnering with corporates and other
institutions to help them achieve their decarbonization
objectives
25Investment Spotlight
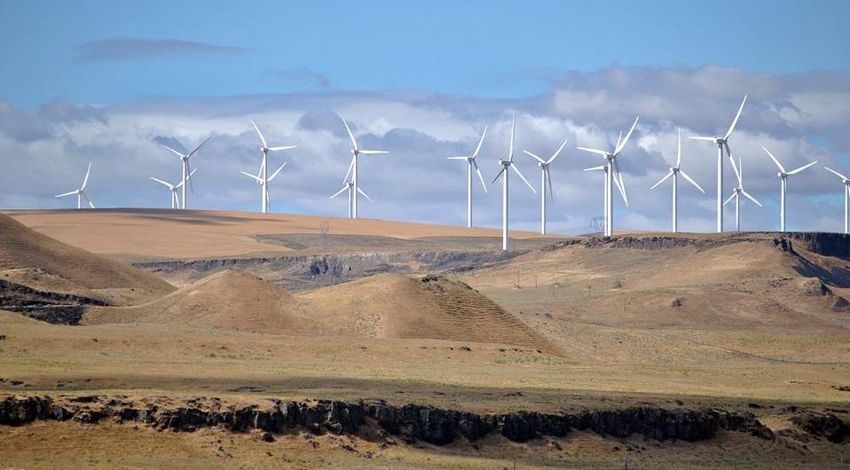
Shepherds Flat
TRANSACTION OVERVIEW
• Acquired the Shepherds Flat wind farm, an 845 megawatt
fully contracted wind generation facility located in Oregon
• The project, which is fully contracted with a high-quality
offtaker, is one of the largest onshore wind projects in the
United States and includes an attractive repowering
opportunity that we expect to deliver by the end of 2022
• Transaction closed in Q1 2021
VALUE-ENHANCING THESIS
• Repowering opportunity is one of the largest in the world
and is expected to increase total generation by
approximately 25% increasing the clean energy produced
by approximately 400 gigawatt hours annually and 400 GWH
delivering strong returns INCREMENTAL WIND
• Leveraging our decades of expertise to drive operational CAPACITY
efficiencies while producing attractive returns
• Plan to drive additional value to through operational and
commercial synergies such as optimizing G&A spend and
O&M agreements
• We are also advancing a 400-megawatt new-build
development pipeline that was included in the transaction 400 MW
DEVELOPMENT
PROJECT
26Investment Spotlight
Janauba Solar
TRANSACTION OVERVIEW
• 1,200 MW advanced solar development in Brazil
• One of the largest solar developments globally
• Expected total equity to complete project of ~$200 million
VALUE-ENHANCING THESIS
• Requires both development and energy marketing
capabilities to bring the project to completion
‒ Leverage deep power marketing expertise to contract
the facility prior to commencing construction
‒ Using global scale drive down equipment
procurement, installation and operating costs to
deliver additional value over time
1,200 MW
LATE-STAGE
PROGRESS TO DATE
PROJECTS
• Phase 1 is fully contracted, and construction is in progress,
with target commissioning in 2022
• Phase 2 is fully contracted, and construction is expected to
commence at the end of 2021, with commissioning
expected in 2023
100%
CONTRACTED CASH
FLOWS1
27Appendix II – Environmental, Social and Governance (ESG)
28Strong ESG Practices Create Long-Term Stakeholder Value
Maintaining a social license to operate is central to preserving capital, mitigating
risk and creating long term value
Environmental Social Governance
• Accelerate the • Maintain a social license to • Operate with high ethical
decarbonization of global operate standards and a robust
electricity grids through our policy framework (e.g. our
renewable power portfolio • Health and safety – with a Code of Business Conduct and
focus on high-risk incidents – Ethics, Anti-Bribery and Anti-
• Apply Task Force on Climate- prevention is a top priority Corruption Policy)
related Financial Disclosures
(TCFD) framework to analyze • Proactively engage with and • Integrate ESG into our
long-term climate change give back to communities in decision-making, processes
risks which we operate and management systems
• Protect biodiversity • Human capital initiatives • Diverse Board of Directors
emphasizing diversity and and executive management
• Manage water and waste inclusion team
resources
• Asset and information security
29Leader in Green Energy & Sustainability
BEP is the largest member by market capitalization of the S&P/TSX Renewable Energy and Clean
Technology Index.
Since 2017, Brookfield Renewable has issued six green bonds for an aggregate value of over $2.5
billion. Citing BEP's environmental stewardship, commitment to renewable power, and use of proceeds
towards renewable power generation, the hydro green bonds received E-1 Green Evaluation scores
from S&P - the highest on its scale.
Brookfield Renewable has raised $3.8 billion in Green Securities and Sustainability-linked Revolving
Credit Facilities. The securities included five corporate-level green bonds, a perpetual preferred unit
issuance and a perpetual subordinated note under its Green Bond and Preferred Securities
Framework. Proceeds are used to finance and/or refinance investments in renewable power
generation and to support the development of clean energy technologies. A third-party opinion from
Sustainalytics deemed the Frameworks to be credible and impactful.
Brookfield Renewable is committed to sustainable development principles that reduce the impact of
our operations and help to manage the underlying water resources efficiently. Low Impact Hydropower
Institute (LIHI) certification is a voluntary certification program designed to help identify and provide
market incentives for hydropower operations that are minimizing their environmental impacts. BEP has
received LIHI certification for 80 hydro facilities across the US, more than any other operator, making it
the U.S. leader in low impact hydropower generation.1
The Environmental Choice Program is a comprehensive national program sponsored by Environment
Canada. It certifies manufacturers and suppliers that produce products and services that are less
harmful to the environment. These bear the EcoLogo registered trademark. 23 of our hydroelectric
facilities in Ontario, Quebec, and British Columbia meet the strict standards of the Environmental
Choice Program.
1. This product includes Low Impact Hydropower from facilities certified by the Low Impact Hydropower Institute (an independent non-profit organization) to have
environmental impacts in key areas below levels the Institute considers acceptable for hydropower facilities. For more information about the certification, please visit
www.lowimpacthydro.org. 30Appendix III – Corporate Structure
31Indicative Corporate Structure
Brookfield Asset Management1
(NYSE:BAM)
BUSINESSES Real Estate Infrastructure Renewable Power Private Equity Credit – Oaktree2
Brookfield Brookfield Brookfield Brookfield
Property Infrastructure Renewable Business
AFFILIATES1 Partners Partners/Corp Partners/Corp Partners
(NASDAQ: BPY) (NYSE: BIP, BIPC) (NYSE: BEP, BEPC) (NYSE: BBU)
57% 28% 48% 64%
PRIVATE
Real Estate Infrastructure Transition Private Equity
FUNDS
Credit & Other
Alternative
Strategies
PUBLIC Real Asset
Real Estate Infrastructure Renewables
SECURITIES3 Credit
1. BAM ownership figures as of March 31, 2021 on a fully diluted/exchanged basis.
2. Includes Oaktree and other alternative investments. Oaktree also has real estate and infrastructure products.
3. Portfolios of fixed income and equity securities managed on behalf of clients. 32Governance
SENIOR MANAGEMENT TEAM
Mark Carney Vice Chair
Sachin Shah Vice Chair
Connor Teskey Chief Executive Officer
Wyatt Hartley Chief Financial Officer
Jennifer Mazin General Counsel
Ruth Kent Chief Operating Officer
• Brookfield Renewable is a party to a Master Services Agreement with Brookfield Asset
Management
o Provides comprehensive suite of services to Brookfield Renewable
o Base management fee of $20 million adjusted annually for inflation
o Equity enhancement fee equal to 1.25% of the increase in Brookfield Renewable’s
combined capitalization
• Incentive distributions based upon increases in distributions paid to shareholders over defined
thresholds
o 15% participation by Brookfield in distributions over $0.20/unit per quarter
o 25% participation by Brookfield in distributions over $0.2253/unit per quarter
• Brookfield Renewable’s general partner has a majority of independent directors
• Brookfield Renewable’s governance is structured to provide significant alignment of interests
between Brookfield Asset Management and unitholders 33Ability to Invest Through a Canadian Corporation
Brookfield Renewable Corporation (NYSE, TSX: BEPC), a subsidiary of BEP L.P.,
was created to offer an economically equivalent security to BEP L.P., but in the
form of a more traditional corporate structure
BEPC BEP
• Distributions are identical in amount and
Dividends/Distributions
timing
• BEPC shares are exchangeable 1:1 for BEP
Exchangeable N/A
units at anytime
• As a corporation, BEPC is eligible for many
Structure and Index Canadian Bermuda Limited
equity indexes that exclude Limited
Eligibility Corporation Partnership
Partnerships
• For U.S. shareholders, subject to the holding
U.S.: 1099 Form U.S.: K-1 Slip period, dividends paid by BEPC will be
Tax Reporting Canada: T5 Canada: T5013 “qualified dividends”
Form Slip • For Canadian shareholders, dividends paid by
BEPC will be “eligible dividends”
34You can also read