Building an Age Friendly Salford 2018- 2021 - Appendix 1 - Understanding the Salford context - where is Salford now? - Salford City ...
←
→
Page content transcription
If your browser does not render page correctly, please read the page content below
Building an Age Friendly Salford 2018-
2021

Appendix 1 - Understanding the Salford
context – where is Salford now?

                                         1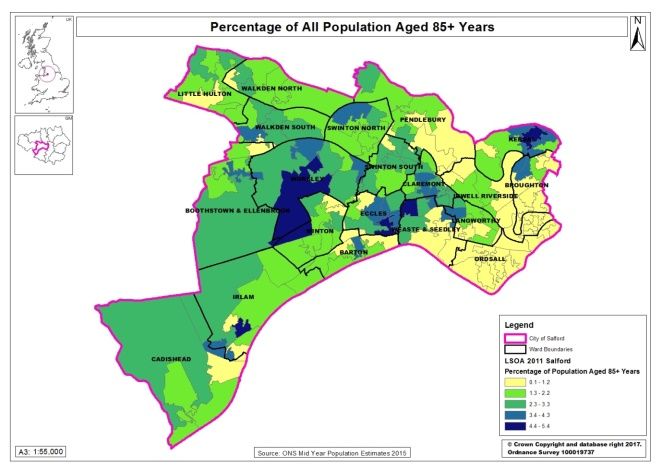
Contents page
Page
Executive Summary 3
1. Setting the Scene
The National Picture 4
At a Greater Manchester (GM) level 4
In Salford 5
Salford Neighbourhoods 8
Ethnicity 9
Health and Wellbeing of older people in Salford 9
2. Salford – What’s known and already in place across GM and Salford
GM Ageing Hub 10
Ambition for Ageing 11
Salford City priorities 'A better and fairer Salford for all.' 11
Salford Together Partnership 11
o The Salford Model for Integrated Care 11
o Salford Together Community Asset model 12
Salford's Locality Plan Start Well, Live Well, Age Well 12
Housing - Where older people live in Salford 12
Community and Outdoor Space 14
Getting About 14
Maps
Map 1: GM map highlighting Salford Borough 4
Map 2: Percentage of All Population Aged 65+ years 6
Map 3: Percentage of All Population Aged 75+ years 7
Map 4: Percentage of All population Aged 85+ years 7
Map 5: Lower Super Output areas map of deprivation in Salford Elderly 8
Figures
Figure 1: Mid-2013 Population Estimates Population Structure 5
Figure 2: Sub-national Population Projections for all people Aged 65+, 75+ and 6
85+ years in Salford
Tables
Table 1: GM Ageing hub priorities 10
Table 2: The Strategic aims for Promoting Independence are: 13
Table 3: Neighbourhoods by Green Spaces 14
2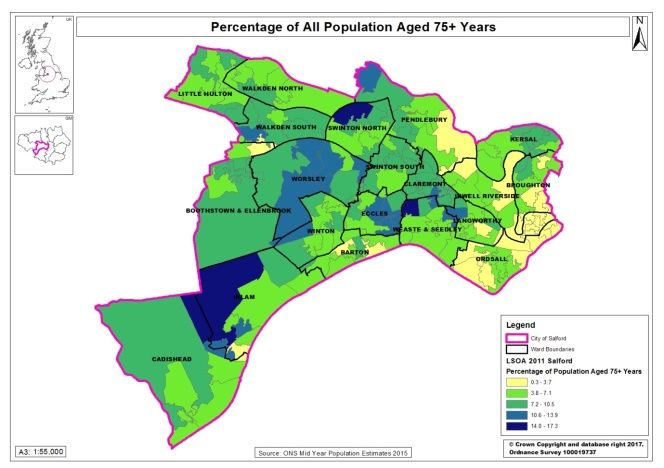
Executive Summary

This aim of this section is to provide a summary of where we are now in Salford in relation to
older people and to support the main “How Age Friendly Are We” Age Friendly Cities
Baseline plan by setting the context and providing relevant demographic information for
Salford, Greater Manchester and the UK where relevant.

The content includes the National, Greater Manchester and Salford wide picture, for
partnership approaches and key strategies and plans. The housing situation, transport plans
and health and wellbeing figures are also outlined.

The broader local and regional partnerships and partners who support the Age Friendly City
approach to Salford are explained.

                                                                                             3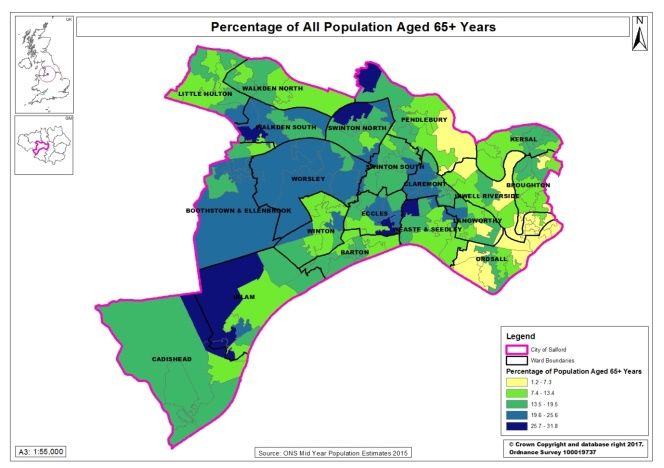
1 Setting the scene
The national picture
The population of the UK is rapidly ageing. There are currently as many people aged 60 and
above as there are aged 18 and below. By 2024, more than one in four of us will be over 60.
Our longer lives are one of society’s greatest achievements. But while many already enjoy a
good later life, others risk ill health, poverty and loneliness. At the same time, many in mid-
life are struggling to get by and aren’t in a position to think about or plan for later life (Centre
for Ageing Better).
17 per cent of older people in the UK are in contact with family, friends and
neighbours less than once a week, and 11 per cent are in contact less than once a
month. Research over recent decades in the UK has found a fairly consistent
proportion (6-13%) of older people feeling lonely often or always.
Alzheimer’s disease currently costs the NHS an estimated £20 billion a year.
Salford is one of the 10 districts that is part of Greater Manchester. In 2015 NHS
organisations and Local Authorities signed a landmark devolution agreement (devolved
budget) with the Government to take charge of health and social care spending and
decisions in our city region.
The City of Salford is one of the ten metropolitan boroughs of GM. The current city
boundaries were set as part of the provisions of the Local Government Act 1972 and cover
an amalgamation of five former local government districts. It is bounded on the south east by
the River Irwell, which forms its boundary with the city of Manchester and by the Manchester
ship canal to the south, which forms its boundary with Trafford. The metropolitan boroughs
of Wigan, Bolton and Bury lie to the west, northwest and north respectively. Some parts of
the city, which lie directly west of Manchester, are highly industrialised and densely
populated, but around one third of the city consists of rural open space.
Map 1: GM map highlighting Salford
At a Greater Manchester (GM) level, by 2036:
14% of the total population will be 75 and over, this is an increase of 75% from 2011
(from 221,000 to 387,000 people).
4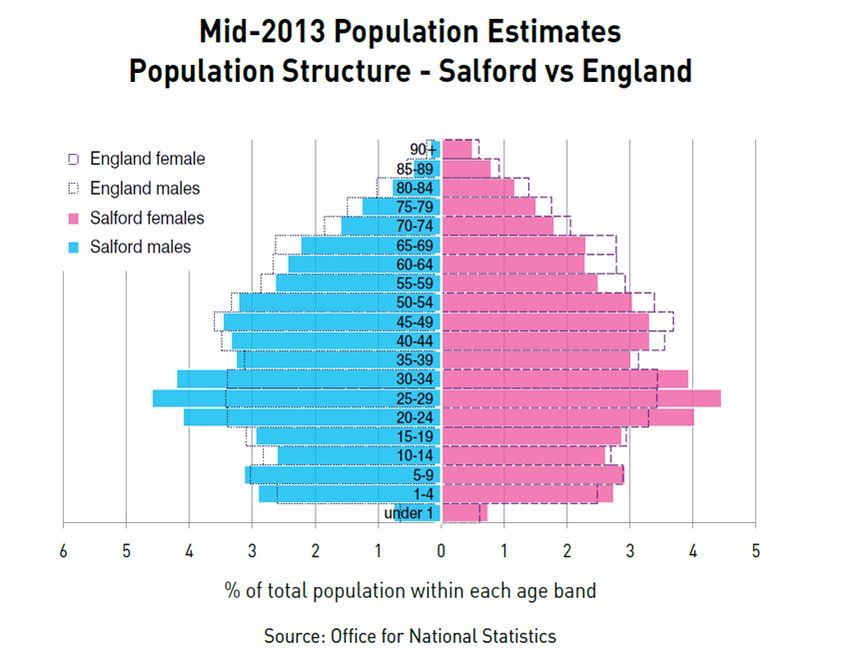
An increase in older people in GM living alone, and at risk of social isolation and
loneliness is forecast, with related impacts on physical and mental health and
wellbeing, with people aged 75 and over at greatest risk.
One in three men aged 75 will be living alone.
An 85% (up to 61,000 people) increase in the number of people diagnosed with
some form of dementia.
In Salford
Salford is a city which celebrates the role of older people. It provides support when needed
to enable older people to live healthy, independent lives for as long as possible, and ensures
that quality care and support is available when needed.
Currently in Salford there are more than 35,000 people aged 65 or older and this number is
set to rise. Whilst many live active lives and bring a valuable resource to the city others have
complex health and wellbeing needs.
Salford has approximately equal numbers of female (117,151 = 50.08%) and male (116,782
= 49.92%) residents.
Figure 1: Mid-2013 Population Estimates Population Structure – Salford vs England
The life expectancy for a man
living in Salford is 75.5 years and
for a woman is just over 80.1
years. These life expectancies
are both below the England
average; around three and a half
years for men and two and a half
for women. There is variation
across areas of Salford of around
12.6 years for males and 8.3
years for females
5
Figure 2: Sub-national Population Projections for all people Aged 65+, 75+ and 85+
Years in Salford shows that the overall picture is that Salford is going to experience an
increasing ageing population over the course of the next 20 years:
Subnational Population Projections for all People Aged 65+, 75+
and 85+ Years in Salford
Source: 2014 Sub National Population Projections
65+ 75+ 85+
20
18
16
Percentage of Population
14
12
10
8
6
4
2
0
2017
2018
2019
2020
2021
2022
2023
2024
2025
2026
2027
2028
2029
2030
2031
2032
2033
2034
2035
2036
2037
2038
2039
People over 65+ years are expected to constitute 18% of Salford’s total population by
2039 (rising from a low of 14% in 2021).
By 2039 people aged 75+ years are expected to make up over 9% of Salford’s
population. This is an increase from approximately 7% in 2017.
There is a slight increase in the number of people aged 85+ years, with an increase
from 2% to 3% from 2017 to 2039.
Map 2: Percentage of All Population Aged 65+ years
The largest concentrations of people aged 65+ years are located in: Eastern Pendlebury,
Swinton North and Walkden South. There is a cluster located where the wards of Weaste &
Seedley, Claremont and Eccles meet. Boothstown & Ellenbrook and Worsley show also
fairly high percentages of 65+ populations.
6Map 3: Percentage of All Population Aged 75+ Years
By 75+years the north-western area of Swinton North, the cluster located where the wards of
Weaste & Seedley, Claremont and Eccles is still present from the 65+ years map. Although
low numbers the highest concentration of people aged 75+ are located in the Barton Moss
area of Irlam.
Map 4: Percentage of All Population Aged 85+ Years
By 85+ years the eastern area of Kersal, the cluster located where the wards of Weaste &
Seedley, Claremont and Eccles is still present from the 65+ and 75+ years maps and Central
and southern Worsley have the highest concentration of people aged 85+ years.
7Salford neighbourhoods
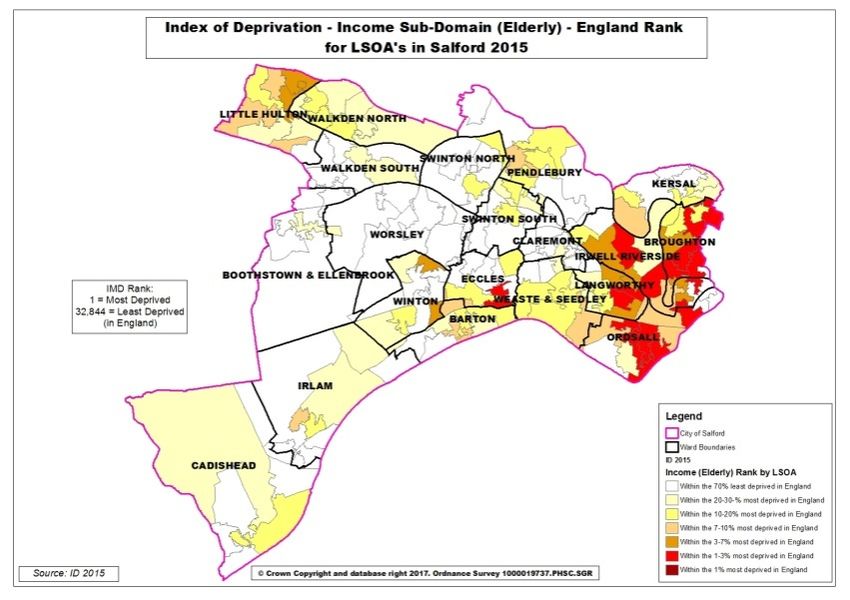
Salford was ranked the 18th most deprived local authority (out of 353) in England according
to the 2010 Index of Multiple Deprivation. However when looking at the overall index of
deprivation across Salford it is evident that the city is very mixed with pockets of affluence
and pockets of high deprivation (see deprivation map below). The main area of deprivation is
centred in several parts of Central Salford (particularly Langworthy, Irwell Riverside and
Broughton) and Little Hulton plus one small pocket at New Lane in Winton, that are within
the 3% most deprived in England. All of Boothstown and Worsley are entirely within the 70%
least deprived in England.
Map 5: Lower super output areas map of deprivation in Salford Elderly.
As can be seen from the map below in red the most deprived areas for older people are
Broughton, Langworthy, Irwell Riverside, Ordsall and Eccles.
8Salford is challenged by having a more deprived population than many areas of the UK. This
results in our population becoming less healthy earlier, almost older earlier, in terms of
morbidity, so having more long term conditions and illnesses compared to other people the
same age in less deprived areas, meaning they have more complex needs in terms of health
and social care support and for a longer period of time.
Ethnicity
In 2011, 200,327 (85.6%) of the city’s population were white British/Irish, a fall of 3,886
(1.9%) since 2001. It is however acknowledged that this does not reflect the full range of
ethnic minority communities within the city.
33,606 (14.4%, England average is 19%) residents belonged to black and minority
ethnic groups, including white non-British/Irish people and white Gypsy Travellers.
Between 2001 and 2011, the number of people in black and minority ethnic groups
increased by 21,731 (+183%, across England by +77%).
The 2011 Census records 18 ethnic minority categories (including five identified as
‘other’ such as ‘other Asian’); 12 of these having more than a thousand residents
each.
Salford’s population is changing, and the older population is getting more diverse as older
migrant communities age, and new and emerging communities settle in Salford and lifestyles
change.
Health and wellbeing of older people in Salford
A significant proportion of health and social care expenditure in Salford relates to older
people (in excess of £100 million per annum), which will increase substantially as the
population becomes older. At the same time, Salford faces unprecedented financial
challenges and the prospect of a sustained period of public spending reductions.
Older people often have long term care needs (frequently associated with chronic health
conditions) and therefore are likely to benefit from better care planning and coordination
across health and social care. Older people are frequently socially isolated, with a poor
quality of life.
They often receive fragmented care, and are not enabled to care for themselves. Salford has
some of the highest rates of emergency admissions and admissions to residential/nursing
care, with too many people receiving end of life care in hospital rather than at home.
Services can fail to address the needs of older people and where care is provided it can be
disjointed and not delivered in the most appropriate setting.
A 2013 article from The Campaign to End Loneliness estimated that “as many as 1 in 10
people arriving at GPs surgeries are there not because they are medically unwell, but
because they are lonely”. 1 in 3 people over the age of 65 years in Salford has a fall at least
once in a year (2nd highest hospital admissions in the country) with 24 to 32% of injurious
falls in Salford affect patients with dementia.
It is already know that loneliness can cause feelings of sadness and distress, but there is an
increasing body of research and evidence showing that loneliness is far more harmful to our
mental and physical health than people often think. One study carried out by Holt-Lunstad et
al in 2010 of 300,000 people found a 50% boost in longevity in people who have a strong
social network. The study even went as far as suggesting that being active in a social
network was as good for long term survival as giving up a 15 a day smoking habit.
9Opportunities of Age Friendly Cities
The approach set out within the WHO Age Friendly City model focuses on wider
determinants of health therefore we can collectively support the reduction of the key areas of
poor health in Salford. Two such areas would be loneliness and falls prevention which would
produce improved outcomes for older people but also improve economic and social
outcomes.
2. What’s already in place across GM and Salford to help us respond to
the challenges and opportunities of an Ageing population
The GM Ageing Hub has been created so that GM partners can coordinate a strategic
response to the opportunities and challenges of an ageing population. GM’s ambition, as set
out in the Greater Manchester Strategy (GMS), is to develop a new model of sustainable
economic growth where all residents are able to contribute to and benefit from sustained
prosperity and enjoy a good quality of life.
The GM Strategy recognises the challenges we will face as the population ages – yet it will
be increasingly important to recognise and address the opportunities. The GM Ageing Hub
will influence the continued development of the Health and Social Care devolution wider
reform in GM and will contribute to the achievement of GMS objectives. The GM Ageing Hub
will ensure ageing is appropriately reflected across all appropriate GM implementation plans.
Table 1: GM ageing hub priorities.
GM will become •Age-friendly design – to understand how urban environments
the first age- can work with and for older people; investment in planning to
friendly city region prepare for future patterns of demographic change; and age-
in the UK friendly homes and communities.
• Changing the narrative - building a positive discourse around
ageing, demonstrating the valuable contribution that older people
can make as entrepreneurs, volunteers, workers and consumers to
support growth and resilience.
• Age-friendly neighbourhoods - build on the age-friendly
neighbourhoods approach to develop age-friendly districts, town
centres and regional centre.
• Consider ageing in all policy areas – to identify the needs of
older people in policy areas such as employment and skills,
business support, transport, housing, health and spatial planning.
GM will be a global • Evidence and innovation – to build on existing evidence base
centre of and pilot new and innovative solutions to the challenges and
excellence for opportunities that ageing societies bring.
ageing, pioneering • Delivery at scale - gather best practice and share learning
new research, across GM districts, and deliver at a GM level those interventions
technology and that will only work at scale.
solutions across • Public engagement – to test innovative forms of engagement
the whole range of and co-production with older people.
ageing issues: • National and international partnerships – to play a leading role
in national networks of expertise on ageing.
Ambition for Ageing (AfA) is a £10 million programme of work which will develop a GM
approach to building Age Friendly Communities. The programme presents an approach to
social isolation that places older people at its centre, ensuring their contribution to civic,
10cultural and economic life is maximised and fully recognised across Greater Manchester.
The programme is delivered by a cross-sector partnership, led by Greater Manchester
Council for Voluntary Organisations (GMCVO) alongside local authorities, voluntary sector
organisations and academics and funded by the Big Lottery Fund (BLF).
Ambition for Ageing has awarded Salford £650,000 over a five year period (2016-2021) and
it is delivered through a partnership of voluntary sector organisations in Salford - Age UK
Salford (lead partner), Inspiring Communities Together and Salford CVS working closely with
Salford City Council and Salford Clinical Commissioning Group.
The delivery model is a neighbourhood targeted approach based in three neighbourhoods:
Broughton, Langworthy and Weaste & Seedley. As part of the programme there is a
large scale evaluation framework which will over time enable Salford to measure how Age
Friendly older people feel Salford is now and if this changes over the next five years. The
evaluation team have agreed that Salford can also use the evaluation framework to measure
progress in all neighbourhoods of Salford. Providing us with a standard measurement tool
for the next five years will help demonstrate the impact of the work which will take place
through this base line plan.
Salford
Salford City Council’s vision is for 'A better and fairer Salford for all' and the City
Mayor’s priorities aims to achieve improved outcomes by:
Tackling poverty and inequality – Significant levels of poverty continue to exist in
many parts of Salford. Working with our partners, we will take action to make things
better for the many households struggling to make ends meet. We must also look to
prevent people from falling into poverty in the first place, building on what we know is
already working, as well as developing new ways of doing things.
Education and skills – Developing skills and a strong education offer. We want
productive local jobs with real career progression and opportunities to develop skills
and talents.
Health and social care – Working with our partners to improve health and wellbeing.
Economic development – Investment that provides jobs with decent wages. We will
use our power and influence to target employers who have a commitment to giving
something back in return – those who offer local jobs, look after their employees and
pay them well.
Housing – Tackling soaring rents and a lack of affordable housing.
Transport – Connecting affordable transport with jobs and skills.
A transparent effective organisation – Delivering effective and efficient council
services.
Social impact – Using social value to make the most difference in Salford. Making
sure council money gets the most 'bang for its buck' for Salford residents
The Salford Together Partnership (Salford City Council, NHS Salford Clinical
Commissioning Group, Salford Royal NHS Foundation Trust and Greater Manchester West
Mental Health NHS Foundation Trust) working alongside along older people and voluntary,
community organisations aims to support older people who are well and healthy stay active
and busy so they stay healthier for longer and support those who have care needs to
improve their quality of life and independence, with an overall focus on improving the health
and wellbeing of all older people across the city.
The Salford Model for Integrated Care – Salford Together - Salford’s Integrated Care
Programme (ICP) seeks to transform the health and social care system, promoting greater
independence with older people and delivering more integrated care. It has a triple aim of:
11 Delivering better care outcomes
Improving the experience of service users and carers
Reducing care costs
This approach will collectively work towards a model which:
Enables older people to live at home for longer
Increases opportunities to participate in community groups and local activities
Improves confidence to manage own condition and care
Provides information to enable older people to know who to contact when
necessary
Increases community support and specialist care when necessary
Supports to plan for later stages of life
The Salford Together Community Asset model originally a project group of Salford
Together continues to use the knowledge and life experiences of older people in Salford by
making their lives better through listening and valuing their views and ensuring this
knowledge is used to influence the improvement of services and build stronger communities.
The approach developed is outlined below:
Age Friendly City – the commitment of the city to support older people to
stay healthy and well.
Older person standards and Wellbeing Plans- the commitment by older
people to support their own health and wellbeing.
Tools designed and developed by and with older people based in local
neighbourhoods – the commitment of community and deliverers to
support older people to stay healthy and well
Start Well, Live Well, Age Well is the name of Salford's Locality Plan and is the ‘blueprint’
for the City’s health and social care.
It explains how the CCG and other NHS providers and commissioners; Salford City
Council and voluntary and community sector organisations will build on what is already in
place so services work better together and help to reduce costs. It looks at what you can do
to stop getting ill and live healthier, independent lives so you do not need to go to the
doctors or hospital as much. It includes ways to reduce your chances of developing the most
common ‘killers’ in Salford, like heart disease and cancer, by taking more responsibility for
your own health.
The plan doesn’t just look at health and social care. It also looks at ways people’s lives can
change for the better if we have better housing, more jobs, more money and a nicer
environment to live in. Put simply, it is how Salford people should be able to start, live and
age well.
Housing - Where older people live in Salford.
Salford has a number of reports and assessments relating to housing condition, need and
demand and Promoting Independence is Salford’s housing strategy for people as they
age in Salford 2008-2018 drew the strands together to reflect and steer the future housing
and support needs of older people in Salford.
The number of households with a household head aged 65 or over is lower in Salford than
for the region overall (25.42% compared to 26.86%).
12There was also a large proportionate increase in the number of households aged over 85
(19.64%) although there was a big decline of 1,040 households in the 65-84 age group.
Owner occupation: Whilst Salford has lower levels of owner-occupation than the
national average, the proportions are changing as the levels of owner occupation
increases. Currently just over 40% of older people reside within the owner occupied
sector and given the recent growth in owner occupation this is one of all the possible
tenures that are projected to see the biggest increase.9.9% of older people with a
support need are owner-occupiers with a mortgage.
Sheltered housing: The majority of Salford’s sheltered Housing is owned by
Registered Social Landlords. There are currently 49 sheltered schemes (Category 2)
across the City. In addition to this there are 6 Extra Care schemes units within
Salford.
Private rented: In Salford, the numbers of older people living in the private rented
sector is low at just under 5% when compared to the numbers either in social
housing or in owner occupation. But whilst the numbers of older people living in the
private rented sector is small in comparison it still represents a significant number
when compared nationally – one in ten in Salford as opposed to one in twenty
nationally.
Disability - Sensory disability and physical disability represent the highest
percentage among older people in Salford with 41.4 %, and 41.1% respectively.
Private rented - Although there are good private landlords, some of the poorest
housing conditions are to be found in the private rented sector and older private
tenants are often reluctant or unable to enforce their right to repair through fear of
eviction or confrontation. This is disproportionately true of the over 75 year olds
where 9.5% aged 75 to 84 and 15.1% aged 85+ (compared with 7.7% and 11.4%
nationally) rent from private landlords. Two out of thirteen of the most inherently
vulnerable people amongst our older population live in what can be described as
potentially vulnerable circumstances.
Owner-occupier - A proportion of the older owner-occupiers will have difficulties
maintaining their homes, some of which are in poor condition and lack central
heating. There are significant levels of older owner-occupiers living in houses who
will require equipment and adaptations as they become less mobile. There are
significant levels of owner-occupation in areas with high BME populations. BME
groups have generally lower levels of awareness of the services that are available to
help them remain independent. This is compounded by the lack of appropriate
culturally sensitive housing services for diverse needs.
Demand for housing and housing related support services - Whilst the long-term
population predictions can provide us with an indication of the numbers of older
people, they cannot predict what the aspirations of older people will be as these will
also continue to change. Although currently there is a relatively small population from
BME communities living in Salford, our research indicates the numbers are growing.
There is therefore a need to develop effective services capable of meeting diverse
cultural expectations. As people settle and age, there will be a more diverse older
population in Salford in future years and this will impact on demand for housing and
housing related support. As well as the provision of good quality housing the council
is either responsible for, provides funding to or jointly commissions other related
support services to help the majority of people aged 60+ to continue to live
independently in their own home as opposed to being in supported or residential
accommodation.
Table 2: The strategic aims for Promoting Independence are:
STRATEGIC STRATEGIC STRATEGIC STRATEGIC STRATEGIC AIM
AIM 1 AIM 2 AIM 3 AIM 4 5
13Older people are Housing is of A range of A range of All Partners will
able to choose the a good housing support recognise the
most suitable living standard and options are services and role they can play
arrangements for is suitable for available to facilities are in delivering
them because the needs people as they available to better housing
there is easy and age. people as they and support
access to preferences age to enable services for older
information about of older independent people, and both
housing options, people. living. individually and in
support services partnership seek
and facilities, to to achieve this.
people as they age.
Community and Outdoor Space
In December 2015 7,168 assets had been mapped by Salford City Council with 590
community resources identified (including 163 places of worship; excluding schools and
colleges). Over 20 of these assets provide services across the city. Some provide services
for more than one protected characteristic (e.g. the Young People’s Disability Group is in
place for both Age – Young People and for Disability).
This asset mapping exercise reveals 53 resources across Salford specifically in place to
support older people, and includes citywide services, for example Age UK Salford.
Table 3: Neighbourhoods by Green Spaces
Neighbourhood Green Public Total % of Resources
space by accessible city green specifically
hectares green space by space for older
2014/15 hectares people
2014/15
Claremont and Weaste 87.3 54.0 .3% 6
East Salford 294.9 190.5 12.9% 4
Eccles 135.9 103.2 6.6% 6
Irlam and Cadishead 286.9 109.9 14.0% 6
Ordsall and Langworthy 65.4 31.0 3.2% 7
Swinton 426.5 336.1 20.8% 6
Walkden and Little Hulton 370.5 192.5 18% 9
Boothstown 417.2 124.4 20.3 9
In terms of community and outdoor space Salford could benefit from more traffic calmed
streets, clean air and green space, as well as the availability of well-maintained and
uncluttered pavements, access to toilets and benches in public areas. These are all
important in supporting older people to live healthy independent lives.
Where someone lives can have a positive or negative impact on their experience of ageing.
Crime and anti-social behaviour within a neighbourhood, for instance, may discourage older
people from going out and fully participating in their community. Feeling safe encourages
people to be more active as they age. Over the last five years (2001 – 2016) crime in Salford
has fallen by over 21%, which equates to over 4,000 fewer victims of crime. In the last three
years the levels of recorded crime have begun to rise nationally but in Salford we have
maintained a small reduction in crime of 3% and, compared to Greater Manchester, we have
reduced levels of violent crime, domestic burglary and other crimes that matter most to
people.
14Getting About
Transport in Salford 2025 reflects the need to represent the greatest benefit to Salford’s
residents and is underpinned by a series of key objectives and principles. These align with
the Regional Centre Transport Strategy, The Greater Manchester Third Local
Transport Plan and Salford’s Sustainable Transport Strategy. The key principles of this
Vision are that it must:
Support aspirations for economic growth and job creation by connecting people to
opportunities and reducing congestion;
Promote sustainability through the provision of a high quality, reliable and convenient
integrated transport network which allows all people to travel where they want, when
they want;
Seek to reduce transport generated carbon emissions by tackling congestion and by
facilitating and promoting the use of environmentally friendly modes of transport;
Improve safety for all by tackling problem areas, setting appropriate speed limits,
providing adequate facilities for vulnerable users and ensuring road safety audits are
undertaken for all new highway schemes;
Develop a framework to promote access for all, to cover all modes and users of all
levels of mobility; and
Control through traffic in the area to help facilitate well-designed streets and public
spaces and improve the environment (especially air quality).
Salford faces many transport challenges with interchange often perceived as a barrier to
movement and a number of key destinations for Salford’s residents could still be considered
hard to reach which can be a barrier for older people who rely on public transport to move
around the city.
The Salford Transport Strategy aims to provide more transport choices for all those who
travel in Salford by supporting the creation of a fully integrated transport system, reducing
the need for interchange and supporting sustainable travel solutions
By meeting these challenges head on with commitment and creativity, transport can be the
engine for economic growth, help achieve central government’s carbon reduction targets,
and improve the quality of life for everyone.
15You can also read