CA17134 - Optical synergies for spatiotemporal SENSing of scalable ECOphysiological traits - (SENSECO)
←
→
Page content transcription
If your browser does not render page correctly, please read the page content below

CA17134 - Optical synergies for spatiotemporal
SENSing of scalable ECOphysiological traits
(SENSECO)
Proposers: J. Verrelst, M. Schlerf, A. Mac Arthur, M. Cendrero-Mateo,
S. Van Wittenberghe, H. Aasen, A. Hueni, K. Sakowska, C. van der Tol,
L. Kooistra, M. Machwitz, J. Pacheco-Labrador, L. Eklundh and many more

   EUROSPEC             OPTIMISE             SENSECO
   (2009-13)            (2014-18)            (2018-22)

 Joint remote sensing and plant phenotyping workshop 10 Feb 2021
WG1: Closing the scaling gap      WG2: Closing the temporal gap

                                          event
                                                                  events

                                                   Seasonal parameters

                                 WG 4: Establishing data quality
                                   through traceability and
WG3: Realizing synergy between
                                          uncertainty
passive EO spectral domains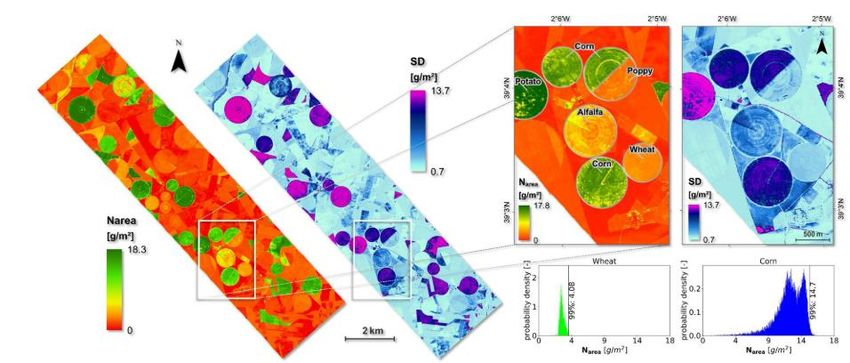
Further information

          Joint remote sensing and plant phenotyping workshop 10 Feb 2021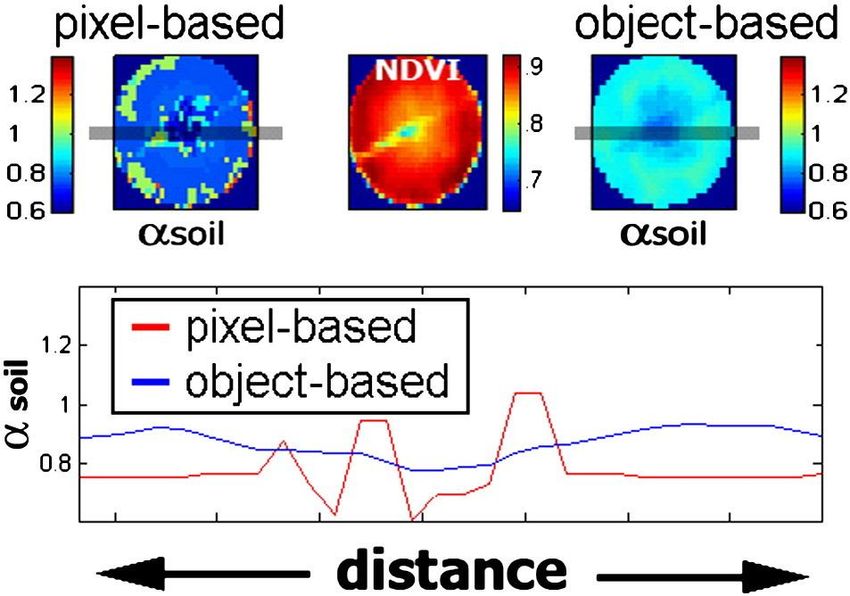
Remote sensing of vegetation –
 some claims on selected traits
                       Martin Schlerf
with input from Katja Berger and the joint SENSECO-WG3 and
               Phenotyping discussion group

 Joint remote sensing and plant phenotyping workshop 10 Feb 2021
Aim
                                                             • While brainstorming on common interests between
                                                               remote sensing and phenotyping communities, the
                                                               following question emerged:
                                                             • Using RS methods, can we measure physiological
                                                               variables and processes, for instance biomass,
                                                               growth, nitrogen, stress? How? Accuracy?
                                                             • “Modern plant phenotyping relies on a couple of
                                                               rapidly developing pillars, e.g. non-destructive
                                                               measurements to be able to follow a trait over
                                                               time…” (Corrado Costa et al. 2019)

                                                             • → Some comments & claims on:
                                                                • Nitrogen content
                                                                • PRI for LUE
                                                                • Other aspects

From Mahlein 2016
                Joint remote sensing and plant phenotyping workshop 10 Feb 2021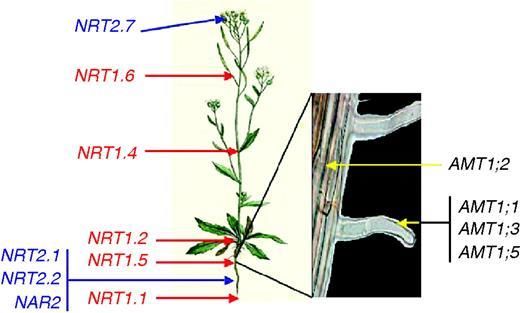
Available traits and retrieval methods
Functional vegetation traits are generally of
continuous nature and can be grouped into diverse                                                    RETRIEVAL
subgroups (see e.g., Weiss et al., 2020):
❖ biophysical (e.g. leaf area index, fCover, biomass)
❖ biochemical (e.g. leaf chlorophyll content, leaf
                                                                 Regression models                  Hybrid methods              Mechanistic models
  nitrogen content)
❖ structural (e.g. plant density, leaf inclination)
❖ biological (e.g. light use efficiency, NPP, yield)
❖ physiological (e.g. stomatal conductance)
                                                                                                                    Radiative                 Process
❖ geophysical (e.g. soil moisture, conductivity)                Parametric          Nonparametric
                                                                                                                 transfer models              models

                                                             Linear               Nonlinear regressions          Physically-based inversion        Assimilation
                                                             regressions

                                                             Adapted from Verrelst et al. (2019a)

                          Joint remote sensing and plant phenotyping workshop 10 Feb 2021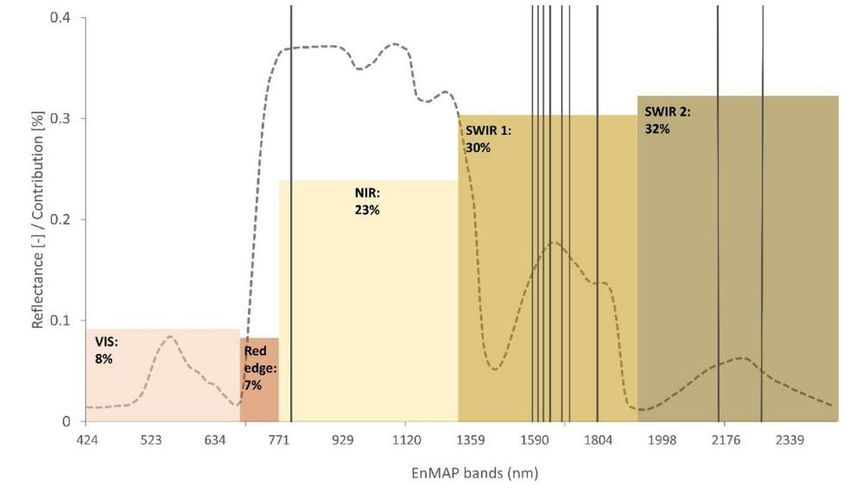
Available traits and retrieval methods
Parametric                                                                       Adapted from Verrelst et al. (2019a)
▪        Narrowband vegetation indices (NB-VI), using discrete selected bands
         to formulate simple ratio or normalized difference, e.g. Glenn et al.
         (2008)                                                                                                                RETRIEVAL
▪        Spectral positions (red edge inflection point, REIP), e.g. Cho et al.
         (2008)
▪        Spectral derivates, e.g., le Maire et al. (2004)
▪        Spectral integrals, e.g. Pasqualotto et al. (2018)                               Regression models                   Hybrid methods             Mechanistic models
▪        Continuum removal, e.g. Malenovsky et al. (2013)
▪        Wavelet transform, e.g. Blackburn & Ferwerda (2008)

    Non parametric linear
                                                                                                                                              Radiative              Process
    ▪    Chemometrics, e.g. PLSR                                                         Parametric           Nonparametric
                                                                                                                                                                     models
                                                                                                                                           transfer models
    Non-parametric non-linear (ML)
    ▪   Artificial neural networks
    ▪   Extreme learning machines                                                                                                              RTMs
                                                                                      Linear                Nonlinear regressions          Physically-based
                                                                                                                                            PROSPECT inversion            Assimilation
    ▪   Decision trees                                                                regressions
    ▪   Bagging trees                                                                                                                          PROSPECT-PRO
    ▪   Boosting trees                                                                                                          ML+RTM         SAIL-models
    ▪   Kernel ridge regression                                                                                                                SCOPE model
    ▪   Support vector regression                                                                                                              INFORM model
    ▪   Relevance vector machine                                                                                                               DART model
    ▪   Homoscedastic Gaussian process regression                                                                                              FLIGHT model
    ▪   Variational Heteroscedastic Gaussian process                                                                                           and many more
        regression
                                               Joint remote sensing and plant phenotyping workshop 10 Feb 2021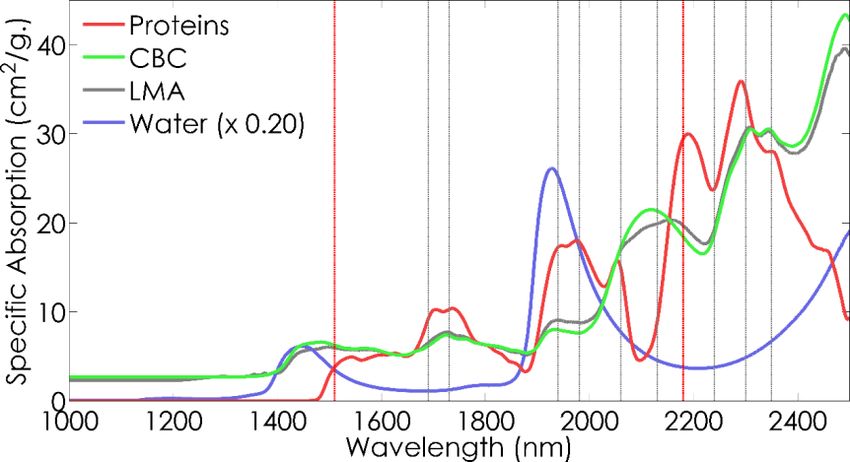
Are RS N quantities relevant to plant scientists?
                                                                    Interest in uptake, assimilation, translocation and, when the
Level       Variable       Definition                Unit
                                                                    plant is ageing, recycling and remobilization

Leaf        concentratio   Mass of N per mass        %
            n              dry matter
            content        Mass of N per leaf        mg / cm2
                           area
Canopy      concentratio   Mass of N per mass        %
            n              dry matter
            content        Mass of N per ground      g / m2
                           area
Plant       uptake         a.   Dynamic process
tissue or                  b.   N concentration      g
whole                           multiplied by dry
plant                           matter
                                accumulation
Plant to    nitrogen use   Output / input            unitless
field       efficiency     (e.g. grain yield per
                                                                Nitrate uptake occurs at the root level and two nitrate transport
                           unit of nitrogen
                           available from the soil              systems have been shown to coexist in plants and to act co-ordinately
                                                                to take up nitrate from the soil solution and distribute it within the
Nitrogen quantities; marked yellow= open to RS                  whole plant (Masclaux-Daubresse et al 2010)
Indirect N estimation through N-Cab link
• moderately strong correlation between leaf N and Cab exists across different species (r = 0.65 ± 0.15)
  (Homolova et al. 2013)
• Canopy chlorophyll content can be well retrieved from CIred-edge = R800/R710 − 1)

  Clevers and Gitelson 2013
Indirect N estimation through LAI-CNC link
 R (2017)     LAI       Cab        FM        DM         LNC       CNC       CCC
    LAI      1.00
   Cab        0.31      1.00
    FM       0.86        0.34     1.00
    DM        0.73       0.38     0.92       1.00
   LNC       -0.32      -0.08     -0.58      -0.70     1.00
   CNC       0.81        0.44     0.84       0.81      -0.23      1.00
   CCC       0.90        0.68     0.81        0.74     -0.30      0.81      1.00

 Data from n=181 wheat samples measured in 48 plots over 4 campaigns in 2017
 in France and Belgium (Bossung, Schlerf, Machwitz 2021, in prep.)                                      CNC
                                                                                             CNC (Can.-N-content) from Sentinel-2

• Claim: If canopy nitrogen content CNC (g/m2) is well linked to biomass (FM) and also to LAI, and not linked to LNC,
  we can use multi-spectral satellite data and common LAI retrieval methods plus empirical LAI-LNC relation to map
  CNC
• This may be the case on fertilised agricultural fields where LNC is typically at high levels with little spatial variation
  (But: dilution effect – LNC drops with increasing biomass during growth)

                       Joint remote sensing and plant phenotyping workshop 10 Feb 2021
Direct empirical N estimation
• Direct reflectance – N link, only empirical methods
• 20 studies: R2 = 0.6-0.8, relative RMSE = 10-20% Homolova et al. 2013
• selected wavelength often relate to red edge region and protein absorption features,
but vary between studies
• In principle not transferable to other datasets
Overview of spectral wavelengths used in scientific literature for estimation of
nitrogen concentration and content in green and dry plant leaves (Homolova et
al. 2013)
.Direct physically-based via protein features
• Earlier attempts to incorporate N into PROSPECT were abandoned
due to its strong covariance with other leaf compounds leading to
inconsistent results (Jacquemoud et al., 1996).
• The idea has recently been re-vivied by Feret et al. 2020 with the
PROSPECT-PRO model
• PROSPECT-PRO was coupled with SAIL to PROSAIL-PRO and the hybrid
inversion approach allows to map CNC, uncertainties and the relative
contribution of important wavelengths (Berger et al. 2020)
• Claim: The approach could replace the empirical ones and has better (Féret et al., 2020)
generalisation potential; masking effect by leaf water in fresh leaves
and confounding effects by cellulose and lignin?
Berger et al. 2020b Berger et al. 2020b
Joint remote sensing and plant phenotyping workshop 10 Feb 2021Photochemical reflectance index (PRI) Gamon et al. 1990
• Requires reflectance at 531 and 570 nm
• Based on slightly differing absorption spectra of viola-xanthin
(non-stressed) and zea-xanthin (stressed) around 531 nm
• 570 nm is insensitive to xanthins change and used as a control
• Details: Under conditions of excess light, when the absorbed PAR can
not be processed through photosynthesis, the xantophyll pigment
viola-xanthin is de-epoxidized to zea-xanthin; this reaction is readily
reversed under limiting light. So the relative concentrations of these
xantophyll pigments may be used as an indicator for short term
changes in photosynthetic activity.
• PRI has been interpreted as an indicator of LUE and together
with an indicator of fAPAR can be used to estimate GPP
• Limitations
• The relative change in R is very small (~0.5% absolute R)
• Many confounding effects: LAI changes, leaf movement,
sun and viewing angles, soil background and shadows
• But: It also acts as index of the chlorophyll/carotenoid ratios
and links to long term changes in PS activities (aging, stress)
Penuelas et al. 2011
Joint remote sensing and plant phenotyping workshop 10 Feb 2021PRI-LUE Garbulsky et al. 2011
ECOSYSTEMS
Relationships between leaf scale photosynthetic RUE Relationships between eddy covariance derived RUE calculated from eddy covariance derived GPP and
(RUE = Net photosynthetic rate/incident PPFD) and PRI photosynthetic RUE (RUE = GPP/APAR) and PRI for absorbed PAR (RUE = GPP/APAR) and PRI from MODIS
for different types of vegetation different types of vegetation data for 2 types of forest
Claim: Despite the many potentially confounding factors surprisingly simple optical RS methods (e.g., PRI) allow us to
explore ecosystem photosynthetic behaviour (e.g. PRI explained 42-67% of the total variance of LUE at all spatial scales
from leaves to ecosystems), but the use of a general LUE–PRI relationship without a proper calibration is still hindered
due to methodological differences in the studies, types of vegetation, and other factors (Garbulsky et al. 2011)
Authors stress the need for standardised protocols and datasets for a general relationship general LUE–PRI relationship
Joint remote sensing and plant phenotyping workshop 10 Feb 2021Use of the Normalized Difference Vegetation Index
• now the most popular index used for vegetation Atmosphere effect
assessment (12,618 in the 2010s, Huang et al. 2021) on red and NIR
bands
• UAS boom makes NDVI more popular over time
• NDVI is affected by
• atmospheric effects (use of reflectance instead of raw data)
• Is sensor dependent (e.g., the location of the wavebands)
• its ease for saturation
• High spatial resolution effect (shadows etc. in drone images)
• NDVI has been known to depend on the
• fraction of vegetation in a pixel (primary effect)
• even for full vegetation cover, the NDVI varies with chlorophyll
concentration and leaf structure (secondary effect)
• changing view and illumination angles affect ratios between Red and
NIR reflectances (tertiary effect)
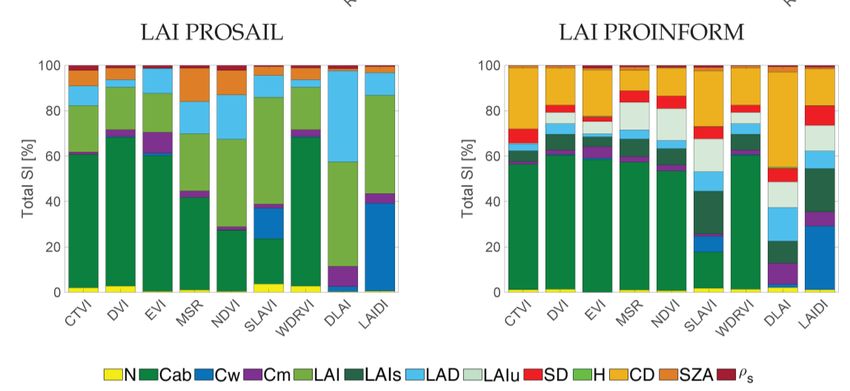
• Now GSA offers a quantitative understanding of the
confounding effects of for instance NDVI-LAI relation
Claim: NDVI is generally useful if it is obtained with reliable
sensors and data processing and after careful checking for
plausibility; Data analysts and data providers should educate Sensitivity of NDVI and other vegetation indices studied by means
NDVI users as much as possible (Huang et al. 2021). of a global sensitivity analysis (Morcillo-Palarés et al., 2019)
Joint remote sensing and plant phenotyping workshop 10 Feb 2021Spatial and temporal aspects
• Common problem in inverse modelling: one spectral measurement
can lead to multiple solutions of vegetation and soil properties.
• Object-based approach (e.g. Atzberger 2004)
• takes into account not only the spectral signature of the pixel of
interest but also of the neighbouring pixels.
• Retrieved variables are smoother within an object (e.g. parcel)
and more realistic
• Time series retrieval approach (e.g. Yang et al. 2021)
From Atzberger and Richter 2012
• Assumes that temporally near attributes are more related than
distant ones
• more robust and smoother time series of LAI than independent
retrievals (from individual scenes) and better matching with field
measurements
• Claim: RS approaches should exploit more the spatial and temporal
aspects of vegetation for reduced uncertainties
Kindly provided by Peiqi Yang (from Yang et al. 2021)Thank you!
You can also read