Canadian Investment Funds Industry: Recent Developments and Outlook - IFIC.ca
←
→
Page content transcription
If your browser does not render page correctly, please read the page content below
Canadian Investment Funds Industry: Recent Developments and Outlook
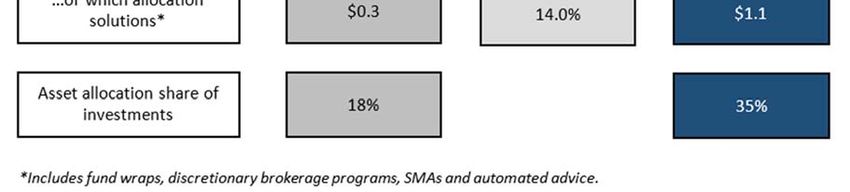
Table of Contents

Introduction………………………………………………………………………………………………………………………….………………….….3
Resources and Methodology……………………………….…………………………………………………….…………………….………4
Executive Summary……………….……………………….…………………………………………………..…………………………………….5
Role of Investment Funds………………………………………………………….……………………………………..………………….…10
Investment Fund Distribution Channels…………………….………………….……………….………………………………….16
Fee-based Accounts…….…………………………………………………………………………….………………………………..………….23
Competition …………………………………………………………….……………………………………………………………………………….30
Developments and Innovation in Investment Products……....……………………………….………………….…..36
Impact of Technology…………………………………………………………………….…………………………………….…………………44
Conclusions and Outlook .……………………………….………….………………………..………………………………..…............47

Introduction
The International Investment Funds Association reported that, at the end of 2018, total
worldwide assets in mutual funds (open-ended and fund of funds), and exchange-traded
funds (ETFs) were $50.4 trillion, with ETFs making up 9.3% of the total1. These assets were held
in approximately 126,000 different funds. Whatever statistics are used, it is evident that the
global investment funds market remains substantial and complex.

This report has been commissioned by The Investment Funds Institute of Canada (IFIC) to
act as a point of reference about the current state of the investment funds industry in Canada,
and the changes that have taken place in the business environment in which the Canadian
investment funds industry operates.

Investor Economics, a Strategic Insight business, has structured the report on the basis of key
themes and areas of unique development, such as the shift from commission-based
accounts to fee-based accounts. The report examines, at a high level, the role of investment
funds in the day-to-day savings and investing activities of Canadians; the products that have
been and continue to be used by savers and investors; how these products are accessed by
Canadians of various levels of wealth and investment knowledge; and the nature of the
changes to the various elements within the investing cycle and environment that have
occurred over the past decade.

Despite the severe capital market difficulties of the early part of the decade, changes in
regulations impacting both manufacturers and dealers, and the shifting demands of financial
consumers, the Canadian investment funds industry has recorded steady growth in assets
while, at the same time, taking advantage of the scale of the industry to reduce costs
associated with the purchase and holding of investment funds.

The report does not provide detailed analysis of specific issues but, rather, seeks to present
topics in a straightforward and objective manner in order to provide a background to
discussions by industry participants of all types.

1
    IIFA Industry Statistics: Fourth Quarter 2018.

                                                                                               3
Resources and Methodology
The development of this report has relied heavily on the databases maintained and managed
by Investor Economics, the leading independent authority on investment funds in Canada.
In addition to the databases, considerable use has been made of the ongoing analysis of the
investment fund industry undertaken by Investor Economics in Canada and its parent
organization, Strategic Insight, in the United States and other major markets.

Over and above these proprietary resources, IFIC data and third-party survey results have
also been used to provide evidence of the various developments referred to in the report. As
necessary, Investor Economics has also accessed reports, presentations and articles dealing
with the key issues mentioned in the report. Care was taken to ensure the quality and integrity
of third-party sources.

Where any non-proprietary sources have been used, appropriate references have been made
in the report. In cases where explanations or additional comments are appropriate, footnotes
have been used.

Throughout the report, information sources have been recognized using references within
the text of the report. Year-end 2018 data has been used where available; in cases where the
data is not available for 2018, the most up to date data available to Investor Economics has
been used.
Executive Summary
At the end of 2017, investment funds, which include mutual, individual segregated and
exchange-traded funds, reached $1.6 trillion in assets in Canada. This represented 36.1% of
total personal financial wealth—a measure of discretionary financial assets that excludes
equity in real estate and assets held in defined benefit pension plans. Investment fund assets
have grown consistently in Canada (and most developed countries globally) over the last
decade as a by-product of rising capital market valuations and healthy economic growth,
which contributed to generate sustained levels of household savings.
Beyond the favourable macroeconomic environment, however, a number of factors
endogenous to the financial services industry have had a great influence in the growth of
investment funds in Canada and beyond. Changing advisor practices, innovations in
product design and the growing scale of the business have all contributed to make
investment funds one of the fastest-growing cornerstones of household financial wealth.
Nearly half of all Canadian households owned mutual funds in 2017 and almost two thirds of
their registered retirement savings plans (RRSPs) were held in the form of mutual funds.
Influences on product design
The number of seniors aged 65 and older outnumbered children aged 15 and under for the
first time in 20162. This changing demographic profile of the Canadian investing public has
exerted, and will continue to exert, impact on the various aspects of the investment funds
industry. This impact ranges from product design, through to the type of delivery needed, to
the willingness and possibilities of households to save, to the ability and desire to assume
investment risk and to the length of the investment time horizon.
As demographic trends develop, investment fund managers and distributors face two
dilemmas: How can they meet the needs of those over 65 who seek income and capital
preservation solutions, along with face-to-face contact with an experienced advisor, at the
same time as they retool themselves to attract the attention of millennials which may favour
alternative approaches to investing? And also very importantly: How can they assist millions
of pre-retirees who are still unprepared to fund their retirement both from a personal and
group savings standpoint, in growing a sufficient portfolio?
Beyond the overarching demographic trends, fund product developments have also been
influenced by four factors likely to continue over the medium term. First is the changing
nature of competition at a product manufacturing and a distribution level and the emergence
of non-traditional competitors, followed by regulatory changes focused on investor
protection through enhanced transparency and investor education. Third are the changing
attitudes of investors toward risk and value as they look to preserve capital, and, lastly, is the
ongoing impact of new technologies on all stakeholders. All these factors will determine,
individually and collectively, product design, pricing and features.
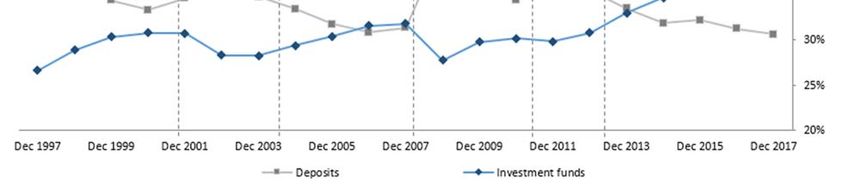
These influences and issues have created an environment that has spawned two specific and
far-reaching trends: The rapid expansion of the ETF product shelf and their positioning as
both a complement and a competitor to mutual funds, and the movement from conventional
stand-alone funds toward fund-based asset allocation solutions, such as fund wraps.
2
https://www150.statcan.gc.ca/n1/pub/11-627-m/11-627-m2017016-eng.htm
5The growth of exchange-traded funds In 2008, Canadian ETFs represented 2.9% of total investment fund assets. By 2018, that share had increased to 9.3%. The asset growth and proliferation of ETFs experienced in recent years reflects an interplay of a number of factors. ETF issuers emerged from the 2008-2009 bear market with renewed vigour to cultivate relationships in, and engage with, a wide range of direct, advice and institutional investment delivery channels. Over the past decade, helped by strong equity markets which boosted investment returns of these mainly index-tracking investment vehicles, ETF issuers have successfully built a presence in advisor-led investor portfolios and on diverse product and distribution platforms. ETFs have become a ubiquitous portfolio construction tool for retail advisors, self-reliant investors and institutional portfolio managers, attracted by the vehicle’s liquidity, diversification and cost characteristics. The latter feature could be leveraged in an environment of growing scrutiny of the costs associated with owning investment products fuelled by regulatory and media interest. Similarly, the continuing shift towards unbundled advisor fee-based models, in which an advice fee is charged outside of the product expense structure, expanded the distribution opportunity for ETFs. Against the backdrop of these factors, the past decade saw the ETF asset base expand rapidly as strong equity market returns buoyed valuations and both the availability and the product range increased significantly. Despite its generally positive experience and prospects, the ETF sector faces a number of challenges. Firstly, ETFs may be perceived to be subject to market risk, liquidity risk and concentration risk, factors which may not be suitable to every individual3. Secondly, scale is more important to low-cost providers and reaching a level of assets and revenue required to be profitable is difficult, particularly for new entrants and independent issuers. Thirdly, competition has intensified, as a growing number of companies, as well as major domestic bank-owned managers, have launched ETFs over the past five years. Also, competition does not respect borders, as Canadian ETFs coexist with U.S.-listed ETFs in the platforms where they are available. Finally, product proliferation and commoditization make it difficult for issuers to take advantage of novel products and strategies for long as competitors are quick to imitate products that are well received by investors and advisors. Fund wraps gaining share Asset allocation solutions have been gaining ground globally over the last decade. Both fund- based asset allocation solutions (fund wrap programs) and fee-based accounts, where advisors have discretion to execute and rebalance a diversified portfolio, have grown significantly in recent years as technological advancements, the scale of the business and overall competitive dynamics combined to allow fund services providers to deliver more value for the same (if not declining) price. Fund wraps have, over time, eroded the market share held by stand-alone funds. At the end of 2013, stand-alone funds held a 72.6% share of the mutual fund market, a share which declined over the five-year period to 62.9% in 2018. The product benefitted from several previously mentioned trends (such as the need to manage market risks), but also from its time efficiency features for advisors. By delegating asset allocation, investment selection and rebalancing to professional overlay management teams engaged by fund wrap manufacturers, advisors—primarily in the financial advisor (FA) and branch advice (BA) channels—have gained bandwidth to focus on working with their clients on their financial needs and financial plan construction. 3 Patricia Meredith and James L. Darroch, Stumbling Giants: Transforming Canada’s Banks for the Information Age, (Toronto: Rotman-UTP Publishing, 2017), 103-104.
Distribution of investment funds.
Currently, do-it-yourself channels, online advice (often referred to as robo-advisors) and
direct-to-investor channels, remain largely the expansionary domain of ETFs. Hybrid
channels that combine the best elements of digital- and advisor-based channels, are set to
expand at higher rates than those of the conventional advice-based networks and will likely
carry all investment funds with them. Penetration by deposit-takers is expected to increase
as the banks’ dedicated mass affluent sales and service models expand wealth management
at the branch level. Insurance companies, which intensified their focus on the wealth
management business after the market event of 2008, have leveraged their growing
ownership of the mutual fund-centric dealers in the financial advisor channel to expand their
presence and a number of independent dealers have also continued to expand their asset
base.

The shift to unbundled fee-based advisor practice models represents one of the most
significant changes in practice management across the advisory channels over the past two
decades. The full-service brokerage (FSB) channel led this charge in the early 2000s,
accelerating following the 2008 downturn, and has been more recently joined by the dealers
in both the FA and BA channels. By 2026, it is expected that $2.9 trillion in assets will be held
in discretionary and non-discretionary fee-based accounts, across all distribution channels,
an increase of $2 trillion, the equivalent of an 13.0% compound annual growth rate over the
decade4.

Drivers of the move to fee-based accounts
A number of factors will continue to drive the movement to fee-based practice models,
including specific practice management decisions made by advisors and their firms, as well
as external factors such as recent and expected regulatory changes. These factors are
motivating dealers and their advisors to develop business models that are increasingly
transparent and flexible with respect to fees and that closely align their practice interests with
those of their clients. The ongoing shift to fee-based practices has led asset managers to
increase their shelf of F-series mutual funds and incorporate ETFs. Asset managers have also
been sharpening their pencils to ensure the pricing of their products is attractive to these
advisor practice models.

Concerns exist that the move in favour of fee-based accounts may represent a disadvantage
to small investors and may limit the amount of advice available to those who may need
financial guidance. This has been the case in both the U.K. and Australia, where changes to
account structures, brought on by regulation and not by market forces, have taken place. It is
germane that the shift to fee-based has been the strongest in the FSB channel where the
target client segment is further up-market than in the financial advisor channel. Not lost in
the equation is that the shift in the FSB channel had been well underway before the
introduction of the Client Relationship Model – Phase 2 (CRM II) or the more recent
introduction of client focused reforms and changes to mutual fund fee structures.

4
    Investor Economics' Household Balance Sheet Report—Canada 2017, Appendix 13: Statistical Tables.

                                                                                                       7
Competition
The Canadian investment funds industry is a mature industry, demonstrated by both its
relative size and its level of concentration. At the end of 2017, 145 managers accounted for
$1.6 trillion in fund assets. Of that total, 65.6% of assets under management (AUM) were
managed by the top 10 firms, five of which were bank-owned.
Among other factors, business concentration has been impacted by the size of mergers and
acquisitions (M&A) activity. Over the five-year period ended 2017, there were 10 transactions
in the Canadian investment funds industry involving the transfer of approximately $23.8
billion in AUM. Yet despite transactions aimed at consolidation, there have also been a
number of new entrants over the past decade, although their record of success has been
mixed.
This activity within the industry suggests that there are fewer barriers to entry than there are
barriers to achieving significant scale. These barriers include constraints on the shelf space
of dealers and advisors; the absence of a unique selling point or competitive advantage for
many fund products; difficulties for the firm to invest heavily in technology; and an inability
to attract or, in some cases, to retain, innovative and experienced talent. Additional hurdles
that may restrict new entrants include the dominant position of a small group of managers;
pricing levels that prevent a reasonable break-even period; current and possible additional
industry regulatory changes that may impose costs on firms either unprepared or unable to
bear them.
These barriers and the overall level of maturity of the industry argue against medium-term
expansion of the industry in terms of participant numbers, particularly within the mutual
fund sector. It is worth noting that concentration, at an even faster pace, has been also
witnessed in the two primary advice-based channels; those regulated by the Investment
Industry Regulatory Organization of Canada (IIROC) and those regulated by the Mutual
Funds Dealers Association of Canada (MFDA).
Technology
Asset and wealth managers recognize that technology is an essential part of the infrastructure
of the investment process, irrespective of whether the application of technology is in the area
of research, investment selection, trading, risk management, operations, or client servicing.
Pressure to accelerate change through the application of technology has been exerted
through a combination of factors already discussed, including margin pressures and investor
demand for greater value at a time when digital service expectations are growing and the
opportunity to become more self-reliant is increasing.
Greater operational sophistication in both the middle- and back-offices, improved
investment selection and multi-platform distribution are all advantages that will accrue to
the asset and wealth management industries through the adoption of technology. One area
of risk associated with technology that is coming to the forefront for both asset managers
and their clients is cybersecurity and the protection of client data and other personal
information, which is now recognized as one of the leading risks that has to be managed by
the financial services industry5.
Both the application of technology and the expanded use of digital tools and channels have
some fundamental implications. Many larger firms are, and will remain, more able to make
the necessary capital investments in technology than will their smaller counterparts. While
the application of technology is likely to reduce costs over time through the displacement of
5
https://www.brookings.edu/wp-content/uploads/2018/10/Healey-et-al_Financial-Stability-and-Cyber-Risk.pdfpersonnel, the immediate impact of the implementation of a technology strategy will often
involve higher operational costs.
There is also the risk that the asset and wealth management industries will attract the
attention of extant technology-based businesses, whether start-ups or established
companies, such as Amazon. These businesses will be encouraged by the slow-to-adopt
nature of wealth-related industries, as well as the positive outlook for growth in asset
management and the limited capital requirements when compared to other sectors, such as
banking.
The outlook remains positive but slower growth is ahead
The pressure on asset manager margins may lead to a further contraction in the number of
major participants in the industry over the medium term. The Canadian fund industry has
matured and is expected to move through a period of relative stability and consolidation,
rather than a period of expansion. However, on the assumption that the headwinds of change
are addressed through the introduction of innovative strategies and a willingness to invest in
technology and digital solutions at all stages, the outlook for most fund manufacturers and
fund distributors remains positive.
The medium-term future of the Canadian investment funds industry is partly reliant on the
ability of participants to anticipate and respond to the financial needs and expectations of
various age segments, particularly baby-boomers. In the medium-term, notwithstanding the
limited flows that are expected, the sheer size of the baby-boomer cohort and the wealth that
they currently control will offset any negative impact on the investment fund industry
brought about by the indebtedness and new attitudes to savings and investments from
younger generations.
The outcome, at least over the medium term, will be further, if muted, growth for the
Canadian investment funds industry as the growth of exchange-traded funds continue to
outpace mutual funds and a companion move from across-the-desk advice to do-it-
yourself electronic platforms and artificial intelligence takes place.
9Role of Investment Funds
At the end of 2007, total assets of the 14.7 million households in Canada stood at $8.2 trillion,
of which $2.5 trillion was in the form of financial wealth, a category that excludes assets held
in government defined benefit (DB) pension plans, private companies, real estate and life
insurance. Within financial wealth, fixed income investment funds represented 4.2% and
balanced and equity funds 18.9%. Ten years later, at the end of 2017, the financial wealth held
by 15.9 million Canadian households had risen, despite a severe economic recession at the
early part of the decade, to $4.5 trillion.
Concerns about wealth preservation, coupled with a decline in long-term interest rates,
resulted in fixed income investment-fund holdings, in absolute terms, quadrupling to $425
billion, representing a 9.5% share of financial wealth. Equity and balanced investment funds
added $521 billion in holdings over the period, totalling $1.1 trillion and representing 25.6% of
financial wealth at the end of 2017.
Figure 1: Canadian Financial Wealth and Number of Households
2007 2017
Canadian $2.5 $4.5
financial wealth
trillion trillion
Number of 14.7 15.9
households million
million
Average wealth $172 $281
per household
thousand thousand
Ownership of mutual funds
Viewed on a household basis, using the latest available data, investment funds per household
(not only those that invested) at the end of 2007 were $54,495, a total which increased to
$101,350 by the end of 2017 and represented a CAGR of 6.4%. This rate of growth was 1.4%
higher than the rate of growth of total personal wealth over the same period. Put another way,
both new flows and generally positive capital markets contributed to the growth of fund
holdings, although the impact of the markets materially outweighed that of flows.
Data from approximately 8.9 million Canadian households served by members of the Mutual
Fund Dealer Association of Canada6 (MFDA) indicated that, as at year-end 2016, 27% of the
assets administered by MFDA dealers were held by households with assets of less than
$100,000. Those households made up 81% of all households served by MFDA dealers. At the
other end of the scale, MFDA-serviced households with more than $500,000 in assets
accounted for just over 2% of the households, but also held 27% of balances administered by
those dealers.
6
MFDA Client Research Study, 2016.The usage of investment funds by Canadians is often hard to gauge, although recent surveys
provide some guidance. A 2017 survey of investors by the Canadian Securities
Administrators7 indicated that 47% of respondents who had savings set aside for the future
owned at least one mutual fund8 and that 13% of this total sample owned an exchange-traded
fund.
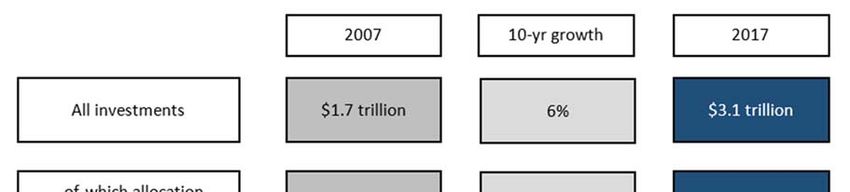
Since 1990, there has been a gradual, but persistent, restructuring of the savings and
investment assets held by Canadian households. Specifically, investors have favoured
market-sensitive instruments over both variable and fixed-rate deposits. In 1990, deposits
represented 68.3% of household financial wealth. By 2000, the share held by deposits had
decreased to 33.3% and, by the end of 2017 and despite a lingering uncertainty created by the
market correction of a decade ago, the share of financial wealth held in deposits had fallen to
30.2%. Although this level of ownership of deposits may seem low, the comparable share in
the U.S. is 9.4%9.
Historical data suggests that, over this 30-year period, only downturns in equity valuations
or periods of high volatility have persuaded Canadian investors to rapidly and briefly lower
their overall risk profile by allocating more assets to deposits and to various fixed income
instruments.
Figure 1.2: Share of Financial Wealth Held in Deposits and Investment Funds
7
2017 CSA Investor Index, November 23, 2017.
8
It is worth noting that the IFIC website indicates that 33% of Canadians owned mutual funds as of 2017.
9
Strategic Insight U.S. Asset Management Industry Market Sizing: 2018-2023
11The move toward market-sensitive investments
In the past decade, however, substantial flows into investment funds have been influenced
not only by positive equity markets, but also by a prolonged period of historically low interest
rates. Such modest returns encouraged investors to move up the risk-reward scale by
increasing their exposure to market-sensitive investments in search of higher rates of return.
Interest rates offered by deposits, which were at historically low levels until 2017, were further
reduced by inflation: The inflation-adjusted nominal five-year GIC rate peaked in 2008 at
1.7% and subsequently reached an all-time low in 2010 and 2011 at -0.4%.
That said, rate initiatives taken by the Bank of Canada and other central banks over the 15-
month period ended October 2018 to place the brakes on the expansion of credit and to
contain inflation within policy guidelines may herald a modest slowing of inflows into all
types of financial assets as households prioritize debt reduction.
Investment-fund flows
A combination of the amount of liquidity on personal balance sheets and the changing risk
appetites of Canadians have fuelled expansion of the investment-funds industry in Canada
since 2010. Growth in investment funds has outpaced other medium- and long-term
financial products, such as guaranteed investment certificates (GICs), market-linked notes
(MLNs) and directly-held equities and bonds.
Over the past two decades, and despite the events of 2008 and 2009, long-term investment-
fund growth has totalled $1.3 trillion. This growth has been driven by both strong net flows
and positive market effect. Between 1997 and 2007, net flows accounted for 39% of
investment funds growth, a share which declined to 27% between 2007 and 2017. Market
effect, however, proved to have a much greater impact on investment funds’ growth, as
global capital markets recovered from the financial crisis and recorded only three years of
negative returns between 2007 and 201710.
Figure 1.3: Investment funds growth: Net flows versus market effect
Assets in billions of dollars
Market effect Net flows
$815
27%
$482
46%
73%
54%
1997‐2007 2007‐2017
10
MSCI WORLD INDEX (USD).Registered savings vehicles
A portion of the flows into investment funds has been driven by contributions to registered
retirement savings plans (RRSP). In each of the past 10 years, investment funds have
represented over 50% of total assets held in RRSP accounts: At the end of 2017, 59% of RRSP
assets were in the form of investment-fund units11. Using CRA tax filer data, gross
contributions to RRSPs have steadily increased, rising from $31.1 billion in 2006 to $39.9
billion in 2016. It is worth noting that, over this 10-year span and despite the increase in the
amounts contributed to RRSP accounts, approximately 270,000 fewer Canadians have been
contributing to these retirement savings vehicles. Reasons for this decline in popularity likely
include the advent of the tax-free savings account (TFSA) and the number of baby-boomers
reaching age 71.
In 2009, in a move to boost the national savings rate through tax relief to savers, the Canadian
government introduced a new savings option through the launch of TFSA. While both the
use and the purpose of the TFSA in the retirement savings matrix have been the subject of
debate, the TFSA has been widely accepted as an all-purpose savings vehicle and one which
has been a contributing factor to the lower levels of participation in RRSPs.
Based on Investor Economics’ analysis, assets in TFSAs rose from $40.7 billion in 2010, the
year following its introduction, to $300 billion in mid-2018. While initial inflows were due to
the account’s general-use nature, which allowed it to attract a portion of existing savings held
in taxable accounts, TFSAs, notwithstanding limits on new contributions, have continued to
benefit from consistently higher contributions than withdrawals. At the outset, investment
funds represented 6% of total TFSA account balances. However, allocations to investment
funds have risen in line with the improvement in equity markets and, by mid-2018,
allocations to investment funds accounted for 37% of total TFSA assets.
The individualization of retirement assets and savings
The growth in the relative importance of investment funds to Canadians is not the result of
a single driver, such as the juxtaposition of interest rates and equity values, or the
introduction of new savings vehicles, but is rather the confluence of a number of factors,
including the ability and propensity of Canadians to save and the emergence of retirement
risk.
Retirement risk is the risk of individuals failing to accumulate sufficient assets to adequately
fund their retirements, either in terms of the lengthening years of retirement12 or in amounts
sufficient to cope with inflation or other financial pressures. An increasing number of
Canadian households are facing retirement risk due to inadequate levels of savings, as well
as decisions taken by their employers to download retirement risk from corporate balance
sheets to individual employees. A study produced by Broadbent Institute13 found that nearly
half of Canadian couples between 55 and 64 did not have an employer pension between
them, with the majority of these families (more than 80%) having inadequate retirement
savings. While this study highlights concern for retirement preparedness among Canadians,
other studies have shown a more optimistic view, particularly when accounting for “Pillar
Four” assets. These assets refer to funding and income sources, such as non-registered
savings and investments, ownership in privately owned businesses, insurance products, real
11
Investor Economics’ Household Balance Sheet Report — Canada 2017.
12
Retirement is lengthening due to the general age of retirement remaining at age 65, even as the average lifespan of
Canadians has exceeded 80 years of age.
13
http://www.broadbentinstitute.ca/canadians_approaching_retirement_with_totally_inadequate_savings_seniors_poverty_rate
s_increasing_new_study
13estate equity and potential inheritances, and which may individually or collectively improve
the retirement readiness of Canadians14.
Expansion of the Canada Pension Plan (CPP)
In June 2016, the federal government announced an agreement to expand the CPP in order
to increase retirement benefits for Canadians who contribute to the plan. While annual
contributions are expected to increase modestly over a seven-year period starting in 2019,
the enhancement is forecast by the federal government to reduce the share of households at
risk of not having adequate retirement savings from 24% to 18%.15.
The seven-year implementation period and the extent of the contribution increase are not
expected to have a major impact on the investment industry, despite the fact that CPP
contribution rate increases have, historically, crowded out some personal retirement saving
flows. While the expanded CPP will improve the income replacement level from 25% to 33%
of eligible earnings, the majority of pension responsibility will continue to remain with the
individual.
Passing the retirement risk
The catalyst for the movement away from defined benefit (DB) plans has been the negative
impact of rising pension liabilities and pension-fund shortfalls on corporate balance sheets.
DB pension plans, a relatively standard employee benefit until the late 1990s which place a
burden of responsibility on employers, were severely harmed by the financial crisis of 2008.
Companies suffered significant funding deficits that were brought on by poor or negative
market returns, as well as a lack of cash resources to fund the deficits. As a result, many
employers stopped offering DB plans to new employees. While DB plans accounted for two
thirds of all registered pension plan assets in 201616, their share of total pension assets has
steadily declined in recent years as most new employees (excluding those in the public
sector) are not offered membership. From 2002 to 2012, the proportion of private-sector
workers covered by DB plans fell from 73% to 48% and, subsequently, to 29% in 201617.
Figure 1.4: Canadian retirement risk
Assets in billions of dollars as at December 2017
$1,393
RRSPs and TFSAs
$1,782 $3,579
Total retirement
Employer (DB/DC) risk
$405
Government
(CPP/QPP)
14
C.D. Howe Institute, The Bigger Picture: How the Fourth Pillar Impacts Retirement Preparedness, September 2016.
15
Government of Canada, Department of Finance, Backgrounder: Canada Pension Plan (CPP) Enhancement.
16
Statistics Canada: Table 11-10-0106-01 (formerly CANSIM 280-0016).
17
Ibid.Preparedness for retirement
As individual households assume greater responsibility for their retirements, irrespective of
their ability to do so, they are required to make frequent investment decisions and to exercise
an increased level of control over their retirement assets. This is in contrast to the member’s
position in a DB plan, where the employer assumes the funding and market risks and
maintains control over the plan assets. In a defined contribution (DC) pension plan,
employees and employers share in the investment decision-making, as employers curate
the investment shelf from which employees select the investment funds; however, the risk
of failing to accumulate assets sufficient for retirement is fully borne by the employee.
The impact of group savings
Due to the declining availability of private sector DB pension plans and the resultant
privatization of retirement savings, there has been a notable shift toward the use of
investment funds within pension plans and group retirement plans. Based on Strategic
Insight’s group retirement savings research, investment funds (including special group
pools) accounted for over 80% of surveyed capital accumulation plan (CAP)18 assets at the end
of 201719.
Within the CAP market, individually administered accounts and member participation in the
investment selection process have led to greater use of unitized products within plan
investment menus. At the same time, evolving economic and capital market environments
have resulted in revised product suitability views for long-term investment horizons. This
has ultimately encouraged greater usage of target-date funds and balanced funds as default
investment options, as opposed to shorter-term investments such as money market and
deposits instruments.
Despite the greater adoption of more suitable long-term investment options, individual plan
participants and investors continue to bear the risk of failing to achieve financial security.
With an upward-trending average life expectancy and a static retirement age of 65, the risk
of outliving one’s assets in retirement has been magnified in recent years. Between 1996 and
2016, the average life expectancy at age 65 increased by approximately 2.6 years in Canada20.
In summary, as Canada’s aging population has been required to supplement conventional
pension income with personal savings, individual investors have turned toward market-
sensitive investments to achieve long-term financial goals. A greater willingness and need
to assume a degree of volatility in their portfolios has helped shape the demand for unitized
access to the capital markets. As a result, investment funds have grown to become a primary
investment option used within the group retirement savings landscape.
18
As per CAPSA’s Guideline No. 3, CAPs include defined contribution (DC) plans, group registered retirement savings plans
(GRRSPs), group registered education savings plans (GRESPs), and deferred profit sharing plans (DPSP).
19
Strategic Insight’s 2018 Group Retirement Savings and Pensions Report—Canada.
20
Statistics Canada Tables: 13-10-0063-01 and 13-10-0371-01.
15Investment Fund Distribution Channels
In Canada, investment funds are distributed through the seven distinct channels responsible
for the distribution of financial wealth. These channels can be characterized by three primary
factors: firstly, the degree to which advice can be provided and the manner in which that
advice is offered; secondly, the primary target client segments in terms of financial wealth
and how narrow the channels’ focus is by segment; and thirdly, the relative importance of
investment funds within the range of products offered within the specific channels.
Figure 2.1: Distribution channels
Dealers, MFDA with some IIROC, focus on mutual fund funds,
Financial financial planning and operating primarily independent
advisor advisor models. Also includes insurance-only licensed
distributors/advisors.
Full-service investment dealers, IIROC registrants with broad
Full-service shelf of securities, deposits and other investments. Generally
brokerage open architecture, balanced mix of fee-based and transaction
based models.
Dedicated advisor/mass affluent client sales and service
Branch advice models operating out of deposit taker branches, focus on
financial planning using both MFDA and IIROC registrants
Branch banking and savings activity largely focused on
Branch direct deposits, but includes MFDA registrants responsible for on-
demand mutual fund sales (books not assigned).
Discretionary management and/or private banking services
Private wealth and/or trust services through bank-owned or numerous
management independent firms. Regulated by provincial securities
commissions or OSFI (banking and trust).
Includes fund managers that sell directly to investors and
Direct sellers
robo-advisors. Regulated through MFDA and CSA.
Order execution only, IIROC registrants focused on do-it-
Online/discount
yourself investors and active traders. Limited guidance under
brokerage
specific exemptive relief.
The wide variance in the size and scope of channels
The size of the various channels, in terms of mutual fund investors and assets, varies
considerably—from the relatively small proportion of mutual fund investors and assets using
self-directed platforms (online/discount brokerage or direct sellers), to the millions of mutual
fund investors who access investment products through independent advisors at dealers
overseen by the MFDA in the financial advisor (FA) channel and through the branch networks
of deposit-takers. Prior to the rise of the deposit takers’ mutual fund dealer and asset
management arms, the FA channel was the channel primarily associated with the
distribution of Canadian mutual funds and the channel remains a mutual fund-centric
distribution channel. While the other intermediated advice channel—full-service brokerage(FSB)—holds a material share of the total mutual fund assets in Canada, mutual funds remain
less than a third of the total assets held on the deep product shelves of that channel.
The distinction between the two branch-based channels housed within deposit-taking
institutions—branch direct (BD) and branch advice (BA)—is primarily based on the client
segment on which each is focused and the dedicated nature of the advisor/client
relationship. The MFDA registrants in the BD channel generally provide clients with access
to mutual funds on a walk-in basis within a well-defined suitability framework. The customer
service representatives in the BD channel also provide client discovery resulting in referrals
to branch partners, notably the BA advisors, when a more comprehensive financial planning
or investment need is uncovered. The BA advisors are dedicated to providing financial
planning and investment products through assigned client relationships and the service
breadth of these relationships varies by bank.
Figure 2.2: Financial wealth distribution landscape at the end of 2017
Total assets in each channel
$87
Direct Seller,
$4.5
TRILLION
$454
Private Wealth
Robo‐advice
$440
Online Brokerage
$1,230
Full‐service Brokerage
$551
$1,030 $485 Financial Advisor
Branch Direct Branch Advice
Branch Delivery
Over the past 10 years, the strongest relative growth came in channels that were in an
emerging growth phase and focused on a self-directed, or digital online advice-driven
investment approach—specifically online/discount brokerage and online wealth or robo;
and those where target client segments were more narrowly focused and up-market than in
competing channels—for example, the very high-end focused private wealth management
and the mass affluent focused service offer of branch advice. The former benefitted from the
strong growth in financial wealth arising from the affluent segment (>$1 million) and the latter
benefitted from the mass affluent branch clients being directed to them from branch
partners.
The more mature and broadly focused intermediated advice channels, FSB and FA, have
generally expanded at rates below the rate of growth of personal wealth in Canada. In the
case of the former, maturity of the channel has created impressive scale at the higher end of
the mass affluent and affluent client segments. As a result, beyond market sensitive asset
growth, the sheer scale of the channel has tended to impede growth rates relative to
17competing channels. The mature FA channel remains heavily entrenched in both the mass market and mass affluent segments. The channel’s heavy reliance on mutual funds, together with significant regulatory changes facing all dealers, has weighed on advisor capacity and challenged relative growth. The impact of branch sales forces Despite very different product approaches, compensation models and targeted client segments, the relatively immature BA channel and the long-established intermediated advice channels, FSB and FA, held very similar levels of total mutual fund assets at the end of 2017—all in the $320 to $350 billion range. As alluded to earlier, where these similar absolute dollar levels depart from one another is in the relative role mutual funds play and their profile in each of the three distribution channels. Among the three channels, the FA channel relies the heaviest on mutual funds as they make up about 90% of the assets held by dealers in the channel. The dealers’ shelves are generally open and reflect a broad mix of manufacturers. Over its long tenure, the channel has remained firmly linked to the mass market client segment, in terms of numbers of client households, but has moved up market with its core asset holding and financial planning value proposition anchored in the mass affluent segment. Figure 2.3: Mutual fund assets held in each channel Assets in billions of dollars at the end of 2017 The BA channel, while highly reliant on mutual funds as its primary driver of long-term investment planning, also holds a large balance of both fixed-term and demand products within the assigned relationships between advisors and clients. The share of funds has been increasing, and at the end of 2017 sat close to two-thirds of the assigned books of BA advisors. The mutual fund profile differs from FA, with a relatively narrow shelf focused primarily on proprietary funds and fund wraps. The BA offer evolved to service the mass affluent client segment within deposit-takers—the focus on the segment is intense and the entry level, generally set at $100,000 in investible wealth, unencumbers the channel and its advisors from a mass market capacity drain. This, plus a well-structured product offer and a strong referral framework with branch partners, has elevated the growth rates in the channel. The big step-out from the three channels is the very large and mature FSB channel. While of critical importance in the distribution of mutual funds, funds play a lesser role in the
channel’s product shelf and practice management of advisors than FA and BA. At the end of
2017, mutual funds made-up about 26% of total assets held in the channel—including those
held in any of the channel’s fee-based platforms. Mutual funds are integral to the channel
although they compete with a significantly greater variety and volume of securities and other
investment and deposit products, than they do in FA or BA. Client-focused reforms around
know-your-product may alter the competitive shelf dynamic in the channel creating both
opportunities for mutual funds as well as challenges. Unlike the BA channel, the mutual fund
profile of the FSB firms attached to deposit-takers has remained largely focused on third-
party mutual funds, with affiliated mutual funds (not ETFs) making up about 17% of total
mutual fund assets.

Future growth being redirected, new investors exercising choice
Much of the overall asset growth recorded in the FA and FSB channels arose from market
growth, rather than material flows attributed to new investors or new money from existing
investors. This in part relates to the scale, as well as capacity issues, mentioned earlier. A
growing number of Canadian investors using these channels have entered their retirement
years and, as such, inflows have been offset by an increasing level of both voluntary and
mandated withdrawals from registered accounts.

Competition for new clients has become intense for a variety of reason—not the least of
which has been a desire for the FSB channel to move decidedly upmarket, constraining the
pipeline for the clients of tomorrow. This is occurring to a lesser extent in the FA channel, but
that channel has also come under intense competition from the BA channel where the
deposit takers are intercepting high-end mass market and mass affluent clients that once
contributed to the growth of the independents in the FA channel. The BA offers have also
expanded further upmarket, significantly slowing down the referral engine to the FSB firms—
though FSB remains an option for BA clients who have reached the ceiling in their respective
mass affluent offers.

Competition is emerging from beyond the face-to-face confines of the three channels
discussed above. The osmosis of online and digital consumption into the investment
management world has been well documented and covered extensively by Strategic
Insight21. This started with the rapid expansion of the online discount brokerage (ODB)
channel over the past decade and a half. The growth in ODB reflected a rise in self-directed
investment behaviour, in many cases by investor choice, but also, in part, from an economic
limitation of face-to-face options among mass market investors. It was in this environment
that online wealth was launched—for those not-so-do-it-yourself, but still outside the sphere
of face-to-face advice, either by choice or by exclusion.

These channels tend to be viewed as the new entry points for young or new investors and
savers, but the acquisition of clients has been difficult despite triple digit asset growth rates
from a near zero base. The digital platforms and their sponsors are moving towards hybrid
applications of both digital and face-to face advice that involve established dealer firms in
both the FA and FSB channels. For a face-to-face advice firm, these approaches will ideally
provide an economically feasible capability to greenhouse early stage or younger clients until
their situation indicates more complex wealth planning needs and advice.

21
     Strategic Insight Quarterly Fintech Report, 2017, 2018

                                                                                               19
Private clients The relatively strong growth rate recorded by the private wealth channel, which is focused almost exclusively on households with over $1 million in investible assets, derives primarily from the private investment counsel (PIC) business. At the end of 2017 pools or unitized investment products reached 58% of total PIC assets up from 54% three years earlier. The balance of assets held in segregated accounts, those which are primarily made up of individual securities, were once the staple offering of PIC firms. These account structures have been relegated to minority status and are frequently reserved for accounts with balances in excess of $3 million. Currently two thirds of the pools used in the PIC channel are prospectus-issued mutual funds which have been primarily developed exclusively for the PIC business. The adoption of these products in the channel, along with the balance of pools issued pursuant to an offering memorandum, could serve as an indication that there is general appreciation of the accepted benefits of unitized pooled investments in the HNW client context. The influence of the move to fee-based accounts Across the three key distribution channels for mutual funds, the FSB channel remains the primary evidentiary source of the impact that the move to fee-based services will have on advisors and fund managers. At the end of 2012, mutual funds and ETFs represented 26% of channel assets, with 23% and 3%, respectively. By December 2017, the combined share had increased to 32%, with mutual funds at 26% and ETFs at 6%. Of critical importance to the mutual fund industry is the extent to which the rapid adoption of fee-based practice models will involve mutual funds. Looking at non-discretionary, fee- based accounts, the growing importance of investment funds becomes readily apparent. In these accounts, the share of assets held by investment funds moved from 27% (22% mutual fund, 5% ETFs) at the end of 2012 to 38% (31% mutual funds, 7% ETFs) at the end of 2017. In absolute terms, the increase in total mutual fund and ETF holdings represented approximately $63 billion, or 44%, of the total increase in non-discretionary fee-based assets. This change in asset mix took place at a time when non-discretionary fee-based brokerage assets had grown at a three-year CAGR of 15.4%, compared to a CAGR for channel assets overall at 6.9%. Much of the mutual fund growth in fee-based programs over the past five years has come from the transition of existing mutual fund assets held outside fee-based programs into fee- based programs. ETFs, on the other hand, have grown gradually, primarily through net new flows of ETFs to both the channel and to fee-based programs. Unlike mutual funds, a larger portion of ETFs have always been held in fee-based than in transaction-based accounts. The fee-based practice adoption has spread to both the FA channel and the BA channel where F-series mutual funds remain the dominant product choice. Growth of fee-based in the FA channel has occurred on both the MFDA and IIROC platforms offered by dealers in the channel, although the growth has been much faster on the IIROC side of dual-platform dealers. While only two BA dealers currently offer a fee-based account for F-series mutual funds, the growth over a short period has been dramatic. In less than two years, assets reached just below $10 billion at the end of 2017 and more than doubled over the course of 2018. In comparison, the FA channel held approximately $35 billion. The outlook to 2026 Projections for channel development up to 2026 paint a similar picture of modest growth for intermediated advice, continued strong growth in the self-directed and online advice
investing platforms and robust growth in the BA channel and PIC business—related to their
specific segment focus and the growth outlook for those client segments and effectiveness
of acquiring those clients via established referral frameworks.
In absolute terms, the FSB channel is projected to retain its position as the largest channel in
asset terms, adding approximately $770 billion over the period to reach approximately $2
trillion by 2026. The projected growth in the FA channel of $196 billion is influenced by
modest gains in market valuations while being challenged by an aging advisor sales force,
regulatory change heavily focused on its primary product and competition in its core client
segment. The FA channel’s growth is projected to be almost $300 billion less than that
projected for its major competitor, the BA channel.

The shift in fortunes of the various channels will be driven by the ability of participants to
react to demands for value and convenience by the mass market and mass affluent
segments, as well as the development and implementation of strategies that focus on the
delivery of integrated wealth solutions to households in the upscale ($500,000-$1 million in
investible assets) and affluent ($1 million+ in investible assets) segments. With regulatory
change facing all dealers, particularly those that are mutual fund-centric, the challenge for
the FA channel is to remain flexible and to adapt to forces of change—whether competitive,
economic or regulatory. It is likely the large array of dealers in the channel will experience
further consolidation, whether by mergers or simply selective recruitment of advisors. This
will result in a thinned-out field with several large, strong players capturing much of the
growth and the assets in motion from advisor retirement and exit. Opportunities for growth
will also exist for boutique firms focused on a strong local market or regional presence and
those firms that can create a specialized suite of wealth services for a particular client
segment (e.g. professional or ethnic markets).

Figure 2.4: Outlook by distribution channel, 2017 to 2026
Assets in billions of dollars at the end of 2026

                                                                                              21
You can also read