Capital Markets Day
    2 May 2018
←
→
Page content transcription
If your browser does not render page correctly, please read the page content below

Capital Markets Day
2 May 2018
Introduction
Ian Filby - CEO

                  1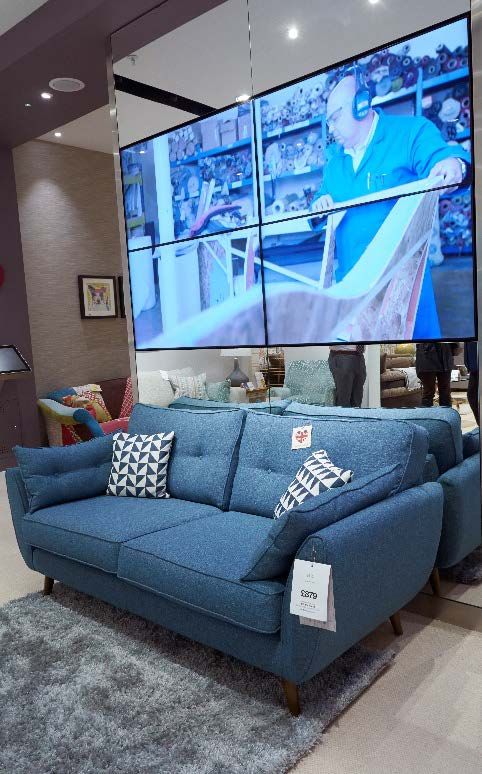
Our Journey

                                                          … to DFS Group as the
          Growing from                                 Leading Sofa and Living Room
   DFS as Mass-Market Leader …                             Furniture Specialists

          By Leveraging our Efficient Operating Platform which :

              The right brand and proposition for all major customer segments

              Best value at every price point

              Outstanding customer experience

    Using the strength of the DFS platform we will grow our retail brands to drive
        incremental profit before tax and continued strong cash generation

                                                                                      2
The Management Team Here Today

     Ian Filby       Nicola Bancroft     Nick Collard      Scott Fishburn
       CEO                 CFO         Chief Commercial     Chief People
                                             Officer          Officer

    Gill Stewart       Tim Stacey         Toni Wood         Mike Schmidt
CEO, Sofa Workshop   Chief Operating   Chief Marketing    Corporate Finance
                         Officer            Officer           Director
                                                                              3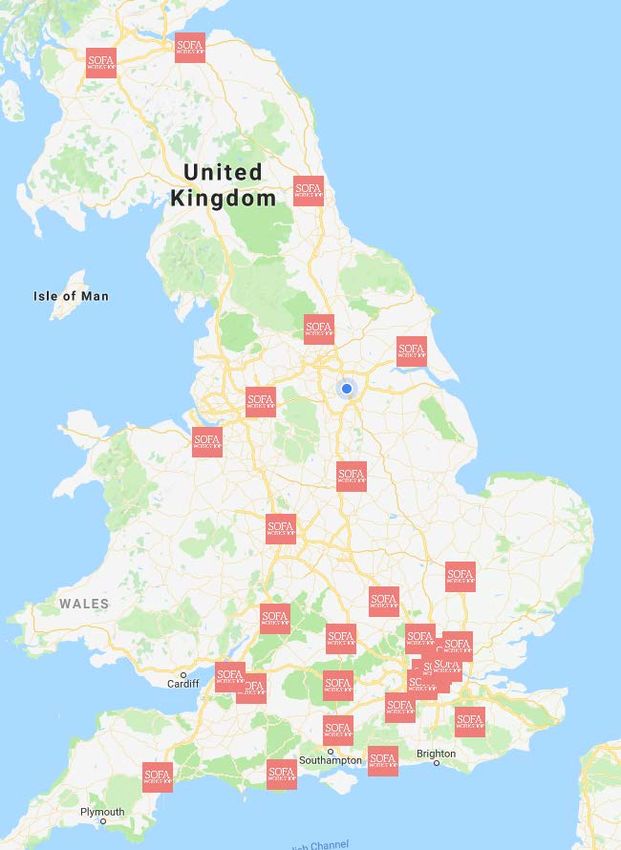
Our Agenda

Topic                                   Presenter             Timing
        Introduction & Context          Ian Filby             10:45 – 11:00

        Marketing Strategy              Toni Wood             11:00 – 11:15

        Commercial Strategy             Nick Collard          11:15 – 11:30

        Sofa Workshop                   Gill Stewart          11:30 – 11:40

        Retail Strategy                 Tim Stacey            11:40 – 11:55

Tea Break                                -                    11:55 – 12:15

        People Strategy                 Scott Fishburn        12:15 – 12:30

        Sofology Opportunity            Mike Schmidt          12:30 – 12:45

        Financial Model                 Nicola Bancroft       12:45 – 13:00

        Closing Remarks & Q&A           Ian Filby             13:00 – 13:15

Lunch + Informal Management Q&A                               13:15 – 13:45

        Croydon DFS, Dwell & Sofology   Regional Management   13:45 – 15:45

Arrive at East Croydon Station           -                    16:00

                                                                              4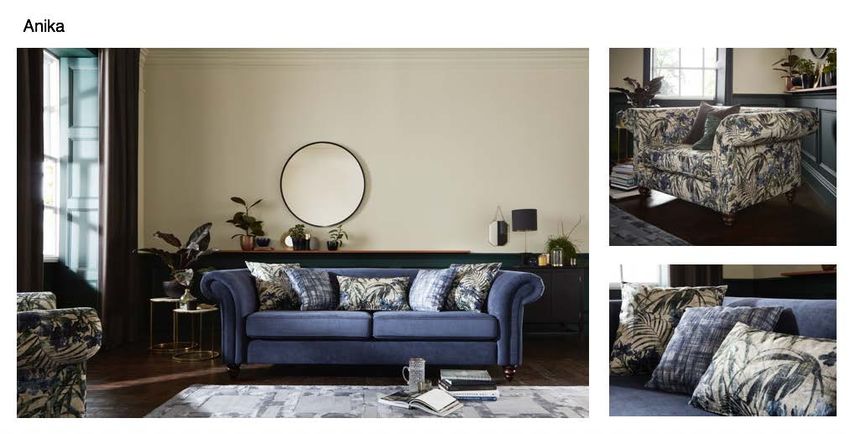
Approach to Questions Today

                   ? ? ? ? ?

                               5
Our Position Today
  UK UPHOLSTERY SHARE – 2016A (%)                                    LATEST REPORTED / ESTIMATED UK FURNITURE
                                                                     SALES FOR ONLINE PLAYERS Estimated proportion
         32.1
                                                                                                                    of UK furniture sales
          5.5                                                                                                             that are
                                                                                                                      sofas/upholstery
                                                                    DFS Group
                                                                                                                             Very high
                                                                    Online Sales
                                                                                   (2)
                                                                         Wayfair                                             Likely low
         26.6
                                                                                   (2)
                                                                     Made.com                                                Likely low

                 10.1                                                              (1)
                                                                                                                              Medium
                          6.3                                          Loaf.com
                                  4.8     4.7    4.2   2.5   2.0
                                                                                   (1)
                                                                       Sofa.com                                              Very high

                                                                        ScS     (3)
                                                                                                                             Very high
                                                                    Online Sales

Source: GlobalData (formerly known as Verdict)                     Source: (1) Companies House filings, (2) extrapolated data from GlobalData
                                                                   market shares and (3) Annual report disclosure

         We are the clear leader in the upholstery/living room segment of the furniture
     market. Our leadership is as equally strong for upholstery transactions completed online

                                                                                                                                                6
Long-Term Progress in all Environments

                                                                                                                                                                                        Including Sofology
                                                                                                                                                                                                    c. 32%
                                                                                                                     3.92
                                                                                                            3.82
                                                                                         3.65 3.72                            3.66
                                                                                3.52
                                                                      3.38                                                                                                                               3.30 3.26
                                                                                                                                        3.20                                                    3.20
                                                                                                                                                 3.04                                 3.05
                                                                                                                                                          2.89 2.88 2.94
                                          2.79 2.86                                                                                                                                                     26.6%
                                                                                                                                                24.0%
                                 2.41
                        2.23
       1.95 2.00                                                                                                                                                                     26.4%
1.73                                                                                                                18.0%                                                  25.5%25.7%
                                                                     16.6%

                                                                                                                     18%
                                                    15%
 9%

 9%
1994A 1995A 1996A 1997A 1998A 1999A 2000A 2001A 2002A 2003A 2004A 2005A 2006A 2007A 2008A 2009A 2010A 2011A 2012A 2013A 2014A 2015A 2016A 2017E

                                         UK Upholstery Segment Size (£bn)                                                            DFS Upholstery Segment Share (%)

                             We have maintained a long and consistent track record of above
                                             upholstery segment growth
        Source: Upholstery segment size and DFS segment share data for 1994-2000 sourced from DFS Final Results presentation 2000. DFS Upholstery segment share data for 2002-2007 has been derived by DFS
                management based on Verdict’s estimated segment shares for DFS in Furniture and the relative size of the Upholstery segment within the overall Furniture segment, with both segment sizes sourced
                from Verdict estimates. DFS Upholstery segment share data for 2008-2016E sourced from Verdict, delivery charge inclusive. Upholstery segment size data for 2002-2017E sourced from GlocalData
                (formerly named as Verdict)
                                                                                                                                                                                                                    7
The Three “S”s That Make us Different

                                                  Sales per store (including Dwell, SW, Sofology) over
                                    Sales         50% higher than next nearest competitor
                                  Intensity
                                                  Over 700,000 two-man deliveries per year
             Scale Intensity
                                                  Scale buying benefits in finished goods, advertising
                                  Buying
                                                  and insurance/interest-free-credit

                                  Assisted        Category where personal engagement is key
                                   Selling        Proven ability to recruit, train & retain “the best”
               Specialism
                                Living Room       Exclusive products throughout our showrooms
                                  Expertise       The furniture partner of choice for lifestyle brands

                                  Flexible
                                                  Cost base adjusts in response to challenging markets
                                 Cost Base
              Shareholder
                Returns
                                Low Capital       Negative working capital, and limited store base
                                 Employed

    We have hard-to-match competitive advantages that are sustainable in the long-term

                                                                                                         8
Levers of Growth Remain the Right Long-Term Choice

                                     5                                    Growth levers
                                            International
                                                                     drive 2-3% sales growth
                                                                      in addition to market
                            4     Retail space & cost
                                      efficiency
                                                                        Financial payback
                      3           UK                                      on incremental
                                stores                                 investment is short
             2     Broadening
                   our appeal                                           These investments
                                                                      also typically drive an
   1    Omnichannel                                                    improved customer
          growth                                                            experience

   Despite the challenging market, we have continued to invest in our stated growth levers

                                                                                                9
Key Themes for the Day
1. WHY WE ARE BROADENING OUR APPEAL 2. STAYING AHEAD IN ONLINE
3. THE SOFOLOGY OPPORTUNITY 4. MATERIAL FINANCIAL UPSIDE AVAILABLE
£££
We are pleased to have this opportunity to outline the opportunity we see ahead
10Marketing Strategy
Toni Wood – Chief Marketing Officer
11Our DFS Brand Appeals Strongly Across the Market
DFS LEADS WITH ALL CUSTOMER GROUPS… …HOWEVER A SIGNIFICANT OPPORTUNITY
EXISTS WITH CONSUMERS CLOSED TO DFS
Affluence
#1 #1 32% Aware of DFS but
would not consider
£3.3bn
68
%
#1 #1
Life-stage Upholstery
Consumers
While DFS leads with all customer groups, a proportion of customers have always claimed
they are closed to the DFS brand. i.e. they would not consider a purchase from us
Source: Independent survey of upholstery purchasers conducted on behalf of DFS
12Evolving With the Changing Market Whilst Retaining our Core Customers
MARKET VOLUME BY SEGMENT
21% 21% 20% 19% 18%
15% 15%
16% 16% 16%
Bargain Hunters
26% Quicker Delivery
22% 23% 25% 29%
Convenience Shoppers
Value Seekers
15% 13% 11%
13% 12% Quality Seekers
26% 27% 26% 26% 30%
2013 2014 2015 2016 2017
Our shift in marketing tone has matched the overall market shift in consumer behaviour
to focus more on quality and convenience
Source : Independent survey conducted on behalf of DFS
13Changing Consideration and Call to Action With Ever Stronger Advertising
DFS BRAND & PROMOTIONAL DFS BRAND TRACKING RESULTS
Team GB 2016/17
2017/18
2015/16 2016/17
YTD
Brand Awareness 93% 94% 93%
GXD 2016/17 Brand Consideration 29% 34% 36%
Brand Acceptability 57% 63% 65%
Brand Love 25% 29% 30%
Winter Sale 2017/18
Value 39% 40% 44%
Call to Action 56% 58% 59%
Our messaging has evolved to tell our hidden truths while
we have retained 80% of our advertising having a pricing/promotional message
Source : DFS Media Plan / MonkeySee Brand Tracking
14Our Group Brands are Complementary and Enable Even Broader Appeal
National Average income families Above average income families with older children /
with young children empty nesters. Typically aged 40+, working in
Typically aged 25-45 working in an office executive and managerial positions.
Females
Affluent families with teenage children High income families with older children who
Typically aged 35 – 65 working in may have left home
managerial role Typically aged 45+, working in a professional
environment
Our Group brands are positioned to appeal differently to DFS and allow us
to target groups of customers that would otherwise remain closed to DFS
15Shifting Marketing Investment to reflect our Customers’ Omnichannel Journey
18% 21% 23%
25% 20% 18%
57% 59% 59%
2015/16 2016/17 2017/18
TV Press Digital
Through econometric modelling we manage our channel spend to maximise our return on
investment. Digital spend has grown over time, however remains significantly smaller than TV
Source : DFS Media Investment Split L3Y
16We are Accelerating our Digital Marketing with Customer Data at the Core
Signals & Segments Driven Marketing
1 2 3
Lead Capture & conversion Beta Partner with Data Innovation Partner with Tech
programme Specialists leaders
While TV spend remains key at present, we are working to develop digital marketing
approaches that are effective for the differentiated upholstery purchasing customer journey
17Questions
? ? ? ? ?
18Commercial Strategy
Nick Collard – Chief Commercial Officer
19DFS Commercial Process
Group Sourcing &
Merchandising DFS Manufacturing
Design
Product briefs
Supplier selection Supplier Partners
Category Insights
Supplier terms
Competitor analysis
FREIGHT
COGs programme
Price & Promotions
management Macro trends
Range management Designer pool
Our commercial process is driven by consumer and market insight
which informs the supplier strategy and make or buy decision making process
20Group Sourcing Map
UK
c. 40% Total Production
7 sites inc. DFS
Southern & Eastern Europe
(Poland & Italy)
c. 35% Total production
5 sites
Far East(China)
25% Total production
2 sites
Our sourcing mix is designed to give an optimum balance of Cost, Quality & Lead time
21Group Design Capability
‘BRIDGE MILLS’ NOTTINGHAM KEY FACTS
Design centre of excellence in Nottingham
6 Designers – across upholstery & fabric
17 within the Development team (Prototypes)
Originally developed to support DFS factory
development
Now working with partner suppliers
Produce approx. 100 ranges per year
Our team of highly-experienced designers works with our internal manufacturing and external
suppliers to rapidly refresh and evolve our range to respond to changing consumer trends
22DFS UK Manufacturing
GEOGRAPHICAL PRESENCE KEY FACTS
DFS Manufacturing Factory ‘Top 3’ UK manufacturer of sofas and other
upholstered furniture
DFS Wood Mill Site
5 sites employing c.950 colleagues across 2 shifts
Northern Experienced long-serving management team
Upholstery
(c.40%)
Experts in components sourcing and product
Lincoln composition
House
(c.40%)
Market leading two-week express lead times
Berkley
Magna Fully integrated with design allowing rapid speed
Heanor (c.20%)
Gate to market (quickest production – 14 days)
Workforce largely on piece rate, allowing
flexibility of production costs
We are one of the largest manufacturers of upholstery in the UK,
operating through five sites located in Nottinghamshire and Yorkshire
23Why is our Vertical Integration Valuable?
Shorter Lead Times Manufacturing to meet customer needs, not to maximise
manufacturing efficiency
Trend Responsiveness Able to rapidly bring new ranges to market to follow key fashion
trends, or respond to retail insights
Cost Insight Greater negotiation power with other finished goods suppliers, given
live insight on costs of key inputs
Differentiated Capability Gives comfort that we have an end to end process control thereby
for ‘Brand Partners’ protecting brand equity
Additional Margin Generates a solid manufacturing margin, with cost savings from no
sales force and deep logistics integration
Vertical integration adds substantive advantages to the DFS proposition,
in addition to creating ‘provenance’ utilised in our customer marketing
24British Standards Institute Accreditation
Well-recognised by consumers as the endorsement for quality
All ranges within DFS have been tested and carry the mark, following
development of the standard for upholstery through a partnership
approach with the BSI
Requires annual audits of all our own factories and third party factories
creating independent pressure that drives standards
The kitemark is a unique differentiator within a product category
where quality can otherwise be hard for consumers to judge
25Joules
40 Joules stores across UK –
2 bays per store – up from
an initial 11 trial stores
Brand values – Colour,
Family, Humour, Quality &
British
Well positioned in the large
and growing premium
lifestyle market
Majority of Joules
customers are female
Our Joules partnership has seen a successful launch, growing rapidly to now
have two ranges on display in 40 stores
26Exclusive Brand Relative Positioning
Traditional
Classic/ Neutral
Style
Modern
Segment Starting out Families Post Family
We have developed our exclusive and partnership brand portfolios
to cover the style and consumer life-stage spectrumQuestions
? ? ? ? ?
28Sofa Workshop
Gill Stewart – CEO, Sofa Workshop
29Sofa Workshop: What We Do
We design and craft the highest quality sofas that are handmade to order in our exclusive British
workshops
Our creative expertise and upholstery knowledge ensure we can co-create your perfect sofa without
overwhelming you with a bewildering catalogue of options
We exist to “craft the ideal sofa you always wanted for your home”
Sofa Workshop: Our Craft, Your Creation
30Sofa Workshop: Our Customer
We overindex in Lavish Lifestyles, Executive Wealth, City Sophisticates and Countryside
Communities. Customers typically travel up to 60 minutes to visit a store
31Sofa Workshop: Our 31 Stores
32Sofa Workshop: Opportunities for Growth
1 - Online Growth 2 - DFS Co Locations 3 - Standalone Stores
Capture fair share of Exploit existing Group Space Build a national store
consumer spend in online to drive Group Sales network while achieving
segment Densities short paybacks
Foundational Pillars
Brand Proposition People
Focusing on our brand characteristics and hidden truths Right people well motivated acting as brand ambassadors
Logistics Technology
Cost and service benefits through new technology and the
Leveraging cost benefits through the DFS Platform group platform
Opportunity for material revenue growth while leveraging
operating cost benefits from group support
33Questions
? ? ? ? ?
34Retail
Tim Stacey – Chief Operating Officer
35Omni-Channel Customer Journey
Our customer journey now commonly starts with digital research –
and continues across multiple channels through to purchase
36Omni-Channel Customer Journey – Inspirational Imagery
37Omni-Channel Customer Journey – In Store Technology
Technology is used to assist the customer journey in-store
38Group Retail Formats – Evolving but Attractive Picture for all Channels
Showrooms View in Showroom, Pure Online
Complete Online
% of DFS Upholstery
Sales Currently
84% 5% 11%
Typical Rate of Market growth
Gross Sales Growth (%) less 1-2%
Double-digit
DFS Contribution
Margin (%) (1) c. 24% c. 40%
(pre promotions / admin costs)
Capitalised Leases: Virtually no direct property costs and limited fixed
Capital Employed (£m) (1)
c. £450m(2) asset investments means negative capital employed
Lease adjusted ROCE
Materially higher
than stores given negative capital employed
While showroom sales still represent the majority of market demand,
online is an important fast-growing, strong margin, high ROCE channel
(1) FY17 data for DFS UK&ROI
(2) Calculated as 8x store operating lease charge
39Group Retail Formats – Showroom Transformation
Our estate is generally well-invested and we are driving sales intensities
through the introduction of group co-located formats in existing retail space
40UK Showroom Network Overview
Number of 109 standard format 34 co-located stores 21 standalone stores
41 standard format
Showrooms 5 small format trials 3 standalone stores 10 co-located stores
10-15k sq.ft. of ground Retail park co- Typically 3k sq.ft. 12k sq.ft. of ground
Typical Locations floor retail space in locations of 4.5k sq.ft. cathedral city floor and 6k sq.ft.
retail park locations alongside DFS high street locations mezz on retail parks
LTM Average £1m
Revenue per £6.3m Adds 15% to individual £0.9m £4.3m
Location (£m) DFS Box Sales
Returns from New TBC, but likely
Sub-21 months Sub-24 months Sub-24 months
Stores to be strong
5-10 further
Further co-locations At least 30 further
standard locations. At least 10 further co-
Further Potential Small store trial locations planned
and city centre stores stores to give
planned nationwide coverage
continues
New store openings, supported by CACI modelling, generate very short paybacks. DFS standard
format stores are approaching full roll-out, but significant opportunity in co-locations and other
new fascia openings remains. DFS small store trial continues
41Supply Chain Transformation – CDC Network Complete
Our network of 19 UK CDCs is now complete driving operational cost
and customer service advantages
42Supply Chain Transformation – new AI Software Supporting Supply Chain
Our bespoke Apollo software created through a development partnership with a
leading AI pioneer is driving our logistics optimisation
43Retail Strategy - Summary
Focus - Omni-channel customer journey
Continued investment in on line channels…
…and in store technology
On line channels – margin accretive and growing double digit
Utilisation of retail space – opportunity – Dwell / Sofa Workshop
Enabled by CDC programme – opening programme now complete
Property deals are more available
For example - Croydon store !
44Questions
? ? ? ? ?
45People Strategy
Scott Fishburn – Chief People Officer
46People Strategy – Linked to our Customer Experience Outcomes
1. Experienced
and skilled
teams
4. Giving something Customer 2. Strong
back in our local Experience Leadership
communities
3. Engaging Place to
Work
471. Experienced and Skilled Teams
Number of
c. 3,800 c. 400 c. 200 c. 1,100
employees
Annual Labour
c.25% c.29% c. 31% c. 52%
Turnover
CONTINUALLY BUILDING CAPABILITY DEVELOPING THE NEXT GENERATION
All sales people experience 6 days of 76 apprentices recruited over the last 3 years
development to build sales and service skills Scheme has won UK employee experience
Sales and administration teams then further awards 3 years running
trained to an externally-accredited level of Have been approved as an Employee Provider
excellence by the UK Skills Council
Investment in learning technology – Provide & certify our own programmes
Developing and retaining a skilled team is critical to our
ongoing improvement in our Customer Experience
482. Strong Leadership
Long Tenured Furniture Long average tenure of our top 30 management team
Retail Experience and New
Longest serving leader is Graham Mould – Operations Director with
Hires With Proven Retail
35 years service
Backgrounds
Nick Smith – Retail Director DFS – previously 25 years at DSG
Four Critical New Hires in Gill Stewart – CEO Sofa Workshop – previously at Carphone Warehouse
the Last Year Karl Thomas – DFS Commercial Director – previously at Boots Opticians
Emma Long – Retail Director Dwell – previously at DSG
All Managers receive 5 days of leadership development
Commitment to Partnership with ‘thought leader’ and renowned author Steve
Ongoing Management Radcliffe to bring the very best expertise
Skills Development
We have a robust development and sign-off pathway for new Retail
and Supply Chain managers
We hire externally, develop internally and retain successfully to ensure we operate with
strong leadership throughout the Group
493. Engaging Place to Work
Over 80% of our employees gave us their views in our annual employee survey. We were
delighted to be externally recognized based on their feedback
504. Giving Something Back in our Local Communities
£1.9m raised in total &
£16m raised
a pledge to raise £1m this year
Sponsoring the DoE awards
and all apprentices put
British Retail Consortium, Better Retail,
through their Gold Award
Better World initiative signee adopting
5 UN Sustainable Development Goals
Giving Something Back builds the engagement of our teams
as proven through our Engagement Survey feedbackCustomer Experience
REWARD IS ALIGNED TO MEASURED CUSTOMER EXPERIENCE ACROSS THE BUSINESS
Post Post Established Post
Purchase Delivery Customer Service
Focuses on: The buying Arranging of delivery and The furniture and end- Arranging of service
experience delivery experience to-end experience and experience
Exec Board and all senior
Teams managers in the business Service
bonused on Salespeople Supply chain team
Managers
Manufacturing & Sales
this survey Management teams
Our aligned approach has driven Established Customer NPS
from 21.9 in FY15 to 37.4 in 1H18Questions
? ? ? ? ?
53Sofology Overview
Mike Schmidt – Corporate Finance Director
54Sofology Overview
STORE NETWORK OVERVIEW KEY FACTS
£160m of annual revenues LTM with a
made-to-order business model
41 stores at present, with six regional CDCs
Large, modern stores typically displaying c. 70
ranges
Design-led product ranging, c. 30% of models
refreshed per annum
Technology-led customer journey
– Customer data capture / basket build in store
– Complete at home functionality
– Omni-channel reward approach
Sofology has grown rapidly to now be the third largest retail brand
for upholstered furniture in the UK (according to GlobalData)
55Differentiated Ranging, Advertising and Store Environment
56Efficiency Opportunity
COST BASE SPLIT – LAST 12 MONTHS
Cost of Sales
40.4 Access for Sofology to DFS preferred suppliers with cost / lead-time benefits
% 51.1
%
Better purchasing terms for interest free credit and product warranties
Longer term opportunity to utilise internal DFS manufacturing across Group
32.1
Variable, Semi-Variable & Discretionary Costs
%
30.9
Review and retendering of all operating costs underway
% Longer term opportunity to share resources in logistics activities
27.5 Partial reinvestment of benefits in customer proposition and marketing
% 18.0
% Brand Contribution
£10m+ PBT opportunity to create value by moving Sofology’s EBITDA margins
(generated on a current LTM £160m of revenues) to at least typical industry levels of 6-8%
57National Roll-out and Lease Negotiation Opportunity
DFS REVENUE BENCHMARKING OPPORTUNITY SUMMARY
Significant gaps within Sofology store network
DFS CACI model currently being developed to
No local support analysis of Sofology store catchments
Sofology Sofology
store: store Implied opportunity of at least 70 Sofology stores in
40% within total
20 miles:
60%
Store roll-out will require appropriate logistics
infrastructure to support low-cost delivery
– May constrain pace of roll-out in FY19
An analysis of DFS order data shows that c.
40% of DFS store revenues are generated from Opportunity also to drive DFS group benefits on
DFS stores that do not have a Sofology located existing leases as part of new store opening
within 20 miles
Sofology however have a track record of being able
to add c.6 stores per annum
It is highly likely that there will be the opportunity to grow current Sofology LTM revenues of
£160m by two thirds through completing a true national roll-out
58Conclusion – The Sofology Opportunity
Our Targets:
Short-term buying synergies of £4m
– £1m of annualised benefits now secured
National
Roll-out Medium-term industry level margins of 6%-8% EBITDA
Roll-out opportunity to add at least two thirds to top-
line
Efficiency
Benefits Longer-term management ambition to move beyond
industry margins
Base
Profits
Sofology represents a significant opportunity to grow group profitability through efficiencies
unlocked by synergies and also a full national roll-out
59Questions
? ? ? ? ?
60Financial Model
Nicola Bancroft – Chief Financial Officer
61Financial Overview
REVENUES (£M) UNDERLYING PBT (£M)
Sofology Dwell/SW DFS
65
30
42 54 55 54
50
32 45
714 709 694
674
(1)
FY15 FY16 FY17 LTM18 FY15 FY16 FY17 LTM18
PBT BRIDGE FY16 TO LTM18 (£M)
64.5 -11.8
6.4 -6.0
-2.3 4.6 -5.7 -4.4
1.2 -1.5
45.0
Underlying
Operating
Underlying
Dwell & SW
Dwell & SW
Property
DFS volume
Deprec'n
Sofology
Interest
DFS gross
margin %
gross profit
LTM FY18
cost flex
op. costs
costs
change
impact
FY16
PBT
PBT
Group profits have fallen due principally to impact of cyclically-lower DFS volumes,
but also due to investment in growth levers to drive long-term opportunity
(1) Includes add-back of £21m of pre-tax shareholder loan interest.
62Our Flexible Cost Base Can Offsets a Proportion of Market Declines
LIMITED PERCENTAGE OF FIXED COSTS DFS BRAND CONTRIBUTION HIGHLIGHTS
DESPITE RECENT GROUP ACQUISITION IMPORTANCE OF FLEXIBILITY
DFS Brand Only 1H18 vs. 1H17
31% Drop-Through to EBITDA
Change in revenue -15.2
EBITDA
Fixed costs
Gross profit (volume
16.6% 6.2
effect)
Cost of
Variable / controllable
sales 4.3
costs
42.6%
Variable / Drop through to DFS
-4.7
Controll- Brand Contribution
able costs
Gross profit
32.2% 2.8
(margin/mix)
Movement in DFS
-1.9
Brand Contribution
Note: data shown is presented pro-forma for Sofology
Our cost base can be flexed relatively quickly to reflect the market environment
and offset the impact of lower revenues
63Structural Profit Improvements in the Near-Term
DFS GROSS MARGIN (%) DFS DISTRIBUTION COSTS
Delivery cost per order (£)
59.7% 59.8% 59.8% 59.9% 59.9% Start of CDC Programme
59.1% 59.2%
1H15 FY15 1H16 FY16 1H17 FY17 1H18 FY13 FY14 FY15 FY16 FY17 1H18
DWELL / SW OPERATING LEVERAGE GROUP PROPERTY COSTS OPPORTUNITY
46 lease expiries within the next six years
Cost of Sales Typical
45.2 22 opportunity
% of 30% of
Variable, Semi-Variable &
£600k costs
Discretionary Costs
37.3 7 8 per site
% Administrative costs 3 3 3 implies up to
£8m total
9.3% Brand Contribution post admin benefit
8.2% 2018 2019 2020 2021 2022 2023
We have clear opportunities to drive profit growth
through existing activities and growth investments already undertaken
64Consistent Cashflow Generation
CONSISTENTLY STRONG CASH CONVERSION
120 91.4% 100%
76.6% 77.8% 79.2% 80.1%
Adjusted EBITDA
Cash Conversion
(% of EBITDA)
100 69.2% 69.6% 80%
80 60%
60 40%
81.2 83.8 82.3 89.2 94.4 82.4 79.5
40 20%
FY12 FY13 FY14 FY15 FY16 FY17 LTM18
FY15-FY17 OPERATING CASH GENERATION AND USE OF CASH (£m)
266.0 -73.6 Debt
10.9 -39.6 paydown / Special
-29.1 -66.8 other Dividend
67.8 £22.7m £20.1m
EBITDA
Capex
Dividends
Available
Working
Interest
Tax
cashflow
Ordinary
Capital
Sofology
£25.0m
The Group has a consistent track record of cash generation. Between FY15-FY17 over £60m of
available cash was generated in addition to £66.9m of ordinary dividends paid
65Questions
? ? ? ? ?
66Concluding Remarks
Ian Filby - CEO
67Our Key Messages
1. We are broadening our appeal. We are not “moving upmarket”
2. Online is a key opportunity, with strong margins and ROCE, and
we already have developed the clear leading position to work
from. However our store estate is highly profitable and a critical
asset – we are however evolving its role for the future
3. Sofology has a strong strategic fit and creates a new, large
earnings growth opportunity
4. Our business model can adapt for all market environments, aided
by structural cost drivers in areas such as property costs.
Meanwhile our cash generation will remain strong with above
market sales growth
68The Group - Our Medium-Term Potential
£40m+ PBT
Growth Cost
Sofology Growth
Levers Drivers
Opportunity
Market Stronger Continued
Growth Customer Cash
Resuming Proposition Generation
69Questions
? ? ? ? ?
70You can also read