Capital Southwest Corporation Capital Southwest Corporation Investor Presentation - February 2022
←
→
Page content transcription
If your browser does not render page correctly, please read the page content below
Capital Southwest Corporation

Capital Southwest Corporation
Investor Presentation
February 2022

5400 Lyndon B. Johnson Freeway, Suite 1300 | Dallas, Texas 75240 | 214.238.5700 | capitalsouthwest.com
Important Notices
•   These materials and any presentation of which they form a part are neither an offer to sell, nor a solicitation of an offer to purchase, any
    securities of Capital Southwest.

•   These materials and the presentations of which they are a part, and the summaries contained herein, do not purport to be complete and
    no obligation to update or otherwise revise such information is being assumed. Nothing shall be relied upon as a promise or
    representation as to the future performance of Capital Southwest. Such information is qualified in its entirety by reference to the more
    detailed discussions contained elsewhere in Capital Southwest’s public filings with the Securities and Exchange Commission (the "SEC").

•   There is no guarantee that any of the estimates, targets or projections illustrated in these materials and any presentation of which they
    form a part will be achieved. Any references herein to any of the Capital Southwest’s past or present investments or its past or present
    performance, have been provided for illustrative purposes only. It should not be assumed that these investments were or will be profitable
    or that any future investments by Capital Southwest will be profitable or will equal the performance of these investments.

•   The information contained herein has been derived from financial statements and other documents provided by the portfolio companies
    unless otherwise stated.

•   Past performance is not indicative of future results. In addition, there can be no assurance that unrealized investments will be realized at
    the expected multiples shown as actual realized returns will depend on, among other factors, future operating results of each of Capital
    Southwest’s current portfolio companies, the value of the assets and economic conditions at the time of disposition, any related
    transaction costs, and the timing and manner of sale, all of which may differ from the assumptions on which Capital Southwest’s expected
    returns are based. In many instances, Capital Southwest will not determine the timing or manner of sale of its portfolio companies.

•   Capital Southwest has filed a registration statement (which contains the prospectus) with the SEC for any offering to which this
    communication may relate and may file one or more prospectus supplements to the prospectus in the future. Before you invest in any of
    Capital Southwest's securities, you should read the registration statement and the applicable prospectus and prospectus supplement(s),
    including the information incorporated by reference therein, in order to fully understand all of the implications and risks of an offering of
    Capital Southwest's securities. You should also read other documents Capital Southwest has filed with the SEC for more complete
    information about Capital Southwest and any offering of its securities. You may get these documents for free by visiting EDGAR on the
    SEC's website at www.sec.gov. Alternatively, Capital Southwest will arrange to send you any applicable prospectus and prospectus
    supplement(s) if you request such materials by calling us at (214) 238-5700. These materials are also made available, free of charge, on
    our website at www.capitalsouthwest.com. Information contained on our website is not incorporated by reference into this communication.

                                                                                                                                             Page 2
Forward-Looking Statements
• This presentation contains forward-looking statements relating to, among other things, the business, market
  conditions, financial condition and results of operations of Capital Southwest, the anticipated investment strategies
  and investments of Capital Southwest, and future market demand. Any statements that are not statements of
  historical fact are forward-looking statements. Forward-looking statements are often, but not always, preceded by,
  followed by, or include words such as "believe," "expect," "intend," "plan," "should" or similar words, phrases or
  expressions or the negative thereof. These statements are made on the basis of the current beliefs, expectations
  and assumptions of the management of Capital Southwest and speak only as of the date of this presentation. There
  are a number of risks and uncertainties that could cause Capital Southwest’s actual results to differ materially from
  the forward-looking statements included in this presentation.

• These risks include risks related to: changes in the markets in which Capital Southwest invests; changes in the
  financial, capital, and lending markets; regulatory changes; tax treatment and general economic and business
  conditions; our ability to operate our wholly owned subsidiary, Capital Southwest SBIC I, LP, as a small business
  investment company ("SBIC"); and uncertainties associated with the continued impact from the COVID-19
  pandemic, including its impact on the global and U.S. capital markets and the global and U.S. economy, the length
  and duration of the COVID-19 outbreak in the United States as well as worldwide and the magnitude of the
  economic impact of that outbreak, the effect of the COVID-19 pandemic on our business prospects and the
  operational and financial performance of our portfolio companies, including our and their ability to achieve their
  respective objectives, and the effects of the disruptions caused by the COVID-19 pandemic on our ability to continue
  to effectively manage our business.

• For a further discussion of some of the risks and uncertainties applicable to Capital Southwest and its business, see
  Capital Southwest’s Annual Report on Form 10-K for the fiscal year ended March 31, 2021 and its subsequent filings
  with the SEC. Other unknown or unpredictable factors could also have a material adverse effect on Capital
  Southwest’s actual future results, performance, or financial condition. As a result of the foregoing, readers are
  cautioned not to place undue reliance on these forward-looking statements. Capital Southwest does not assume any
  obligation to revise or to update these forward-looking statements, whether as a result of new information,
  subsequent events or circumstances, or otherwise, except as may be required by law.

                                                                                                                   Page 3
CSWC Senior Management
         Bowen S. Diehl
         • Joined Capital Southwest in March 2014
         • Former Co-Head of Sponsor Finance Group at American Capital
         • 20+ years of investing experience in middle market debt and equity
         • BE – Vanderbilt University. MBA – UT Austin
         • Lives in Dallas with wife and three children

         Michael S. Sarner
         • Joined Capital Southwest in June 2015
         • Former SVP Treasurer at American Capital
         • 20+ years of financial, treasury and BDC experience
         • BA – James Madison. MBA – George Washington University
         • Certified Public Accountant
         • Lives in Dallas with wife and three children

                                                                            Page 4
CSWC Company Overview
CSWC is a middle-market lending firm focused on supporting the
acquisition and growth of middle-market companies across the capital
structure
• CSWC was formed in 1961, and elected to be regulated as a BDC in 1988
• Publicly-traded on Nasdaq: Common Stock (“CSWC”)
• Internally Managed BDC with RIC tax treatment for U.S. federal income tax
  purposes
• September 2015: completed tax free spin off of CSW Industrials ("Spin Off")
  (NASDAQ: CSWI)
• April 2021: received SBIC license from the U.S. Small Business Administration
• 24 employees based in Dallas, Texas
• Total Balance Sheet Assets of $913 MM as of December 31, 2021
• Manage I-45 Senior Loan Fund (“I-45 SLF”) in partnership with Main Street
  Capital (NYSE: “MAIN”)

                                                                           Page 5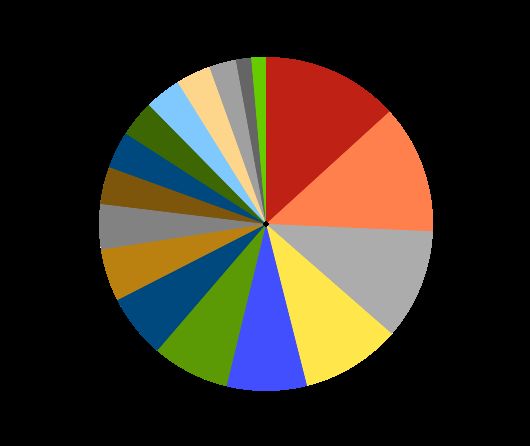
Pre-2015 Challenges
• Until spin off announcement, CSWC traded at a significant discount to NAV
          • Virtually 100% of CSWC’s portfolio was invested in equity
          • There was significant concentration in two industrial companies, with very large embedded
            capital gains
          • Did not pay meaningful dividend

                  Asset Allocation – 6/30/14                     Significant Market Discount to NAV
($ in millions)
                  LP Interest
                      $9                     Whitmore
                  Debt                         $96
                              Other
                   $3
                              Equity
                        Cash $67
                         $88
                                                        CSWI
                          Publicly-                     Assets
                                    RectorSeal
                           Traded
                                      $289
                          Equities
                            $219

                                    Other
                                     $12

      (1) Average P/NAV from 1/2/08 to 9/30/14

                                                                                                      Page 6
Solution: 2015 Tax Free Spin of Industrial Assets
CSWC Pre-Spinoff - 6/30/14
($ in millions)
LP Interest
$9
Debt
$3 Other
Equity
Cash $67
CSWC $88
Assets
Publicly- CSWI Assets
Traded $397
Equities
$219
CSWC Portfolio - 6/30/2014 (1) CSW Industrials, Inc.(2)
($ in millions)
LP Interest
NASDAQ Ticker CSWI
Other
$9 Equity Market Cap $1.7 B
$67 Publicly-
Debt Debt $281.0 MM
Traded
$3
Cash Equities Revenue $540.2 MM
$88 $219
EBITDA $119.7 MM
EBITDA Multiple 15.8x
(1) 6/30/2014 portfolio mix is pro forma for the spin off of the CSW Industrials companies
(2) Data from CapitalIQ on 1/31/2022
Page 7Portfolio Rotation to Income Generation
Since June 2014, CSWC has transformed its investment portfolio
increasing income earning assets from 1% of the investable portfolio to
92%
• Exited 24 legacy portfolio equity investments, generating $288 MM in proceeds
• Invested $1.5 B in 106 middle-market portfolio companies on balance sheet
• Invested $616 MM in 130 middle-market credits within I-45
6/30/2014 (excl. CSWI Companies) 12/31/21 Investable Assets
92% of Total Assets Generating Recurring Income
Page 8Investment Strategy
CORE: Lower Middle Market (“LMM”): CSWC led or Club Deals
◦ Companies with EBITDA between $3 MM and $20 MM
◦ Typical leverage of 2.0x – 4.0x Debt to EBITDA through CSWC debt position
◦ Commitment size up to $35 MM with hold sizes generally $5 MM to $30 MM
◦ Both Sponsored and Non-sponsored deals
◦ Securities include first lien, unitranche, and second lien
◦ Frequently make equity co-investments alongside CSWC debt
OPPORTUNISTIC: Upper Middle Market (“UMM”): Syndicated or Club,
First and Second Lien
▪ Companies typically have in excess of $20 MM in EBITDA
▪ Typical leverage of 3.0x – 5.5x Debt to EBITDA through CSWC debt position
▪ Hold sizes generally $5 MM to $15 MM
▪ Securities include first and second lien debt securities
▪ More liquid assets relative to LMM investments
▪ Provides flexibility to invest/divest opportunistically based on market conditions
and liquidity position
Page 9Key Highlights since launch of Credit Strategy
• Built investment and finance teams made up of people with long track records of investing in the middle market
• Of the 24 employees, 22 joined CSWC since launching the middle market lending strategy
• CSWC: Invested $1.5 B in 106 middle-market portfolio companies
• Debt marked at weighted average 97% of par
• 56 portfolio company exits generating proceeds of $637.6 MM and a weighted average IRR of 14.6%
• I-45 SLF: Invested $616 MM in 130 middle-market credits
• Debt marked at weighted average 95% of par
• 81 exits generating proceeds of $399 MM and a weighted average IRR of 11.1%
• Raised $335 MM Senior Secured Credit Facility, consisting of a syndicate of ten banks
• Issued $77.1 MM of 5.95% Five Year Unsecured Notes (“December 2022 Notes”) in December 2017
• Commenced Equity ATM Program in March 2019
• Raised $158.3 MM in gross proceeds at an average price of $22.17 since inception of Equity ATM Program
• Issued $125 MM of 5.375% Five Year Unsecured Notes (“October 2024 Notes”) in October 2019
• Issued $75 MM of 4.50% Five Year Unsecured Notes (“January 2026 Notes”) in December 2020
• CSWC raised an additional $65.0 MM of the January 2026 Notes at a price of 102.11% (4.0% YTM) in February 2021
• Issued $100 MM of 3.375% of Five Year Unsecured Notes due October 2026 (“October 2026 Notes”) in August 2021
• 5.375% Notes due 2024 ("October 2024 Notes") paid off in full ($125 MM aggregate principal) in conjunction with issuance of October 2026
Notes
• CSWC raised an additional $50.0 MM of the 3.375% October 2026 Notes in November 2021
• Received SBIC license from the U.S. Small Business Administration in April 2021
• Received $40.0 MM initial leverage commitment from the SBA in May 2021
• Total value creation of $9.44 per share (Net Asset Value + Cumulative Dividends Paid) since 9/30/2015 spin-off
• Obtained Wall Street analyst coverage from seven firms
Page 10Q3 2022 Highlights
Financial Highlights
• Q3 2022 Pre-Tax Net Investment Income (“NII”) of $11.8 MM or $0.51 per share
◦ Paid $0.47 per share Regular Dividend
◦ Paid $0.50 per share Supplemental Dividend
• Increased Regular Dividend to $0.48 per share for the quarter ending March 31, 2022, an increase
of 2.1% compared to the prior quarter
• Investment Portfolio at Fair Value increased to $877 MM from $818 MM in prior quarter
◦ $268.3 MM in total new committed investments, of which $213.5 MM was funded at close
◦ $158.4 MM in total proceeds from eleven debt prepayments and one equity exit
▪ Danforth equity exit generated a realized gain of $5.6 MM and an IRR of 99.2%
• Completed add-on of $50 MM in aggregate principal of 3.375% Notes due October ("October 2026
Notes") in November 2021
• Raised $16.0 MM in gross proceeds through Equity ATM Program during the quarter
◦ Sold shares at weighted-average price of $25.97 per share, or 159% of the prevailing NAV per share
• $141.7 MM available on Credit Facility, $11.0 MM available on initial SBA leverage commitment to
SBIC I, and $18.7 MM in cash and cash equivalents as of quarter end
Page 11Track Record of Consistent Dividends Continues
• In the last twelve months ended 12/31/2021, CSWC generated $1.84 per share in Pre-Tax NII and paid out $1.76 per share
in Regular Dividends
• Cumulative Pre-Tax NII Regular Dividend Coverage of 107% since the 2015 Spin-Off
• Total Special and Supplemental Dividends of $3.41 per share since the 2015 Spin-Off
• Undistributed Taxable Income ("UTI") of $0.32 per share as of December 31, 2021
24.0%
15.3%
19.7%
17.9% 15.1% 14.5% 11.5% 9.4% 9.1% 8.6%
9.4% 9.2%
9.1%
10.6% 9.6%
9.3%
6.6%
6.3%
5.6%
5.2%
Dividend Yield – Quarterly Annualized Total Dividend / CSWC Share Price at Qtr. End
Page 12History of Value Creation
Total Value (Net Asset Value + Cumulative Dividends Paid) Increase of
$9.44 per share at 12/31/2021 from 9/30/2015 Spin-off of CSWI
Page 13Q3 2022 Originations
$268.3 MM in total new committed investments to fourteen new portfolio
companies and twelve existing portfolio companies
• $213.5 MM funded at close
Portfolio Originations Q3 2022
Total Debt Funded Total Equity Unfunded Debt Yield to
Name Industry Type Funded at Close Commitments at
at Close ($000s) ($000s) Close ($000s) Maturity
Winter Services Operations, LLC Business services First Lien $20,000 $— $8,889 8.50%
National Credit Care, LLC Consumer services First Lien $22,500 $— $— 8.88%
Catbird NYC, LLC Consumer products & First Lien / Equity $16,000 $1,500 $4,125 9.15%
retail
KMS, Inc. Distribution First Lien $16,000 $— $4,571 8.69%
South Coast Terminals, LLC Specialty chemicals First Lien $18,065 $— $1,935 7.96%
ArborWorks, LLC Environmental First Lien / Equity $13,540 $100 $2,460 8.88%
Services
Mercury Acquisition 2021, LLC (dba Telecommunications First Lien / Second Lien $15,800 $— $— 10.65%
Tele-Town Hall)
The Producto Group, LLC Industrial products First Lien / Equity $13,770 $1,500 $— 10.90%
Lash OpCo, LLC Consumer products & First Lien $6,500 $— $7,481 8.88%
retail
Infolinks Media Buyco, LLC Media, marketing & First Lien / Equity $7,750 $588 $2,662 7.80%
entertainment
Page 14Q3 2022 Originations
Portfolio Originations Q3 2022
Total Debt Total Equity Unfunded Debt Yield to
Name Industry Type Funded at Close Funded at Commitments
($000s) Close ($000s) at Close ($000s) Maturity
SIB Holdings, LLC Business services First Lien / Equity $7,427 $500 $2,573 7.43%
Air Conditioning Specialist, Inc. Consumer services First Lien / Equity $9,000 $500 $1,000 8.95%
Spotlight AR, LLC Business services First Lien / Equity $7,500 $750 $2,000 8.88%
Cityvet, Inc. Healthcare services First Lien $— $— $10,000 9.42%
Klein Hersh, LLC Business services First Lien $9,875 $— $— 8.25%
Everest Transportation Systems, Transportation and First Lien $9,167 $— $— 9.63%
LLC logistics
ISI Enterprises, LLC Software & IT First Lien / Equity $5,000 $1,000 $2,000 8.88%
services
NinjaTrader, Inc. Financial services First Lien $3,900 $— $3,036 7.78%
Zenfolio Inc. Business services First Lien $4,000 $— $— 10.50%
Lighting Retrofit International, Environmental First Lien $— $— $1,042 8.00%
LLC (dba Envocore) Services
Well-Foam, Inc. Energy services First Lien $— $— $1,000 10.40%
(upstream)
GS Operating, LLC Distribution First Lien $800 $— $— 8.50%
VTX Holdings, Inc. (dba Vertex Software & IT Equity $— $200 $— N/A
One) services
Roseland Management, LLC Healthcare services Equity $— $136 $— N/A
LGM Pharma, LLC Healthcare Subordinated Debt $88 $— $— 25.00%
products
Delphi Behavioral Health Group, Healthcare services First Lien $70 $— $— 13.00%
LLC
Total / Wtd. Avg $206,752 $6,774 $54,774 (1) 8.97%
(1) Unfunded Commitments consist of $32.2 MM in delayed draw term loans, $22.1 MM in revolvers, and $0.5 MM in unfunded equity
Page 15Track Record of CSWC Exits Continues
$158.4 MM in total proceeds from twelve portfolio company exits
• During the quarter, CSWC exited eleven debt investments and one equity investment, generating total
proceeds of $158.4 MM and an IRR of 16.2%
• Cumulative IRR of 14.6% on 56 portfolio company exits generating $637.6 MM in proceeds since launch of
credit strategy in January 2015
Portfolio Exits Q3 2022
Net Proceeds Realized Gain
Name Industry Type ($000s) ($000s) IRR
VTX Holdings, Inc. (dba Vertex One) Software & IT services First Lien - Last Out $21,575 $316 13.9%
ICS Distribution, LLC (dba Relevant Industrial services First Lien - Last Out $20,500 $315 13.6%
Rental Solutions)
Clickbooth.com, LLC Media, marketing & First Lien $18,169 $194 12.0%
entertainment
KMS, Inc. Distribution First Lien - First Out $16,000 $— 9.4%
Broad Sky Networks, LLC Telecommunications First Lien $15,788 $288 13.6%
ASC Ortho Management Company, LLC Healthcare services First Lien / Second Lien $15,012 $114 12.1%
ESCP DTFS, Inc. (dba Industrial Industrial services First Lien $11,700 $150 12.3%
Specialty Services)
Capital Pawn Holdings, LLC Consumer products & First Lien $8,854 $11 12.1%
retail
Adams Publishing Group, LLC Media, marketing & First Lien $8,647 $91 11.2%
entertainment
Sonobi, Inc. Media, marketing & First Lien $8,500 $140 13.7%
entertainment
Chemistry Rx Holdings, LLC Specialty chemicals First Lien $7,096 $123 14.8%
Danforth Advisors, LLC Business services Equity $6,517 $5,642 99.2%
Total / Weighted Average $158,358 $7,384 16.2%
Page 16CSWC Investment Portfolio Composition
Maintaining conservative portfolio leverage while receiving attractive
risk-adjusted returns
Investment Portfolio - Statistics Q3 2022
9/30/2021 12/31/2021
Total CSWC Total CSWC
(In Thousands) Portfolio Portfolio
Number of Portfolio Companies 63 70
Total Cost $749,521 $810,800
Total Fair Value $758,580 $819,176
Average Hold Size Debt Investments (at Fair Value) $11,685 $11,820
Average Hold Size Equity Investments (at Fair
Value) $2,231 $1,910
% First Lien Investments (at Fair Value) 82.4% 82.9%
% Second Lien Investments (at Fair Value) 6.8% 6.5%
% Subordinated Debt Investments (at Fair Value) 1.6% 1.5%
% Equity (at Fair Value) 9.1% 9.1%
Wtd. Avg. Yield (2) 9.7% 9.5%
Wtd. Avg. EBITDA of Issuer ($MM's) (3) $17.4 $19.6
Wtd. Avg. Leverage through CSWC Security (4) 4.1x 3.9x
Note: All metrics above exclude the I-45 Senior Loan Fund
(1) At December 31, 2021 and September 30, 2021, we had equity ownership in approximately 56% and 49%, respectively, of our investments
(2) The weighted-average annual effective yields were computed using the effective interest rates during the quarter for all debt investments at cost as of December 31, 2021, including accretion of original issue
discount but excluding fees payable upon repayment of the debt instruments. As of December 31, 2021, there were three investments on non-accrual status. As of September 30, 2021, there were three investments
on non-accrual status. Weighted-average annual effective yield is not a return to shareholders and is higher than what an investor in shares in our common stock will realize on its investment because it does not
reflect our expenses or any sales load paid by an investor
(3) Includes CSWC debt investments only. Weighted average EBITDA metric is calculated using investment cost basis weighting. For the quarter ended December 31, 2021, three portfolio companies are excluded
from this calculation due to a reported debt to adjusted EBITDA ratio that was not meaningful. For the quarter ended September 30, 2021, three portfolio companies are excluded from this calculation due to a
reported debt to adjusted EBITDA ratio that was not meaningful
(4) Includes CSWC debt investments only. Calculated as the amount of each portfolio company’s debt (including CSWC’s position and debt senior or pari passu to CSWC’s position, but excluding debt subordinated
to CSWC’s position) in the capital structure divided by each portfolio company’s adjusted EBITDA. Weighted average leverage is calculated using investment cost basis weighting. Management uses this metric as a
guide to evaluate relative risk of its position in each portfolio debt investment. For the quarter ended December 31, 2021, three portfolio companies are excluded from this calculation due to a reported debt to
adjusted EBITDA ratio that was not meaningful. For the quarter ended September 30, 2021, three portfolio companies are excluded from this calculation due to a reported debt to adjusted EBITDA ratio that was not
meaningful
Page 17Credit Portfolio Investment Rating Migration
Four loans upgraded and no loans downgraded during the quarter
Investment Rating 9/30/2021 Investment Rating Investment Rating 12/31/2021
Upgrades Downgrades
Fair % of Fair % of Fair % of Fair % of
# of # of # of # of
Loans Value Portfolio Loans Value Portfolio Loans Value Portfolio Loans Value Portfolio
($MM) (FV) ($MM) (FV) ($MM) (FV) ($MM) (FV)
1 8 $112.5 15.8% 2 $29.5 4.0% 0 $0.0 —% 8 $129.5 17.4%
2 53 $515.8 73.7% 2 $24.1 3.2% 0 $0.0 —% 60 $580.6 78.0%
3 6 $58.9 9.7% 0 $0.0 —% 0 $0.0 —% 5 $34.4 4.6%
4 1 $2.3 0.8% 0 $0.0 —% 0 $0.0 —% 1 $0.2 0.0%
Wtd. Avg. Investment 1.96 1.90
Rating (at Cost)
Page 18Credit Portfolio Heavily Weighted Towards First Lien Investments
91% of Credit Portfolio as of 12/31/2021 in first lien senior secured loans
Credit Portfolio Heavily Weighted to First Lien
91%
90% 91%
91% 92%
91%
90%
90%
90%
87% 87%
86%
86%
86% 85%
7% 9% 10% 10% 9% 9% 8% 8% 8% 7% 7% 6% 8% 7% 7%
7% 6% 4% 4% 4% 4% 2% 2% 2% 2% 2% 2% 2% 2% 2%
First Lien Second Lien Sub-Debt
Page 19CSWC Portfolio Mix as of 12/31/2021 at Fair Value
Current Investment Portfolio of $877 MM continues to be diverse
across industries
Current Investment Portfolio (By Type) Current Investment Portfolio (By Industry)
(a) I-45 SLF consists of 95% first lien senior secured debt
(b) Equity represents equity co-investments across 39 portfolio companies
Page 20Senior Loan Fund (“I-45”)
• Joint Venture with Main Street Capital Corporation (NASDAQ: “MAIN”)
• Fund invests in predominately Upper Middle Market first lien loans
• Total maximum fund size of ~$250 MM
• Total Equity Commitment of $95 MM from CSWC (80%) and MAIN (20%)
• Total Debt Commitment of $150 MM through Credit Facility led by Deutsche Bank
• Recurring run-rate ROE to CSWC of ~10.0%, paid quarterly
• CSWC and MAIN jointly control Board of Managers
• Capital raising, fund tracking, monitoring, and financial reporting are managed by
CSWC
• Origination capabilities are a joint effort between CSWC and MAIN
• All credit decisions are joint/unanimous between CSWC and MAIN
• I-45 fully disclosed in CSWC financials, but “off-balance sheet” for purposes of
BDC Regulatory Leverage Test
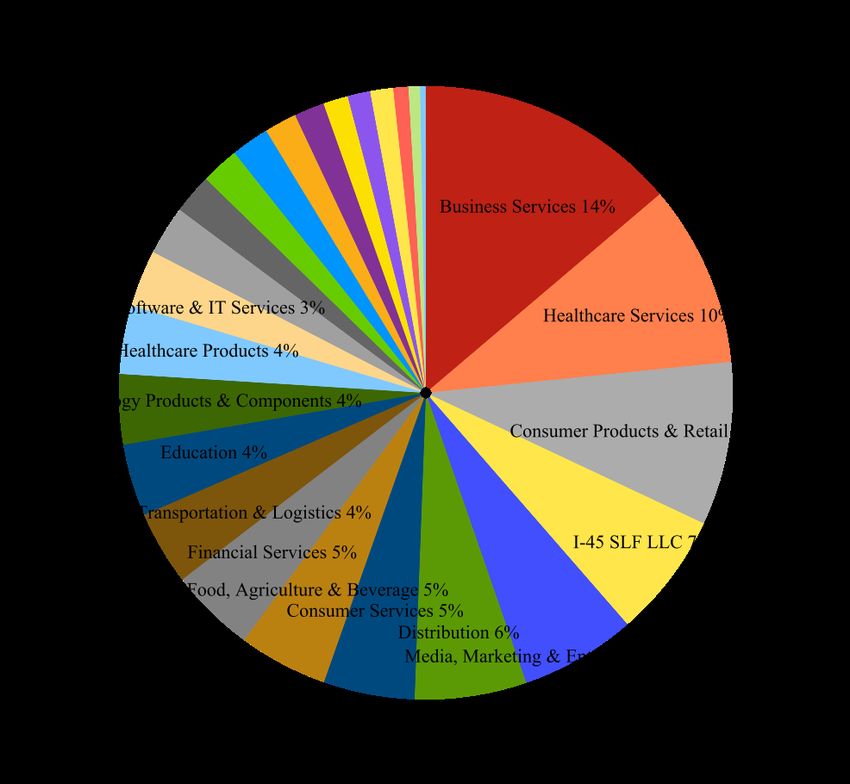
Page 21I-45 Portfolio Overview
I-45 loan portfolio of $180.0 MM is 95% first lien senior secured debt
with average hold size of 2.4% of the I-45 portfolio
Current I-45 Portfolio (By Type) Current I-45 Portfolio (By Industry)
Healthcare Products
Telecommunications
13%
Business Services
12%
11%
Consumer Products
and Retail
10%
8%
Telecommunications
High Tech Industries
Services: Consumer
I-45 Portfolio Statistics
(In Thousands)
3/31/2021 6/30/2021 9/30/2021 12/31/2021
Total Investments at Fair Value $164,351 $169,610 $169,042 $180,052
Fund Leverage (Debt to Equity) at Fair Value 1.27x 1.40x 1.30x 1.52x
Number of Issuers 36 38 38 42
Wtd. Avg. Issuer EBITDA $77,649 $77,851 $75,025 $72,800
Avg. Investment Size as a % of Portfolio 2.8% 2.6% 2.6% 2.4%
Wtd. Avg. Net Leverage on Investments (1) 4.4x 4.8x 4.7x 5.0x
Wtd. Avg. Spread to LIBOR 6.0% 6.0% 5.9% 6.2%
Wtd. Avg. Duration (Yrs) 3.0 3.0 3.7 3.7
(1) Through I-45 security
Page 22CSWC Capitalization
• $335 MM Credit Facility: led by ING Capital (ten banks)
• Accordion up to $400 MM
• $190 MM drawn as of 12/31/21
• Matures August 2026; L + 215
• $40 MM Initial Leverage Commitment from SBIC
• First pooled Debentures mature September 2031; $29 MM in Debentures drawn as
of 12/31/21
• $140 MM January 2026 Notes
• Matures January 2026, 4.50% Fixed
• $150 MM October 2026 Notes
• Matures October 2026, 3.375% Fixed
• Balance Sheet Cash: Approximately $19 MM as of 12/31/21
• $150 MM I-45 Credit Facility: led by Deutsche Bank (four banks)
• $109.5 MM drawn as of 12/31/21
• Matures March 2026; L + 215
• Regulatory Leverage (Debt/Equity): 1.23x to 1.0x
• Well below the current 2:1 regulatory limitation
Page 23Significant Unused Debt Capacity with Long-Term Duration
Earliest debt maturity occurs in January 2026
Facility Total Commitments Interest Rate Maturity Principal Drawn Undrawn Commitment
January 2026 Notes (1) $140.0 MM 4.50% January 2026 $140.0 MM N/A
I-45 Credit Facility (2) $150.0 MM L + 2.15% March 2026 $109.5 MM $40.5 MM
Credit Facility (3) $335.0 MM L + 2.15% August 2026 $190.0 MM $141.7 MM (4)
October 2026 Notes (5) $150.0 MM 3.375% October 2026 $150.0 MM N/A
SBA Debentures $40.0 MM 1.43% (6) September 2031 (7) $29.0 MM $11.0 MM (8)
(1) Redeemable in whole or in part at any time prior to October 31, 2025, at par plus a "make whole" premium, and thereafter at par
(2) CSWC owns 80% of the equity and 50% of the voting rights of I-45 SLF LLC with a joint venture partner
(3) The Credit Facility has an accordion feature that allows for an increase in total commitments up to $400 MM
(4) Net of $3.3 MM in letters of credit outstanding
(5) Redeemable in whole or in part at any time prior to July 1, 2026, at par plus a "make whole" premium, and thereafter at par
(6) Weighted average interest rate of all pooled and non-pooled SBA Debentures for the three months ended December 31, 2021
(7) First pooled SBA Debentures mature on September 1, 2031
(8) Current statutes and regulations permit SBIC I to borrow up to $175 million in SBA Debentures with at least $87.5 million in regulatory capital, subject to SBA approval
Page 24Internally Managed BDC Advantages
• We operate under a shareholder friendly Internally Managed structure which:
• Aligns management incentives with long term sustainable shareholder value creation
• Historically has rewarded performing Internally Managed BDCs with price to book premiums of 0.5x
versus Externally Managed peers
• Incurs lower operating expenses versus the Externally Managed Structure
• Average of 2.1%1 for Internally Managed BDCs vs. 3.3%1 for similarly sized Externally Managed
BDCs
• Management is targeting a long-term operating expense ratio of less than 2.0% of assets
• Achieved initial operating expense target of below 2.5% of assets in 2020
• Senior personnel and corporate infrastructure already in place; Management plans to conservatively add
junior members to the team in lock step with growth in the asset base
• With the passage of the BDC Modernization Act, virtually 100% of incremental levered returns
will go directly to shareholders of Internally Managed BDCs in the form of dividends, while only
a portion of the incremental levered returns will translate into increased dividends to
shareholders of Externally Managed BDCs
• Externally Managed BDCs pay incremental management and incentive fees on incremental dollars
invested
• Internally Managed BDCs do not have management or incentive fee structures
(1) Internally managed BDCs include MAIN and HTGC. Externally Managed BDCs include 11 BDCs with approximately $500 MM - $1.5 B of assets
Page 25Operating Leverage Trend
Continue to realize operating efficiencies of internally managed structure
Total Assets Operating Expenses(1) as % of Average Total Assets
Note: Operating Leverage calculated as last twelve months operating expenses (excluding interest expense) divided by average annual assets
(1) Operating expenses exclude interest expense
Page 26NAV per Share Bridge from Quarter Ended 9/30/2021
Investment Portfolio
Earnings / Dividends Valuation Change Other Corporate
$(0.46) per Share $0.02 per Share $0.27 per Share
Page 27Interest Rate Sensitivity
Fixed vs. Floating Credit Portfolio Exposure (1)
Illustrative Annual Illustrative Annual NII
Change in Base Interest Rates
NII Change ($'s) Change (Per Share)
(25 bps) 535,329 0.02
25 bps (639,947) (0.03)
50 bps (1,279,894) (0.05)
75 bps (1,824,168) (0.08)
100 bps (887,763) (0.04)
125 bps 349,572 0.01
150 bps 1,606,072 0.07
(1) Portfolio Exposure includes I-45 assets pro rata as a % of CSWC’s equity investment in the fund
Note: Illustrative change in annual NII is based on a projection of CSWC’s existing debt investments as of 12/31/2021, adjusted only for changes in Base
Interest Rate. Base Interest Rate used in this analysis is 3-Month LIBOR of 0.21% at 12/31/2021. The results of this analysis include the I-45 Senior Loan
Fund, which is comprised of 98% floating rate debt assets and 100% floating rate liabilities
Page 28Appendix A: Investment Team
Page 29Investment Team with Strong Credit Experience
Year
Years Joined
Name Title Experience CSWC Relevant Experience
Bowen Diehl Chief Executive 25 2014 - Managing Director and Co-Head of Sponsor Finance at
Officer / CIO American Capital
- Merrill Lynch Investment Banking
- Chase Securities Investment Banking
Josh Weinstein Senior Managing 20 2015 - Principal at H.I.G. WhiteHorse
Director - VP at WhiteHorse Capital Partners
- Analyst at Morgan Stanley and Citigroup
Ryan Kelly Managing 13 2010 - Analyst at Houlihan Lokey
Director
Laura Zengilowski Principal 13 2021 - Vice President at AB Private Credit Investors
- Senior Associate at Falcon Investments
- Analyst at Deutsche Bank
Grant Eason Senior Vice 9 2019 - Associate at Stonehenge Capital Company
President - Analyst at Stephens, Inc.
Spencer Klein Senior Vice 7 2015 - Analyst at J.P. Morgan
President
Abishai Pinto Senior Associate 5 2019 - Associate at Deerpath Capital
- Analyst at Jefferies
Brad Forrest Senior Associate 6 2021 - Associate at OFS Management
- Associate at Park Cities Asset Management
Will Seaman Associate 3 2019 - Analyst at SunTrust Robinson Humphrey
Will Riley Associate 3 2019 - Associate at PricewaterhouseCoopers
Michael Bruley Analyst 2 2020 - Analyst at Rosewood Private Investments
Maggie Barbour Analyst 1 2021 - Analyst at Hudson Way Capital Partners
Rajan Cinclair Analyst 1 2021 - Analyst at Tactical Investments Group
Page 30Appendix B: Underwriting &
Portfolio Management
Page 31Disciplined Investment Process: Investment Criteria
Experienced Management
• Relevant experience and track record of success
Team with Meaningful
• Significant economic interest in the future success of the company
Equity Ownership
• Differentiated product and/or service that gives company a sustainable
Sustainable Business reason to exist
Model • Leverageable cash flow with ability to maintain or grow margins
• Market leader in its business segments
Strong Competitive
• Quantifiable competitive advantage versus their competitors with
Position barriers to entry
• Inability for any one customer to significantly affect the company’s
Diversification of financial performance and ability to service debt
Customers and Suppliers • Sustainability of supply and cost of inputs
Ability of Capital Structure • Capital structure appropriate for business model and industry
to Sustain Economic • Downside scenario modeling proves ability to sustain economic cycles
Cycles while servicing debt with leverage inside enterprise value
Significant Equity Value
• Significant underlying equity value to support debt in capital structure
Supporting Debt
Page 32Disciplined Process: Focus on Capital Preservation
Due Diligence Documentation
Initial Portfolio
Sourcing & &
Evaluation Management
Underwriting Closing
• Extensive network • Review deal tear- • Continuous testing • Emphasis on • Monthly meeting
of long standing sheets outlining of investment covenants, voting to review all
private equity, investment theses theses and risk rights, cash flow portfolio positions
intermediary, and and risks on mitigates recapture, and • Proactive dialogue
co-lender weekly basis • Lead or piggyback incremental debt with sponsor,
relationships • Quick, thoughtful third party diligence provisions credit facility
• Team effort led by financing read to work on accounting, • Overly borrower- agent,
senior members deal source legal, operations, friendly credit management, and
• Systematic CRM- • Rigorous analysis industry, key agreements will industry
driven relationship of opportunity with management, and kill a deal relationships
tracking emphasis on projections • Team credit cycle • Board seat or
• Emphasis on downside scenario • Visit key locations experience critical observer rights on
partnership-centric • Meet with • 30-50 page final IC to understanding lower middle
approach management memo memorializes how legal market names
work and findings provisions are • Quarterly portfolio
• Structural and size • Present credit
used during valuations and
flexibility important case to IC; 12-20 • Diligence
restructurings covenant reviews
to maintain page memo reputations of
relevance to transaction partners • Continuous
• Advance detailed
sourcing network communication on
term sheet • Present to IC for
deal, no surprises
final approval
Consistent, Downside-Focused, Risk-Return Centric Credit Approach
Page 33Maintaining Investment Discipline as Pipeline Grows
788 deals reviewed, $548.4 million closed in LTM ending 12/31/21
CSWC Investment Portfolio
Total Deals Reviewed
788
Indicative Terms Submitted
220
Initial IC Review
41
Diligence &
Final IC
Approval
34
34 Portfolio Investments & 3 Add-Ons / Upsizes
$548.4 MM Invested
Page 34CSWC Taps Into a Broad Network of Deal Sources
Private Equity
Intermediaries and Lending Partners
Page 35Portfolio Monitoring Process
• Team-based approach with objectives to: Example Monthly Portfolio Tracker
• Continually evaluate portfolio
• Identify potential problems early
• Prompt deal teams to proactively address issues
• Monitoring mechanisms
• Monthly/quarterly financials
• Regular communication with management/sponsor/agent
• Board observation/membership rights in direct deals
• Monthly investment team meeting
• Review package of credit portfolio tracker reports for each
investment
• Discuss performance and issues for each deal
• Assign follow-up duties to team overseeing struggling positions
• Assign and monitor 1 to 4 Investment Rating for each
debt investment
• 1 represents material outperformance, 4 represents material
underperformance
• Senior executives will be involved day-to-day on
workouts
Page 36Valuation Process Overview
Final Valuation Audit
Update Models Begin Valuing Valuation Meeting And Committee/
Valuation Review 1 3rd Party Review
Sr. Mgmt. Board of Directors
Sign-offs
Step 1 Step 2 Step 3 Step 4 Step 5 Step 6 Step 7
Portfolio Finance CFO and 3rd Party Internal Final Review Board of
Trackers and Department Treasurer review Valuation Valuation and Sign-off by Directors
Valuation updates valuation preliminary Consultants Meeting (Sr. Senior Review and
Models models and begins internal review selected Management, Management Approval
updated by valuation analysis valuation results investments and Deal Teams, and Auditors
Deal Teams provide Finance Dept.)
valuation ranges
Valuation Methodologies Utilized:
• DCF
• Comparable Public Companies
• Comparable Transactions
• Market Yield Pricing Analysis
• Market Quotes
• Third Party Offers
• Liquidation Value
• Option Pricing Models
Page 37Appendix C: Financial
Statements
Page 38Balance Sheet
Quarter Ended Quarter Ended Quarter Ended Quarter Ended
(In Thousands, except per share amounts) 3/31/21 6/30/21 9/30/21 12/31/21
Assets
Portfolio Investments $688,432 $798,647 $818,218 $876,765
Cash & Cash Equivalents 31,613 16,543 26,840 18,668
Other Assets 15,539 20,858 21,764 17,122
Total Assets $735,584 $836,048 $866,822 $912,555
Liabilities
SBA Debentures $— $— $16,709 $27,965
October 2024 Notes 122,879 123,041 — —
January 2026 Notes 138,425 138,504 138,545 138,630
October 2026 Notes — — 97,264 146,357
Credit Facility 120,000 190,000 215,000 190,000
Other Liabilities 18,029 16,408 17,359 22,266
Total Liabilities $399,333 $467,953 $484,877 $525,218
Shareholders Equity
Net Asset Value $336,251 $368,095 $381,945 $387,337
Net Asset Value per Share $16.01 $16.58 $16.36 $16.19
Regulatory Debt to Equity 1.13x 1.23x 1.18x 1.23x
Page 39Income Statement
Quarter Ended Quarter Ended Quarter Ended Quarter Ended
(In Thousands, except per share amounts) 3/31/21 6/30/21 9/30/21 12/31/21
Investment Income
Interest Income $12,282 $14,626 $16,100 $16,921
PIK Interest Income 2,796 975 879 814
Dividend Income 1,661 2,657 2,070 1,714
Fees and Other Income 434 321 1,247 2,862
Total Investment Income $17,173 $18,579 $20,296 $22,311
Expenses
Cash Compensation $1,631 $1,432 $2,298 $3,353
Share Based Compensation 708 1,076 923 849
General & Administrative 1,278 1,677 1,630 1,617
Total Expenses (excluding Interest) $3,617 $4,185 $4,851 $5,819
Interest Expense $4,688 $4,955 $5,405 $4,655
Pre-Tax Net Investment Income $8,868 $9,439 $10,040 $11,837
Gains / Losses and Taxes
Net Realized and Unrealized Gains on Investments $2,660 $6,099 $2,805 $661
Realized Losses on Extinguishment of Debt (459) — (17,087) —
Income Tax (Expense) / Benefit (852) (396) (314) 62
Net increase (decrease) in Net Assets Resulting from Operations $10,217 $15,142 $(4,556) $12,560
Weighted Average Diluted Shares Outstanding 20,376 21,202 22,534 23,433
Pre-Tax NII Per Diluted Weighted Average Share $0.44 $0.45 $0.45 $0.51
Page 40Portfolio Statistics
Continuing to build a well performing credit portfolio
Quarter Ended Quarter Ended Quarter Ended Quarter Ended
(In Thousands) 3/31/21 6/30/21 9/30/21 12/31/21
Portfolio Statistics
Fair Value of Debt Investments $572,614 $671,257 $689,421 $744,681
Average Debt Investment Hold Size $11,228 $11,377 $11,490 $11,820
Fair Value of Debt Investments as a % of Par 97% 97% 97% 97%
% of Investment Portfolio on Non-Accrual (at Fair Value) —% 1.8% 3.0% 1.6%
Weighted Average Investment Rating (1) 2.00 1.96 1.96 1.90
Weighted Average Yield on Debt Investments 10.76% 10.04% 9.66% 9.48%
Total Fair Value of Portfolio Investments $688,432 $798,647 $818,218 $876,765
Weighted Average Yield on all Portfolio Investments 10.22% 10.12% 9.60% 9.35%
Investment Mix (Debt vs. Equity) (2)(3) 92% / 8% 91% / 9% 91% / 9% 91% / 9%
(1) CSWC utilizes an internal 1 - 4 investment rating system in which 1 represents material outperformance and 4 represents material
underperformance. All new investments are initially set to 2. Weighted average investment rating calculated at cost
(2) Excludes CSWC equity investment in I-45 Senior Loan Fund
(3) At Fair Value
Page 41Investment Income Detail
Constructing a portfolio of investments with recurring cash yield
Quarter Ended Quarter Ended Quarter Ended Quarter Ended
(In Thousands) 3/31/21 6/30/21 9/30/21 12/31/21
Investment Income Breakdown
Cash Interest $11,668 $13,939 $15,370 $16,164
Cash Dividends 1,660 2,657 2,069 1,714
PIK Income 2,796 975 879 814
Amortization of purchase discounts and fees 616 688 731 758
Management/Admin Fees 234 227 327 340
Prepayment Fees & Other Income 199 93 920 2,520
Total Investment Income $17,173 $18,579 $20,296 $22,310
Key Metrics
Cash Income as a % of Investment Income 80% 91% 92% 93%
% of Total Investment Income that is Recurring 99% 96% 95% 89%
Page 42Key Financial Metrics
Strong Pre-Tax Net Investment Income and Dividend Yield driven by
net portfolio growth and investment performance
Quarter Ended Quarter Ended Quarter Ended Quarter Ended
3/31/21 6/30/21 9/30/21 12/31/21
Key Financial Metrics
Pre-Tax Net Investment Income Per Wtd Avg Diluted Share $0.44 $0.45 $0.45 $0.51
Pre-Tax Net Investment Income Return on Equity (ROE)(1) 11.06% 11.12% 10.75% 12.35%
Realized Earnings Per Wtd Avg Diluted Share $0.29 $0.38 $(0.17) $0.62
Realized Earnings Return on Equity (ROE)(1) 7.45% 9.53% (4.14)%(2) 15.25%
Earnings Per Wtd Avg Diluted Share $0.50 $0.71 $(0.20) $0.54
Earnings Return on Equity (ROE)(1) 12.74% 17.84% (4.88)%(2) 13.11%
Regular Dividends per Share $0.42 $0.43 $0.44 $0.47
Supplemental/Special Dividends per Share $0.10 $0.10 $0.10 $0.50
Total Dividends per Share $0.52 $0.53 $0.54 $0.97
(1) Return on Equity is calculated as the quarterly annualized Pre-Tax NII, Realized Earnings, or Total Earnings, respectively, divided
by equity at the end of the prior quarter
(2) Realized Earnings and Earnings include ($17.1) MM or ($0.76) per weighted average diluted share for realized losses on
extinguishment of debt in the 9/30/21 quarter
Page 43Corporate Information
Board of Directors Senior Management Fiscal Year End
Inside Directors Bowen S. Diehl March 31
Bowen S. Diehl President & Chief Executive Officer
Independent Directors Independent Auditor
David R. Brooks Michael S. Sarner
RSM US LLP
Christine S. Battist Chief Financial Officer, Secretary & Treasurer Chicago, IL
T. Duane Morgan
Jack D. Furst Joshua S. Weinstein
William R. Thomas Senior Managing Director Corporate Counsel
Ramona Rogers-Windsor
Investor Relations
Eversheds Sutherland (US) LLP
Michael S. Sarner
Capital Southwest
Corporate Offices & Website 214-884-3829
5400 Lyndon B. Johnson Freeway msarner@capitalsouthwest.com Transfer Agent
13th Floor American Stock Transfer & Trust Company, LLC
Dallas, TX 75240 Securities Listing 800-937-5449
http://www.capitalsouthwest.com Nasdaq: "CSWC" (Common Stock) www.amstock.com
Industry Analyst Coverage
Firm Analyst Contact Information
Ladenburg Thalmann & Co., Inc. Mickey M. Schleien, CFA Direct: 305-572-4131
JMP Securities, LLC Devin Ryan Direct: 415-835-8900
B. Riley Securities Sarkis Sherbetchyan Direct: 310-689-5221
Hovde Group Bryce Rowe Direct: 804-318-0969
Jefferies, LLC Kyle Joseph Direct: 510-418-0754
Raymond James & Associates Robert Dodd Direct: 901-579-4560
Oppenheimer & Co., Inc. Mitchel Penn Direct: 212-667-7136
Page 44You can also read