Capturing China's Brightest Science & Technology STARs - Overview of the KraneShares ICBCCS SSE STAR Market 50 Index UCITS ETF (Ticker: KSTR)
←
→
Page content transcription
If your browser does not render page correctly, please read the page content below

KSTR
                                 30/Jun/2021

Capturing China’s
Brightest Science
& Technology STARs
Overview of the KraneShares
ICBCCS SSE STAR Market 50
Index UCITS ETF (Ticker: KSTR)

info@kraneshares.com                       1
Introduction to KraneShares
 About KraneShares
 Krane Funds Advisors, LLC is the investment manager for KraneShares
 ETFs. The firm is focused on providing investors with strategies to capture
 China’s importance as an essential element of a well-designed investment
 portfolio. KraneShares ETFs represent innovative, first to market strategies
 that have been developed based on the firm and its partners’ deep knowledge
 of investing. These strategies allow investors to stay current on global market
 trends and provide meaningful diversification. Krane Funds Advisors, LLC, is
 a signatory of the United Nations-supported Principles for Responsible
 Investing (UN PRI).
 In 2018, KraneShares established operations in the United Kingdom (UK) and
 Europe to better deliver its renowned China-focused ETFs to investors in the
 region. In addition to launching UK/Europe-specific versions of its most
 popular US-listed funds, KraneShares also develops strategies tailored to
 meet the specific needs of its UK/European clients.

                                                                                   22
Investment Strategy:

     KSTR                                       KSTR seeks to track the performance of the Shanghai Stock Exchange (SSE) Science and Technology Innovation Board 50 Index
                                                (STAR 50 Index). The Index is comprised of the 50 largest companies listed on the SSE Science and Technology Innovation Board
                                                (STAR Market) as determined by market capitalization and liquidity.
 KraneShares ICBCCS
 SSE STAR Market 50                             STAR Market Highlights:
 Index UCITS ETF                                • Facilitates the fast-tracking of private science and technology companies to an initial public offering (IPO).
                                                • Since its establishment in July 2019, the STAR Market has become one of the largest IPO markets globally1 and a premier listing
                                                  venue for prominent Chinese unicorns (privately held startup companies valued at over $1 billion).
                                                • Recent increases in fund-raising activity on Chinese exchanges can largely be attributed to the STAR Market, which accounted
                                                  for 47% of capital raised across China’s Mainland A-Share market in 2020.2
                                                • Potential inclusion in the SSE Composite Index and Shanghai-Hong Kong Stock Connect could result in greater flows for STAR
                                                  Market securities.

                                                KSTR Features:
                                                • Exposure to companies poised to be China’s future leaders across industries that could represent the growth engine of China for
                                                  decades to come.
                                                • Innovation-driven science and technology companies in China that offer a potential source of uncorrelated, long-term growth.
                                                • Includes companies from industries such as new-generation information technology, biomedicine, new energy, and
                                                  environmental protection.

1. YiCai Global, “China’s Year-Old Star Market Outshines the Venerable Nasdaq”, 23/Jul/ 2020, retrieved 30/Jun/2021.
2. The Asset, “A bumper IPO year despite Covid-19”, 14/Dec/2020, retrieved 30/Jun/2021.
                                                                                                                                                                                    3
Why China?

The China A-Share market is too big to ignore
Even though China is the world’s second largest economy and stock market, China A-Shares are still underrepresented in
global capital markets.

           Top 5 Country Weights in the MSCI All Country World                                    Top 5 Country Weights in the MSCI All Country
                      Index (Market Cap Weighted)1                                                        World Index (GDP Weighted)1
     70                                                                                  30

     60                                                                                  25

     50
                                                                                         20

     40
                                                                                         15

                                                                                     %
 %

     30
                                                                                         10
     20

                                                                                          5
     10

      0                                                                                   0
          United States         Japan             China            United   France            United States   China      Japan     Germany        India
                                                                  Kingdom

1. Data from MSCI as of 30/Jun/2021. See page 26 for index definitions                                                                                    4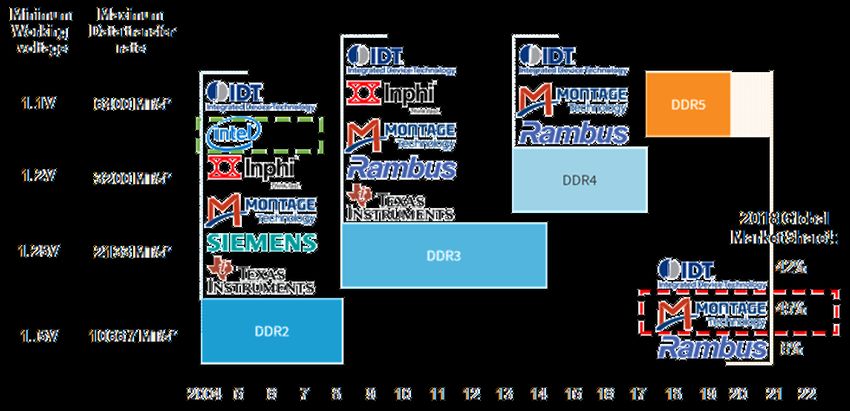
Why China?

Characteristics of Chinese listing venues

                                                                                    3M Average Daily                                             Freely accessible to
                                                    No. of Listed                                                        Free-float Market Cap
                Market                                                                  Volume                                                    foreign investors*
                                                    Companies                                                                    ($mm)
                                                                                        ($mm)                                                            (%)

 Mainland China                                          5,111                              82,828                               4,437,535              80%

   Shanghai (Main)                                       2,032                              33,079                               2,175,991              80%

   Shanghai (STAR Market)                                 229                               19,938                                105,792               12%

   Shenzhen                                              2,850                              29,811                               2,155,752              80%

   Offshore China                                        1,324                              90,770                               4,750,018              100%

   US                                                     427                               72,400                               1,908,353              100%

   Hong Kong                                              897                               18,370                               2,841,665              100%

   Total                                                 6,435                             173,598                               9,187,553               —

Data from Bloomberg as of 23/Feb/2021. See pages 26 for index definitions.
*For mainland China A-shares the percentage of securities by market cap included in Northbound Hong Kong Stock Connect Program

                                                                                                                                                                        5
Why China?

The STAR Market has been called the ‘Nasdaq of China’, and may follow a similar growth trajectory

                                   Nasdaq Composite Index’s First 20 Years Performance History
                          50,000

                          45,000                                                                                                                        In 1971 Nasdaq had a market cap
                          40,000                                                                                                                        of $140 billion, while the NYSE had
                                                                                                                                                        a market cap of $1 trillion.
                          35,000
 Growth of 10,000 units

                          30,000
                                                                                                                                                        In 2021, Nasdaq has a market cap
                          25,000                                                                                                                        of $19 trillion and the NYSE has a
                          20,000
                                                                                                                                                        market cap of $26 trillion.

                          15,000
                                                                                                                                                        Currently, the STAR Market looks
                          10,000
                                                                                                                                                        like the Nasdaq in 1971, with a
                           5,000                                                                                                                        market cap of $100 billion, while
                                                                                                                                                        the SSE* has a market cap of $2.2
                               0
                                                                                                                                                        trillion.
                              Ju /7 2

                             Ju /7 5

                              Ju /7 9

                             Ju /8 2

                              Ju /8 6

                             Ju /8 9
                             N r/75

                             N r/82

                             N r/89
                             Ja /7 6

                             M /7 7

                             Ja /8 3

                             M /8 4

                             Ja /9 0
                             M t/71

                             M t/78

                             M t/85
                             Se /74
                             Ap /74

                             Au /77

                             Se /81
                             Ap /81

                             Au /84

                             Se /88
                             Ap /88

                                  91
                             Oc /71

                             Oc /78

                             Oc /85
                             Fe l/73

                             Fe l/80

                             Fe l/87
                             De /72

                             De /79

                             De /86

                                n/
                                n

                                n

                                n
                               ar

                               ar

                               ar
                               ov

                               ov

                               ov
                               ay

                                g

                               ay

                                g

                               ay
                                n

                                n
                                c

                                c

                                c
                                b
                                p

                                b
                                p

                                b
                                p
                           M

Data from Bloomberg, retrieved 24/Feb/2021. See slide 26 for index definitions. Market cap figures are approximations. Index returns are for illustrative purposes only and do not represent actual fund
performance. Indexes are unmanaged and one cannot invest directly in an index. Index returns do not reflect fees or other costs associated with investing. Past performance does not guarantee future results.
*SSE: Shanghai Stock Exchange (SSE) Composite Index
                                                                                                                                                                                                                 6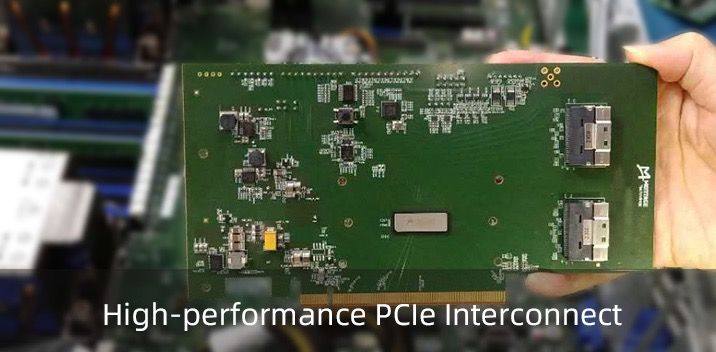
STAR Market

The STAR Market primarily supports high-tech infrastructure and strategic emerging industries
Companies included in the STAR Market seek to integrate several key themes within their core business.

                                                                                                      Key Themes

                                  Emerging Industries                                                   Artificial
                                                                                                      Intelligence

                                                                                                                          High-tech
                                                                                     Internet
                                                                                                                         Manufacturing
                                             High-end
         New Generation IT                  Equipment                New Materials

                                                                                           Big Data                    Cloud
                                                                                                                     Computing
                                       Energy Conservation
                                        & Environmental
              New Energy                   Protection                Biomedicine

                                                                                                                                           7
Data from Star Market, “Overview”, star.sse.cn, as of 26/May/2021.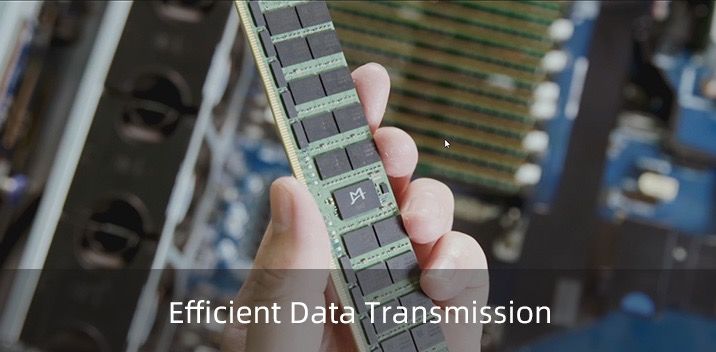
STAR Market
The STAR Market has been a top location for new listings even amid recent market uncertainty
• The STAR Market has quickly gained
recognition as one of the world’s top IPO
STAR Market IPO Count Since Launch
venues. 1 9
• Listings on the STAR Market accounted for 8
47% of capital raised across China’s 7
IPO count by batch
Mainland A-Share market in 2020.2 6
5
• In light of recent US legislation concerning
4
the potential delisting of US-listed Chinese
3
stocks, we believe some Chinese companies
2
might show a stronger preference to list on
1
domestic markets.
0
Se 1 9
De /1 9
Ja 1 9
Ju 0
Se 2 0
De /2 0
Ja 2 0
N 19
N 20
Oc 19
M /20
M /20
Oc 20
M /21
Fe 20
Fe 21
Ap 20
1
Au 19
Au 20
Ju 20
/2
2
t/
t/
p/
p/
n/
n/
/
l/
l/
g/
n/
c/
g/
/
c/
r
ar
ar
ov
b
ov
b
ay
Ju
Data from Wind, retrieved 31/Mar/2021.
1. Bloomberg, “China’s Star Board Among World’s Top Three IPO Venues”, 3/Aug/2020.
2. The Asset, “A bumper IPO year despite Covid-19”, 14/Dec/2020.
8
STAR Market

The STAR Market’s unique listing rules and notable success since launching have quickly made the exchange an
attractive option for China’s leading science and technology unicorns

                                                                              STAR Market Quick Facts

                                President Xi Jinping introduced the concept of
                                the STAR Market to create a new funding source                                            In just over a year, the STAR Market facilitated
                                for China’s rising science and technology                                                 200 companies to raise $44 billion.2
                                companies.1

                                Jun.13, 2019: China launched the SSE STAR                                                 STAR Market listings accounted for 47% of
                                Market as a new science and technology board.                                             capital raised across China’s Mainland A-
                                Trading of the first 25 companies started on July                                         Share market in 2020.3
                                22.1

                                The SSE STAR 50 Index methodology is designed                                               For the first time, Mainland investors have
                                to fast-track eligibility for China’s largest                                               access to some of China’s leading, high quality
                                unicorns.                                                                                   tech companies.

1. SCMP, “Shanghai Stock Exchange to debut Nasdaq-style market for tech stocks on July 22, three weeks ahead of schedule”, 5/Jul/ 2019, retrieved 30/Jun/2021.
2. CNBC, “China’s experimental stock board gains 200th IPO just over a year after launching”, 6/Dec/2020.
3. The Asset, “A bumper IPO year despite Covid-19”, 14/Dec/2020.                                                                                                                  9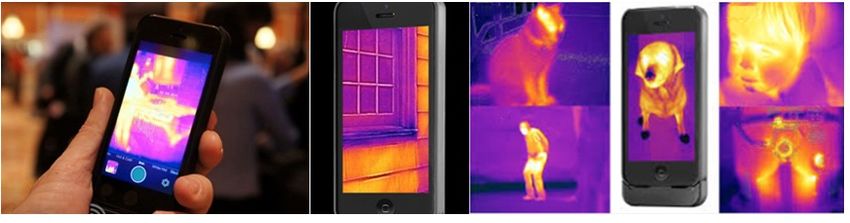
STAR Market

The STAR Market offers more inclusive standards compared to other markets in China
Historically, early-stage Chinese startups were forced to list abroad due to stringent listing requirements in China. The STAR
market allows such companies to list on a local exchange.

                                                              Mainland Chinese Exchange Offering and Listing Comparison
                                                                                   Shanghai / Shenzen                                                             STAR Market
                                                                                                                                       Growing science and technology innovation
 Targeted companies                                         Large mature companies
                                                                                                                                       companies
                                                            Net assets, cash flow, revenue, and net income                             Emphasize market value and revenue instead of net
                                                            requirements                                                               income requirements
                                                            In the last 3 fiscal years, the company has made
                                                            continuous profits and accumulated net profits in
                               Profit                       excess of 30 million CNY.
                                                            Or, the accumulated total operating revenue exceeds                        Do not have to be profitable or have accumulated
 Finance &                                                  300 million CNY.                                                           deficits to list.
 Accounting
                                                            The cumulative net cash flow from operating activities                     Based on the estimated market value, revenue, net
                               Cash Flow                    in the last three fiscal years exceeds 50 million CNY.                     income, R&D investment, cash flow and other factors
                                                            Intangible assets account for no more than 20% of net                      Must meet 1 of the 5 differentiated listing standards.
                                                            assets at the end of the latest period.
                               Net Assets
                                                            There is no undistributed deficit at the end of the latest
                                                            period.

                                                                                                                                                                                                   10
 Data from Star Market, “Offering and Listing Standards Comparison”, star.sse.cn, as of 26/May/2021. See slide 26 for definitions of the equity markets and terms included in the table.
STAR Market
By meeting one of the five differentiated listing standards, applicants are eligible for listing on the STAR Market
The 5 Core Listing Standards of the STAR Market
Applicants must meet one of the five listing standards
Operating
• Unlike other Mainland Chinese Listing
Standard
Profitability R&D
Cash Flow
Revenue Special
boards, companies do not have to be
profitable to list.
• This set of standards mirrors that of Market
Valuation
CNY 1 billion
CNY 1.5
CNY 2 billion CNY 3 billion CNY 4 billion
billion
its US peer, the NASDAQ Global
Market. Companies need
approval by state
• Delisting criteria are primarily based Operating CNY100 CNY 200 CNY 300 CNY 300 dept. and meet
Revenue million million million million requirements
on these standards. (in the last Yr.) such as huge
market potential
& technical
Net Profit R&D Expense Operating advantage
to Operating Cash Flow
Requirement Income
for Standard
CNY 50 15% on CNY 100
million average in the million
past 3 years
Equal Ocean and STAR Market, “Offering Requirement”, star.sse.cn, as of 26/May/2021. 11STAR Market
China’s unicorn pipeline reveals potential future IPOs
• A unicorn company, or unicorn startup, is a Top 10 Global Unicorn Ranking1
private company with a valuation over $1 billion.1 Market Val.
Rank Company Industry Headquarters
($B)
• Currently, two of the world's five largest
1 ByteDance 140 Social Media China
unicorns are Chinese companies. 1
2 Ant Group 108* FinTech China
• In 2020, Beijing was the leading city for new
unicorns worldwide, and five Chinese cities were 3 Stripe 95 FinTech USA
among the top 10 global ranking for cities with 4 SpaceX 74 Aerospace USA
the most unicorns.2
5 Klarna 46 Fintech Sweden
• For Chinese companies looking to go public, the
6 Instacart 39 Delivery USA
STAR Market may be a preferred location
because of its accelerated IPO approval process 7 Nubank 30 Fintech Brazil
as well as the potential advantages offered by
8 Epic Games 29 Gaming USA
domestic listings.
9 Databricks 28 Data analytics USA
10 Rivian 28 Electric Vehicle USA
1. Data from CB Insights, retrieved 30/Jun/2021. *Bloomberg Intelligence, “Ant Group’s Valuation Seen Dropping to $108 Billion on Crackdown”, Jan. 21, 2021, retrieved 30/Jun/2021.
2. Trading Platforms, “Beijing Has Most Unicorn Companies In the World With 93 – An Overview of China’s Unicorns in 2020”, last updated Mar. 2021, retrieved 30/Jun/2021. 12STAR 50 Index
STAR 50 Index methodology is designed to expedite eligibility for China’s largest unicorns
Eligibility Timeline for STAR 50 Index Inclusion:
Eligible for inclusion after…
1 Month
for securities among top 3 by average daily The Index
market value since initial listing prioritizes the
largest IPOs for
IPO debuts on
expedited
the STAR Market inclusion
3 Months
for securities among top 5 by average daily
market value since initial listing
6-12 Months for remaining securities
that are not among top ranking for average
daily market value.
CSI Securities Index Co. Ltd,, “Methodology of SSE Science and Technology Innovation Board 50 Index,“ updated Dec 2020.
13KSTR
The Index consists primarily of “new economy” sectors, with a combined weight of 75% in information technology
and healthcare
KSTR Top 10 Industries
KSTR Sector Breakdown
Materials
Consumer 6.82% Technology
Discretionary
6.91% Hardware,
Storage &
Biotechnology Peripherals
7.86% 5.91%
Industrials Electronic Equipment, Instruments &
10.84%
Components
20.05% Household
Information Appliances
Health Care Technology 4.00%
19.06% 56.36% Pharmaceuticals
5.10%
Health Care
Supplies
3.54%
Semiconductors Software Specialty Chemicals Health Care Equipment
24.84% 15.24% 4.85% 2.56%
Data from Bloomberg as 30/Jun/2021.
14STAR Market
Chinese government policies aim to make China more self-sufficient in chip manufacturing
• China established a new national semiconductor fund China's semiconductor annual trade2
worth $28.9 billion in 2019, aimed at closing the 350
technology gap with the US.1
300
• As stated in the “Made in China 2025” initiative, China
aims to produce 70% of the semiconductors used 250
domestically by 2025 and have complete import
(US$ billions)
200
substitution by 2030.2
150
• The Chinese government has instated policies to
further promote the semiconductor industry, such as 100
providing tax exemptions for the next 10 years. 2
50
0
2010 2011 2012 2013 2014 2015 2016 2017 2020 2030
Imports Exports Export targets
1. WSJ, “China Sets Up New $29 Billion Semiconductor Fund”, 25/Oct/2019, retrieved 30/Jun/2021.
2. Source: SCMP,” ‘Made in China 2025’: How Beijing is boosting its semiconductor industry”, September 25/Sep/2018, retrieved 30/Jun/2021. Data from China Semiconductor Industry Association. 15STAR Market
Substantial R&D investment shows STAR Market companies’ commitment to innovation and development
• R&D investment for the 50 constituent companies included
in the STAR 50 Index at the time of launch was, on Average R&D percent of revenue across
average, 13% of operating income, compared to 5.6% for Chinese markets
10% 9.4%
its peers on the main board.1,2 9%
• These first 50 constituents’ average operating income 8%
grew by 13.4% year-over-year (YoY), and net profit 7%
6%
increased by 28.8% YoY in 2019. Four of these companies
4.9%
5%
saw their operating income grow by over 50%.1
3.9%
4%
• In 2019, companies on the STAR Market were granted
3% 2.5%
more than 2,500 patents, 1,100 of which were invention 2%
1.3%
patents.3 1%
• Additionally, 13 companies have won China’s National 0%
Shanghai Shenzhen SME Board GEM Board STAR Market
Science and Technology Progress Award.2 Exchange Exchange
Source: ICBC as of 31/Mar/2021, retrieved 30/Jun/2021. See slide 26 for term definitions.
1. Shanghai Stock Exchange, “Q&A on Launching SSE STAR Market 50 Constituent Index”, 19/Jun/ 2020, retrieved 30/Jun/2021.
2. SCMP, “Xi Jinping’s trillion-yuan baby, the Star Market, is poised for the next spurt of growth”, 25/Jul/2020, retrieved 30/Jun/2021.
3. Shanghai Stock Exchange, “Bright spots: all the company's annual reports on the Sci-tech Innovation Board are disclosed”, 30/Apr/2020, retrieved 30/Jun/2021. 16KSTR
KSTR’s top 10 constituents have shown high R&D investment and strong revenue growth
KSTR Companies U.S. Companies
Primary Business U.S. Comparable
Top 10 KSTR Holdings Weight % 1 Year Average 1 Year Average R&D
R&D Expenditure Business
Revenue Growth % of Sales Revenue Expenditure %
Rate Growth Rate of Sales
Beijing Kingsoft Office Software 10% Application Software 43% 31% Microsoft 6% 7%
Technology Hardware,
Shenzhen Transsion Holding 7% 49% 3% Apple 14% 13%
Storage
Advanced Micro-fabrication Equip Inc 6% Semiconductors 17% 28% Cree 8% 17%
Beijing Roborock Technology 5% Household Durables 8% 6% Irobot Corp. 18% 11%
Ningbo Ronbay 5% Electrical Equipment -9% 4% General Electric 1% 11%
Montage Technology 4% Semiconductors 5% 16% Intel -9% 5%
Cansino Biologics 4% Pharmaceuticals 712% -- Moderna -3% 25%
China Resources Microelectronics 3% Semiconductors 21% 8% Texas Instruments -8% 2%
Amlogic Shanghai Inc 3% Semiconductors 16% 21% Qualcomm -16% 3%
Electronic Equipment,
Raytron Technology Co Ltd 3% 128% 15% TE Connectivity -9% 5%
Instruments
Total: 50% Average: 99% Average: 15% Average: 0% Average: 10%
Data from Bloomberg as of 30/Jun/2021. Holdings subject to change. Carefully consider the Funds' investment objectives, risk factors, charges and expenses before investing. This and additional information can be found in the
Funds prospectus, supplement prospectus and KIID, which may be obtained at www.kraneshares.eu
Executive Order 13959, as amended on June 3, 2021 ("Executive Order 14032") was issued, prohibiting transactions by U.S. persons in certain Chinese issuers’ securities (“Subject Securities”). KSTR will fully comply with Executive
Order 14032. While the underlying index for KSTR (the SSE Science and Technology Innovation Board 50 Index) includes Subject Securities, the KSTR portfolio has been optimized and will not include any Subject Securities. 17KSTR
Companies listed on the STAR Market help advance China’s national strategy development goals
National New Infrastructure Development Initiative Goals1
Theme Goals Example KSTR Holdings
Ensure nationwide 5G coverage by 2025, with plans to have 5 million 5G base
5G
stations across the country by 2025
KSTR weight: 3.3% KSTR weight: 1.4%
Artificial
Intelligence
Establish 20 AI innovative trial zones nationwide by 2023
KSTR weight: 4.0% KSTR weight: 1.5%
Construct a range of data centers (including big data centers, super data centers
Big Data Centers
and edge-computing data centers) by 2025
KSTR weight: 1.7% KSTR weight: 1.2%
Build 3-5 world class industrial Internet of Things (IoT) platforms by 2025 to
Industrial Internet
improve digital connectivity for at least a million enterprises
KSTR weight: 2.0% KSTR weight: 1.0%
Intercity High-
Extended the railway network by more than 4,000 km in 2020, with 2,000 km
speed Rails & Rail
Transportation designated for high-speed rails
KSTR weight: 3.4%
Electric Vehicle
Build an additional 12,000 electric vehicle charging stations in 2020 and have over
Charging &
Batteries 36,000 in total by 2025
KSTR weight: 2.2% KSTR weight: 4.6%
1. Nikkei Asian Review, CCID Think Tank, China Briefing, retrieved 31/Dec/2020. Fund holding weights as of 30/Jun/2021, excluding cash. 18Weight %
Primary Business: US Comparable:
(30/Jun/2021):
Software Microsoft
10%
Beijing Kingsoft Office Software (688111): China’s own Microsoft
2C: Large Addressable Market: MAU Breakdown as 2G/2B Client Base: China’s Champion for Software Localization
Business Overview
December 31, 2020 (m users)
ü Only worthy contender to Microsoft in the local office 2G/2B Clients Penetration
China’s population 2019: 1.4 Bn
software and service space in China 1400 Clients include over 30 provincial governments and
Government
ü Uniquely positioned to benefit from the cloud/SaaS 1200 400+ municipal governments
revolution as Microsoft continues to have difficulty 1000
800 Office software users in China as of 2018: 655m Serving 69 out of 120 (58%) Chinese enterprises in
obtaining a cloud license in China Fortune 500
600 Fortune 500
ü Major beneficiary to the ongoing software and technology 400 282
185 State-owned
localization movement in China, with battle-tested 200 10 Serving 82 out of 96 (85%) central SOEs
Enterprises
product suites highly sought-after by companies in China 0
WPS PC WPS Mobile Dictionary Financial
Major Products Major vendor for all 5 largest banks in China
Institutions
2C: WPS Fee-Paying MAU by Year-End (m users)
CAGR:124% 19.62 Microsoft 365:Transformation from traditional
license sales to cloud-based SaaS
12.92 40 50
35 45
4.81 40
2.71 30
35
Million people
0.78
25 30
$ billion
30 Years of History 2016 2017 2018 2019 2020 20 25
15 20
WPS 1.0 was launched, and Major success with WPS 15
Membership- SaaS
10
achieved >90% market 2005. Free versions Mobile WPS Cloud-based Kingsoft 10
Share in China launched based KSO was transformation Doc launched 5 5
offered to customers
launched 0 0
5
5
5
6
6
6
6
7
7
7
7
8
8
8
8
9
9
20 9
19
1989 2001 2002 2007 2011 2012 2013 2014 2015 2017 2018 2019
Q3 201
Q4 201
Q1 201
Q2 201
Q3 201
Q4 201
Q1 201
Q2 201
Q3 201
Q4 201
Q1 201
Q2 201
Q3 201
Q4 201
Q1 201
Q2 201
Q3 201
Q4 201
Q2
Chinese government launched the Office 365 Consumer Subscribers (Mn ppl, LHS)
Legitimate Software Initiative, WPS Launched Cross platform Enter 2B WPS MAU reached IPO
English version version launched business 100mn for PC and mobile Annualized commercial cloud revenue run rate ($Bn, RHS)
received first order from the government
sector
Source: Company data. NBS. CCW Research. Morgan Stanley Research. ICBCCSI. Retrieved 30/Jun/2021. This is not an offer to buy or sell, or a solicitation or incitement of offer to buy or sell, any particular security, strategy,
investment product or services nor does this constitute investment advice or recommendation. There is no assurance that any securities discussed herein will remain in the portfolio at the time you receive this document. See
end of presentation for term definitions. 19Weight %
Primary Business: US Comparable:
(30/Jun/2021):
Tech Hardware, Storage Apple
7%
Shenzhen Transsion Holdings (688036): Smartphones for Africa
Business Overview Product Offerings
Transsion is one of largest Mobile devices: TECNO is a major global player with presence in more
providers of smart devices and than 60 countries and regions across the world, and it is also one of the
mobile services for consumers in top three mobile phone brands in Africa.
emerging markets (smartphone TECNO Camon17P
market share: #1 in Africa (>40%), Digital Accessories: Launched in 2014, oraimo is a smart accessories
#1 in Pakistan, #1 in Bangladesh, brand specialized in designing, manufacturing and retailing consumer
#6 in India, #7 globally1). electronics products. oraimo is available in over 30 countries and
regions across Africa and Asia.
The company is best known for its
high-quality multi-brand smart Home Appliances: Syinix -- Launched in 2015, Syinix is a professional
devices. Mobile phones are its core
home appliance brand. Syinix is guided by the brand philosophy of
products, while it also offers “Starting Smart Life”. The brand is committed to providing consumers
mobile Internet services based on a with high-quality home appliances that will improve their home life and
self-developed operating system.
comfort. The extensive product portfolio covers many aspects of family
TRANSSION's brand portfolio life – smart TVs, air conditioners, refrigerators, washing machines,
comprises leading mobile phone
microwave ovens, and electric kettles.
brands in emerging markets,
including TECNO, itel and Infinix, Smartphone shipment in EM (ex-China), million units
as well as Carlcare for after-sales 446
389
services, oraimo for smart 306
accessories, and Syinix for home
appliances.
51
1. Minsheng Securities, latest estimates as of FYE2020. 2011 2015 2020 2022F
Source: IDC, ICBCCSI. Retrieved 30/Jun/2021. This is not an offer to buy or sell, or a solicitation or incitement of offer to buy or sell, any particular security, strategy, investment product
or services nor does this constitute investment advice or recommendation. There is no assurance that any securities discussed herein will remain in the portfolio at the time you
receive this document. 20
20Weight %
Primary Business: US Comparable:
(30/Jun/2021):
Household Durables iRobot Corp.
5%
Beijing Roborock Technology (688169): Simple Products, Easier Lives
Business Overview Product Offerings Competitive Advantage
Founded in July 2014, Roborocket is a strong competitor to iRobot and Ecovacs Robotics globally.
ü Cutting-edge robotic algorithms/data/hardware
Beijing Roborock Empowered by AI binocular vision and structured light obstacle avoidance expertise
Technology specializes in features, Roborock’s latest flagship products marked a major step in the AI-
the research, development, oriented evolution of robot vacuums, pushing Roborock to the forefront of high-
ü Cloud platform which enabled data sharing and
and production of wide tech development in the field. The company is selling its robot vacuum in the US, coordinated operation among different vacuums
range of robot vacuums Europe, and Southeast Asia mainly and competes directly with Ecovacs in
ü Company benefited from Xiaomi’s e-commerce
and cordless stock domestic China. The development of a global distribution network has laid the
ecosystem and branding effect when Xiaomi
vacuums. groundwork for further market share gain in the US and Europe from mature
became its major investor in 2014
brands.
Roborock’s S7 robot vacuum is the winner of 17 Best of CES 2021 Awards.
R&D Makes Up Majority of
Roborocket Technology: Total Headcount (as of FYE2020) One of the few players in China with LDS SLAM self-
Revenue Growth navigation technology
Procurement, Finance, 19,
20, 3% 3%
CAGR:123% 4,530
4,205 Production,
29, 4%
3,051
Admin, 46,
7%
R&D, 382,
1,119 56%
183
Sales, 188,
27%
2016 2017 2018 2019 2020
Source: Company Financial Report, XLAB, ICBCCSI. Retrieved 30/Jun/2021. This is not an offer to buy or sell, or a solicitation or incitement of offer to buy or sell, any particular security, strategy, investment product or services
nor does this constitute investment advice or recommendation. There is no assurance that any securities discussed herein will remain in the portfolio at the time you receive this document.
21Weight %
Primary Business: US Comparable:
(30/Jun/2021):
Semiconductors Intel
4%
Montage Technology (688008): Leader in a Duopoly Market
Business Overview Major Products
ü Montage is the only Chinese supplier of DRAM
interfaces with almost 50% of market share
globally1
ü Major beneficiary to China’s push for semi
localization, cloud buildup, and datacenter
upgrades
ü Large and growing TAM as demand for high
Server DRAM Interfaces Jintide Platform PCIe Retimer
resolution video streaming, gaming and public
cloud adoption continue to grow globally
1.Everbright Securities. Intel had dropped out from the DDR RAM race, and
became a major backer of Montage
By 2025, more than 49% of data globally will be
stored on the cloud
Consumer %
Enterprise
%
Public Cloud %
Source: Company Website, IDC, EqualOcean, ICBCCSI. Retrieved 30/Jun/2021. This is not an offer to buy or sell, or a solicitation or incitement of offer to buy or sell, any particular security, strategy, investment product or
services nor does this constitute investment advice or recommendation. There is no assurance that any securities discussed herein will remain in the portfolio at the time you receive this document. 22Weight %
Primary Business: US Comparable:
(30/Jun/2021):
Electronic Equipment TE Connectivity
3%
Raytron Technology (688002): Leading Manufacturer of Uncooled IRFPA
Business Overview Product Offerings Infrared imaging has extensive application prospect in
security monitoring, automotive electronics, intelligent
Raytron Technology is a leading Raytron provides driving assistant, low-cost infrared products, vacuum
IC design company that leads household and consumer electronics field. In the field of
packaging, MEMS design services and ASIC Design services to automotive electronics, infrared imaging can also be
the industry of infrared imaging downstream clients.
and the development of MEMS used for automotive air conditioning adjustment and
person detection, besides the driving assistant
sensor technology, with Raytron’s products have been applied in various fields, such as night application. In smart home application, infrared imaging
completely independent vision, thermal temperature measurement, intelligent surveillance,
intellectual property rights. can be used for air conditioning temperature
UAV load, automatic driving, IoT, AI, and machine vision. measurement and night security monitoring.
Raytron constructs and integrates the industrial chain of
Raytron designs and optoelectronics, represented by infrared imaging.
manufactures IC, thermal
imaging detector, and MEMS
sensor, providing global Driving Assistant MEMS Design Service Low-Cost Infrared
customers with excellent
uncooled thermal imaging
MEMS sensors, thermal
imaging detectors, ASIC chips,
thermal imaging and
temperature measurement
modules, thermal cameras,
laser products, and
optoelectronic systems.
Source: Company Website, ICBCCSI. Retrieved 30/Jun/2021. This is not an offer to buy or sell, or a solicitation or incitement of offer to buy or sell, any particular security, strategy, investment product or services nor does this
constitute investment advice or recommendation. There is no assurance that any securities discussed herein will remain in the portfolio at the time you receive this document.
23STAR 50 Index
STAR 50 companies exhibit low correlation to other global markets
Index Correlation to the STAR 50 Index
Nasdaq
MSCI ACWI MSCI EAFE MSCI EM MSCI USA MSCI China MSCI Frontier Composite STAR 50
MSCI ACWI 1
MSCI EAFE 0.91 1
MSCI EM 0.85 0.77 1
MSCI USA 0.97 0.80 0.76 1
MSCI China 0.66 0.52 0.88 0.61 1
MSCI Frontier 0.63 0.57 0.64 0.59 0.50 1
Nasdaq
Composite 0.87 0.65 0.75 0.93 0.71 0.56 1
STAR 50 0.17 0.04 0.39 0.17 0.47 0.13 0.25 1
• MSCI ACWI Index (ACWI) - All Country World Index • MSCI China Index (China) - Chinese companies listed in Hong Kong & USA
• MSCI EAFE Index (EAFE) - Europe, Australasia and Far East • MSCI Frontier Markets Index (Frontier) - Frontier Markets
• MSCI Emerging Markets Index (EM) - Emerging Markets • NASDAQ Composite Index
• MSCI USA Index (USA) – United States of America • STAR 50 Index – companies listed on Shanghai’s STAR Market
Source: Table from Bloomberg, weekly correlation from 23 July 2020 to 30 June 2021. See slide 26 for index definitions. Index returns are for illustrative purposes only and do not represent actual Fund performance. Index
returns do not reflect any management fees, transaction costs or expenses. Indexes are unmanaged and one cannot invest directly in an index. 24Fund Details As of 30/Jun/2021 Top Ten Holdings
as of 30/Jun/2021. The Fund’s Ticker %
Listed Exchange LSE
Holdings are Subject to Change.
KraneShares ICBCCS SSE STAR Market 50 Index SEDOL BMBNL20
BEIJING KINGSO-A 688111 10.16
UCITS ETF (Ticker: KSTR) ISIN (Class USD Shares) IE00BKPJY434
KSTR seeks to track the performance of the Shanghai Stock Exchange Total Annual Fund Operating SHENZHEN TRANS-A 688036 6.98
0.82%
Expense
(SSE) Science and Technology Innovation Board 50 Index.
ADVANCED MICRO-A 688012 6.22
The Index is comprised of the 50 largest companies listed on the SSE Inception Date 26/May/2021
Science and Technology Innovation Board (STAR Market) as determined Distribution Frequency Accumulating BEIJING ROBORO-A 688169 4.74
by market capitalization and liquidity.
SSE Science and Technology NINGBO RONBAY -A 688005 4.56
Index Name
Innovation Board 50 Index
MONTAGE TECHNO-A 688008 3.96
UK Fund Reporting Status Reporting Fund
CANSINO BIOLOGICS INC-A 688185 3.75
Investment Structure UCITS
CHINA RESOURCE-A 688396 3.37
Base Currency USD AMLOGIC SHANGHAI INC-A 688099 3.23
Number of Holdings (ex Cash) 51
RAYTRON TECHNO-A 688002 3.12
KSTR Performance History as of 30/Jun/2021
Cumulative % Average Annualized %
1 Mo 3 Mo 6 Mo Since Inception 1 Yr 3 Yr Since Inception
Fund NAV 14.18% – – 15.28% – – 15.28%
Index 8.50% 29.30% 15.60% 15.10% – – 15.10%
The performance data quoted represents past performance. Past performance does not guarantee future results. The investment return and principal value of an investment will fluctuate so that an
investor's shares, when sold or redeemed, may be worth more or less than their original cost and current performance may be lower or higher than the performance quoted. For performance data current
to the most recent month end, please visit www.kraneshares.eu.
Index returns are for illustrative purposes only. Index performance returns do not reflect any management fees, transaction costs or expenses. Indexes are unmanaged and one cannot invest directly in an
index.
High short term performance for the fund is unusual and investors should not expect such performance to be continued over the long term.
25Index Definitions:
Shanghai Stock Exchange (SSE) Science and Technology Innovation Board 50 Index (STAR 50 Index): is comprised of the 50 largest securities listed on SSE Science and Technology Innovation Board (STAR Market) as
determined by highest market capitalization and liquidity. Constituents are weighted by a float-adjusted market capitalization with a 10% weight limit for a single constituent, and the top five constituents total weighting
cannot be more than 40%. The index is adjusted and rebalanced quarterly and the adjustment will be effective end of next trading day.
MSCI China A (Net Return USD) Index: captures large and mid-cap representation across China securities listed on the Shanghai and Shenzhen exchanges. The index covers only those securities that are accessible
through "Stock Connect". The index is designed for international investors and is calculated using China A Stock Connect listings based on the offshore RMB exchange rate (CNH).
MSCI China USD Net Index: captures large and mid cap representation across China H shares, B shares, Red chips and P chips.
MSCI EAFE USD Gross Index: is an equity index which captures large and mid cap representation across Developed Markets countries around the world, excluding the US and Canada.
MSCI Emerging Markets USD Net Index: captures large and mid cap representation across 23 Emerging Markets (EM) countries.
MSCI USA USD Net Index: The MSCI USA Index is designed to measure the performance of the large and mid cap segments of the US market.
MSCI Frontier Markets (FM) USD Gross Index: captures large and mid cap representation across 29 Frontier Markets countries. The index was launched on December 18, 2017.
MSCI ACWI Market Cap Weighted USD Net Index: captures large and mid cap representation across 23 Developed Markets (DM) and 23 Emerging Markets (EM) countries.
MSCI ACWI GDP Weighted USD Net Index: captures large and mid cap representation across 23 Developed Markets (DM) and 23 Emerging Markets (EM) countries, weighted by GDP.
MSCI China All Shares Index: captures large and mid-cap representation across China A-shares, B-shares, H-shares, Red-chips, P-chips and foreign listings (e.g. ADRs). The index aims to reflect the opportunity set of
China share classes listed in Hong Kong, Shanghai, Shenzhen and outside of China.
CSI Overseas China Internet Index: The CSI Overseas China Internet Index selects overseas listed Chinese Internet companies as the index constituents; the index is weighted by free float market cap. The index can
measure the overall performance of overseas listed Chinese Internet companies. The Index is within the scope of the IOSCO Assurance Report as at 30 September 2018. The index was launched on September 20, 2011.
Shanghai Stock Exchange (SSE) Composite Index is composed of all eligible stocks and CDRs listed on Shanghai Stock Exchange. This index is designed to reflect to overall market performance of companies listed on
Shanghai Stock Exchange.
Shenzhen Stock Exchange Composite Index is an actual market-cap weighted index (no free float factor) that tracks the stock performance of all the A-share and B-share listed on Shenzhen Stock Exchange. The index
was developed on April 3, 1991 with a base price of 100. Index trade volume on Q is scaled down by a factor of 1000. This is a total return Index.
Hang Seng China Enterprises Index: serves as a benchmark that reflects the overall performance of Mainland securities listed in Hong Kong.
Nasdaq Composite Index: The Nasdaq Composite Index measures all Nasdaq domestic and international based common type stocks listed on The Nasdaq Stock Market. The index was launched on February 1, 1971.
Terms:
ChiNext Board: subsidiary of the Shenzhen Stock Exchange, designed for growing innovative companies. The first batch of companies began trading on October 30, 2009.
SME Board: subsidiary of the Shenzhen Stock Exchange, designed for small and medium sized enterprises. The first batch of companies began trading in May 2005.
Main Board: refers to the Shanghai and Shenzhen Stock Exchanges, designed for larger, more mature companies.
GEM Board: short for the Growth Enterprise Market, a subsidiary of the Hong Kong Stock Exchange (HKSE) for growth companies that do not meet the profitability and/ or track record requirements of the HKSE. The first
batch of companies began trading in 1999.
R&D: is short for Research and Development, which refers to activities that a corporation or government entity undertakes to develop new products or services and improve upon existing ones.
CAGR: stands for compound annual growth rate. It is the rate of return required for an investment to grow from its beginning balance to its ending balance, under the assumption that profits were reinvested at the end of
each year of the investment's life span.
26Important Notes:
Carefully consider the Funds’ investment objectives, risk factors, charges and expenses before investing. This and additional information can be found in the Funds‘ full and summary prospectus, which
may be obtained by visiting www.kraneshares.eu. Read the prospectus carefully before investing.
Risk Disclosures:
UCITS shares are not redeemable with the issuing fund other than in large Creation Unit aggregations. Instead, investors must buy or sell UCITS shares in the secondary market with the assistance of a
stockbroker. In doing so, the investor may incur brokerage commissions and may pay more than net asset value (NAV) when buying and receive less than net asset value when selling. The Net Asset Value per
share is calculated in accordance with the “Determination of Net Asset Value” section of the Prospectus, using the official closing price published by the relevant exchange. Shares are bought and sold at market
price which may or may not be consistent with NAV.
Investing involves risk, including possible loss of principal. There can be no assurance that a Fund will achieve its stated objectives. The Funds are subject to political, social or economic instability within China
which may cause decline in value. Fluctuations in currency of foreign countries may have an adverse effect to domestic currency values. Emerging markets involve heightened risk related to the same factors as
well as increase volatility and lower trading volume. .
The Fund may invest in Initial Public Offerings (IPOs). Securities issued in IPOs have no trading history, and information about the companies may be available for very limited periods. In addition, the prices of
securities sold in IPOs may be highly volatile. In addition, as the Fund increases in size, the impact of IPOs on the Fund's performance will generally decrease.
This material is for information only and is not, under any circumstances, intended for distribution to the general public. You are accessing information which constitutes a financial promotion under section 21 of
the Financial Services and Markets Act 2000 ("FSMA"). In relation to the United Kingdom, this information is only directed at, and may only be distributed to, persons who are “Investment Professionals” (being
persons having professional experience in matters relating to investments) within the meaning of article 19(5) of the FSMA (Financial Promotion) Order 2005 (the “Financial Promotion Order ”), persons to whom
any of paragraphs (2)(a) to (d) of article 49 (high net worth companies, unincorporated associations etc.) of the financial promotion order apply, or persons to whom distribution may otherwise lawfully be made.
Any investment, and investment activity or controlled activity, to which this information relates is available only to such persons and will be engaged in only with such persons. Persons that do not have
professional experience should not rely or act upon this information unless they are persons to whom any of paragraphs (2)(a) to (d) of article 49 apply to whom distribution of this information may otherwise
lawfully be made.
For additional fund documentation, please visit www.waystone.com or www.kraneshares.eu.
R_KS_EU
27You can also read