CARBON DIOXIDE REMOVAL: PATHWAYS AND POLICY NEEDS
←
→
Page content transcription
If your browser does not render page correctly, please read the page content below
CLIMATE INNOVATION
                                                                    A CLOSER LOOK
                                                                         2050

CARBON DIOXIDE REMOVAL:
PATHWAYS AND POLICY NEEDS

                                                            by

                                                            Mahmoud Abouelnaga
                                                            Center for Climate and Energy Solutions

                                                            May 2021

Achieving net-zero emissions will require large scale change across all sectors of the econ-
omy, and efforts to drive this transition are intensifying. Over the past several years, through
the Climate Innovation 2050 initiative, the Center for Climate and Energy Solutions (C2ES)
has engaged closely with leading companies across diverse sectors to examine challenges
and solutions to decarbonizing the U.S. economy by 2050. As we laid out in Getting to
Zero: A U.S. Climate Agenda, reaching net-zero will require this large-scale change, but it
will also require us to address a number of discrete and urgent challenges. To inform policy-
makers considering these near- and long-term questions, C2ES launched a series of “Closer
Look” briefs to investigate important facets of the decarbonization challenge, focusing on
key technologies, critical policy instruments, and cross-sectoral challenges. These briefs will
explore policy implications and outline key steps needed to reach net-zero by mid-century.

     EXECUTIVE SUMMARY
Carbon dioxide removal (CDR) solutions will likely be          Whether CDR solutions can scale to the levels that
needed to achieve global climate objectives, though         studies suggest are needed to have a significant impact
deployment of CDR is not a substitute for cutting           on climate mitigation depends on numerous factors,
emissions. For large CDR projects to be realized at scale   including: the potential a given technique or technology
by mid-century, an unprecedented level of development       has to remove carbon dioxide from the atmosphere; cost
and deployment must start taking place now. CDR             effectiveness; level of readiness to be deployed; scalability;
solutions include both nature-based approaches              how quickly the carbon sink reaches capacity; perma-
(e.g., afforestation, reforestation, biochar, soil carbon   nence of the carbon removals; and other benefits and
sequestration) and technological and industrial             challenges. Nature-based solutions are largely affordable
approaches (e.g., bioenergy with carbon capture and         and ready now and will be of importance in both the
storage, direct air capture).                               near and long term. Technological solutions may be more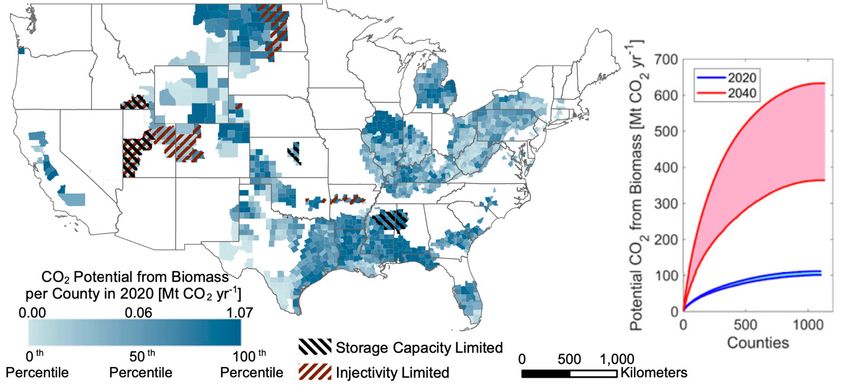
scalable and more permanent but must continue to be                  the technological solutions. Federal infrastructure
developed and deployed. Given the variation in removal               policies should address siting, permitting, and
potential, cost, readiness, and other factors, a portfolio of        investment needs for carbon dioxide pipelines and
CDR solutions will be needed to maximize the chances                 sequestration sites.
of meeting climate targets. Policy can play a vital role in        • Market creation: Policies can create demand for
making such a portfolio a reality.                                   CDR technologies (and other carbon capture and
   Policies that can help remove economic and technolog-             storage technologies) by fostering markets for
ical barriers for large-scale deployment of CDR solutions            utilization of the captured carbon dioxide, such
include the following:                                               as through government procurement policies and
    • Research, development, and demonstration                       building codes.
      funding: Government RD&D funding programs                    • Life cycle analysis and environmental monitoring:
      can make a huge difference in the costs and                    To foster public trust and long-term support for
      deployment levels of technologies. The size of the             CDR, it is critical to establish rigorous and credible
      federal RD&D budget dedicated to CDR should                    life cycle analyses for a variety of removal solutions.
      better reflect its potential economic and climate              Real-world impacts also have to be tracked, which
      benefits.                                                      means monitoring, reporting, and verification will
    • Carbon pricing and standards: Policies that                    be critical.
      institute a robust carbon price or carbon constraint         • Integrity of storage: The integrity of geologic
      could boost CDR’s cost competitiveness. Additional             storage will be another key enabler for sustained
      policy mechanisms will also likely be needed to                public support for CDR. Policies are needed to
      accelerate the deployment of CDR technologies,                 ensure secure geologic storage and to reduce
      such as a federal Clean Energy Standard that                   uncertainties related to long-term carbon storage
      permits CDR projects to contribute in limited and              and liability.
      targeted ways to an overall clean energy target.             A continued focus on reducing emissions, paired
    • Infrastructure: The need for supporting                   with policies that can help ensure that CDR solutions
      infrastructure presents a key constraint on the           are available at the scales necessary, will be critical to
      scalability of several CDR approaches, particularly       meeting the global challenge of climate change.

      INTRODUCTION: CARBON DIOXIDE REMOVAL IN A NET-ZERO FUTURE
Given the strong likelihood of continued carbon dioxide         dioxide is almost equivalent to the total U.S. emissions
emissions from hard-to-decarbonize sectors, carbon              of carbon dioxide from 1990 to 2010.2 The National
dioxide removal (CDR) methods will likely be needed             Academy of Sciences, in turn, has estimated that to meet
to produce the “negative emissions” required to achieve         the Paris Agreement goals, 10 gigatons of carbon dioxide
economy-wide carbon neutrality (and then carbon                 will need to be removed globally each year through
negativity). A number of recent studies—including the           2050, with 20 gigatons of carbon dioxide removed each
landmark 2018 Intergovernmental Panel on Climate                year from 2050 to 2100.3 Likewise, the UN Environment
Change (IPCC) special report on global warming of               Programme estimated that CDR needs to be deployed
1.5 degrees C—have emphasized the need for carbon               with a very rapid scale-up to 8 gigatons of carbon dioxide
dioxide removal to reach global climate objectives and          per year by 2050 with a projected cumulative removal of
avoid the most severe consequences of climate change. 1         810 GtCO2 by 2100 (see Figure 1).4
All IPCC mitigation pathways that limit global warming             For large CDR projects to be realized at scale by
to 1.5 degrees C by 2100 with no or limited overshoot           mid-century, an unprecedented level of development
project the use of on the order of 100–1000 gigatons            and deployment must start taking place now. This paper
of carbon dioxide (GtCO2) of CDR by the end of the              focuses on the key categories of potential CDR solutions
century. 100 gigatons, or 100 billion tons, of carbon           that are being or need to be deployed in the near term.

2     Center for Climate and Energy Solutions
These solutions include both nature-based and techno- technologies will need both policy and public
logical approaches. support to reach the needed levels of deployment.
• Nature-based solutions include afforestation, Policies that support CDR technologies can boost
reforestation, biochar, and soil carbon the competitiveness of U.S. industries while creating
sequestration. Some nature-based solutions (namely opportunities for U.S. companies to develop carbon
regenerative farming practices that enhance removal technologies that could be exported across
soil carbon sequestration) are already regularly the globe.
practiced by farmers because of their benefits Other approaches to remove carbon dioxide such as
to soil fertility and productivity. Nature-based enhanced weathering and solutions in marine environ-
solutions can also support resilience efforts in rural ments (e.g., ocean fertilization, coastal management,
communities across the United States. The scale wetlands restoration)—which are still in earlier stages
of deployment, though, is still small compared to of research or are far less commercially viable—are not
their removal potentials. Realizing this potential covered in this paper, though they, too, need greater
will require clear policy support and significant research and policy support.
investment. Characterizing the variety of CDR approaches is
• Technological and industrial approaches include the first step toward developing a fuller understanding
bioenergy with carbon capture and storage of their ramifications and of the policies needed to
(BECCS) and direct air capture (DAC). The scale of advance them. This paper examines and characterizes
the carbon removal challenge in the United States key nature-based and technological CDR solutions as a
and the rest of the world suggests that developing part of a comprehensive U.S. climate strategy to meet the
scalable technological solutions such as BECCS Paris Agreement goals. Whether CDR solutions can scale
and DAC will be essential to reaching sufficient to the levels that studies suggest are needed depends on
levels of carbon dioxide removal. Carbon removal numerous factors. This paper uses several assessment
FIGURE 1. How much carbon removal is needed to meet Paris Agreement goals?
Source: UNEP 2017
Carbon Dioxide Removal: Pathways and Policy Needs 3criteria—including removal potential, economic costs, biological uptake of carbon dioxide by increasing natural
level of readiness, and other benefits and challenges—to “sinks” or improving natural processes and practices.
evaluate the potential role of different CDR technologies Nature-based solutions combine the capture and storage
and techniques in climate change mitigation. This paper processes within the natural carbon cycle. Technological
then concludes with policy recommendations that can solutions, in contrast, utilize separate processes to first
help remove economic and technological barriers for capture the carbon dioxide and then store it in dedicated
large-scale deployment of CDR solutions. geological reservoirs or long-lived materials. Table 1
While this paper explains the potential and the shows different CDR pathways with their removal and
importance of CDR, it cannot be emphasized enough storage techniques.
that deployment of CDR is not a substitute for cutting To assess the role of different CDR approaches in
emissions. Its availability should not justify delaying a comprehensive decarbonization plan, this paper
ongoing decarbonization efforts, which remain an considers their respective potentials and identifies
urgent priority. Transformative changes will be needed barriers for large-scale deployment. In particular,
across the economy and must take place alongside CDR specific criteria applied to the different CDR pathways
to meet long-term climate goals. The scale of the crisis include the following:
requires utilizing every tool available. • Removal potential—How much carbon dioxide a
given technique or technology can remove from
KEY CRITERIA FOR EVALUATING CDR SOLUTIONS the atmosphere is vitally important to addressing
Generally, the process of carbon removal involves climate change. Removal potential is generally
two stages: expressed in megatons of carbon dioxide (or, when
other greenhouse gases are also involved, of carbon
1. Capture of carbon dioxide from the atmosphere.
dioxide equivalents (CO2e)) that could be removed
2. Storage of the captured carbon dioxide in a way
per year, as well as in terms of the overall capacity
that prevents it from being released back into the
(in gigatons) that can be stored by a given date.
atmosphere for an extended period of time.
• Economic costs—The cost-effectiveness of different
While there are different ways to categorize CDR
approaches (i.e., the bang for the buck) is a key
solutions, they can be simply categorized according to
consideration. To be able to compare the costs of
their capture/removal mechanism—i.e., nature-based
different approaches, economic costs are generally
solutions and technological solutions. Nature-based solu-
expressed in terms of dollars per ton of carbon
tions—involving trees, plants, and soils—increase the
dioxide removed.
TABLE 1. Carbon dioxide removal pathways categorized by their removal and storage
techniques
PATHWAY/SOLUTION REMOVAL TECHNIQUE STORAGE MECHANISM
NATURE-BASED
Afforestation/Reforestation Growth of woody biomass Standing forests and long-
lived wood products
Biochar Growth of plant biomass or utilization of agricultural waste for Black carbon
pyrolysis and application of char to soils
Soil carbon sequestration Increase in soil organic carbon content via various land Soil organic carbon
management practices
TECHNOLOGICAL
BECCS Growth of plant biomass to generate energy and capture and store Geological sequestration
the resulting carbon
DAC Chemical reactions employing reversible sorbents to capture carbon Geological sequestration
dioxide from ambient air, followed by storage
4 Center for Climate and Energy SolutionsFIGURE 2. Flow of technology advancement and the associated Technology Readiness Level
(TRL)
Concept Formulation Proof of Lab Lab-scale Pilot plant Demonstration System Commercial
concept prototype plant qualification deployment
TRL1 TRL2 TRL3 TRL4 TRL5 TRL6 TRL7 TRL8 TRL9
Research Development Demonstration Deployment
Feedback Feedback
Source: U.S. National Aeronautics and Space Administration, Technology Readiness Level, October 2012. Accessed July 14, 2020
• Level of readiness—Time is of the essence in it can achieve carbon removals only until its sink or
addressing climate change, so how ready CDR storage location for the captured carbon dioxide is
approaches are to be deployed must be a factor. full. It is helpful to consider how long any given type
The readiness criterion is of particular relevance of CDR project will be providing removal benefits.
to technological solutions, which are, generally • Permanence—Removing carbon dioxide from the
speaking, less widely deployed than some nature- atmosphere is only part of the challenge; it also has
based counterparts. Figure 2 illustrates the system to stay stored/removed from the atmosphere for an
of technology readiness levels (TRLs) commonly extended period of time. The relative permanence
used for technology assessments. of carbon dioxide removals—i.e., how easily
• Scalability—CDR approaches do not just have to removal/storage gains might be reversed—is thus of
be deployed quickly; they also have to be deployed great relevance in evaluating CDR approaches.
at scale in order to remove a sizeable amount of • Other benefits, co-benefits, and challenges—
carbon dioxide. It is therefore important to consider Numerous other impacts and considerations can
how feasible it is for a CDR approach to achieve either enhance the appeal of a particular CDR
wide-scale deployment. approach or hinder its deployment, and these must
• Sink saturation—Once a CDR project is deployed, be taken into account as well.
CDR SOLUTIONS
NATURE-BASED SOLUTIONS AND ENHANCED while reforestation refers to the process of replanting
NATURAL PROCESSES trees in areas where existing forests have been depleted.
As trees and plants grow, they absorb carbon dioxide
from the atmosphere and store it as carbon in living Potential
biomass and soils. Increasing the biological uptake of The removal potential of afforestation and reforestation
carbon dioxide has always been an attractive approach (AR) is massive, though there is a great degree of varia-
to addressing climate change, especially as it offers a tion across studies on AR’s projected removal potential
low-cost solution with a range of co-benefits. in the United States. The variation mainly stems from
the underlying assumptions and methodologies in each
Afforestation and Reforestation study, including the impact that carbon prices might
Afforestation refers to the process of planting trees and have on the deployment of AR. At, for instance, a $50/
forests in areas that historically did not have forests, ton carbon price, studies estimate forest sequestration
Carbon Dioxide Removal: Pathways and Policy Needs 5ranging from about 73 megatons to 200 megatons Permanence
to as much as 800 megatons.5 Most estimates range Trees sequester carbon dioxide in their trunks, roots,
from 80–390 megatons of carbon dioxide equivalent and so forth, and it remains there, even if additional
(MtCO2e) per year (with a carbon price in the range of removals have ceased. Even if a tree is harvested, the
$25–$50 and a 25% increase in forest area by 2050).6 stored carbon remains in the wood or wood product
The removal potentials estimated in studies such until it is burnt or decays.
as these are by no means the same thing as real-world There is always a concern, though, over the degrada-
potential, given a range of other factors and consider- tion or destruction of forests due to natural or human
ations (some of which are described further below) that disturbances. Fires, in particular, can release much of
constrain AR’s potential. Even studies that consider such the carbon that had been stored. The increasing inten-
constraints suggest substantial removal potential.7 sity and frequency of wildfires, as well as forest decay
due to invasive pests, means management of afforested
Cost and reforested areas is essential to retain their carbon
Afforestation and reforestation are low-cost removal solu- capture benefits long-term.
tions, especially when compared to other approaches.
Most cost estimates for AR are in the range of $5-50/ton Benefits and co-benefits
of carbon dioxide.8 AR can have a range of beneficial impacts on the envi-
ronment, depending on management practices and local
Readiness ecosystem conditions. For example, replacing degraded
Thanks to a high level of knowledge and experience in land with forests could enhance biodiversity, improve
their respective practices, afforestation and reforestation soil quality, reduce flooding and erosion, and increase
are already being deployed and are ready for further ecosystem resilience to climate events.
adoption. That means these solutions are primed to help
now, while work continues to deploy more permanent, Challenges
engineered solutions at scale. While AR can have environmental benefits, large-scale
deployment could also pose potential risks to soil and
Scalability water. For example, it is uncertain how large AR conver-
The main limitation on the scalability of afforestation sion rates could affect soil organic carbon, nutrient
and reforestation is competition for land. Simply put, cycling, and water consumption.
not everywhere that could be forested will be forested Furthermore, for a project to provide true carbon
because other competing land uses have value as well, removal benefits, it should be additional to the baseline
and the economic costs and consequences of a change in (i.e., what would have occurred anyway), and this
land use could be significant. For example, land conver- “additionality” presents a key challenge for AR—and,
sion from agriculture to afforestation could affect food indeed, for all nature-based solutions. For an AR project,
production and result in higher costs for agricultural additionality implies that a land use transition to forested
goods.9 land would not have occurred under business-as-usual
practices, but it can be hard for AR projects to demon-
Sink saturation strate this because of the low quality of available data
The removal pace of AR will be relatively slow as trees on historic deforestation. Also, previous practices might
need to grow to their full potential. It takes forests have included rotational considerations (i.e., planting a
approximately 10 years to ramp up to the maximum sequence of different crops in the same field) that can
sequestration rate. As the trees grow and get closer to have removal benefits which makes it harder to estimate
maturity (around 20 to 100 years, depending on the the true GHG benefits of AR projects.
species), their biological uptake of carbon dioxide starts Another challenge facing AR is that tree planting
to slow down. Once trees reach their saturation level in does not necessarily equate to creating a biodiverse
terms of carbon dioxide, they no longer result in net forest. If not properly designed, incentives for large-scale
carbon removal. afforestation and reforestation can result in monoculture
6 Center for Climate and Energy Solutionsplantations designed to sequester as much carbon as practices with cover cropping on the 88 million
possible without considering the importance of diverse hectares of land used to cultivate the United States’
forests ecosystems. That may have some climate benefits, five primary crops the presents a substantial
but such monoculture plantations might lead to deple- carbon removal opportunity of 103 MtCO2e per year.13
tion of adjacent water resources due to changes in the Adoption of no-till or organic farming practices have
hydrological cycle and substantial biodiversity losses. also been shown to create carbon storage benefits,
Inadequate management can also lead many planted although it is likely best to consider this storage as a
tree saplings to die; careful forest management is a co-benefit of these practices, given challenges with
necessity for a long period after the actual afforestation permanence and carbon accounting.14
or reforestation process.
In addition, the land use competition mentioned Cost
earlier means that even if an AR project is successfully Cost estimates for biochar vary significantly. Some
implemented, it could have negative ramifications on studies estimate an abatement cost as low as $30/ton of
land elsewhere. For example, AR incentives can shift carbon dioxide, while others have higher estimates up to
agricultural production to other regions, including $120/ton of carbon dioxide.15 It is challenging to esti-
potentially clearing forested land elsewhere to create mate abatement cost for soil carbon sequestration since
new cropland. This “leakage” problem can reduce these processes vary greatly by context, type of practice,
or eliminate the removal benefits intended by the labor costs, and degree of mechanization. Some studies
original project.10 note that 20 percent of the removal achieved by soil
carbon sequestration can even be associated with savings
Biochar and soil carbon sequestration up to $45/tCO2e, while about 80 percent can be real-
Biochar is a charcoal-like substance produced via ized at costs between $0-10/tCO2e.16 Other studies have
pyrolysis (i.e., the thermal decomposition of organic higher estimates for removal potentials assuming higher
material in the absence of oxygen). Biochar production carbon prices ($20-$100/tCO2e) that could encourage
converts biomass that might otherwise decay into a form further adoption of soil carbon sequestration practices.17
that is relatively resistant to decomposition. When added
to the soil, biochar stores carbon in a stable form that Readiness
prevents it from leaking into the atmosphere. Biochar is an established technology that has been used
Soil carbon sequestration refers to the process of in some form for thousands of years, but is not yet widely
removing carbon dioxide from the atmosphere by applied.
changing land management practices in a way that Soil carbon sequestration is also ready for deploy-
increases the carbon content of the soil. Since the level ment. Many of the agricultural and land-management
of carbon in soil is a balance of carbon inputs (e.g., from practices required are well known by farmers and mostly
leaf litter, residues, roots, manure) and carbon losses do not require significant machinery or infrastructure
(mostly through respiration, increased by soil distur- upgrades. Like AR, this makes soil carbon sequestration
bance), practices that either increase inputs or reduce well-suited to provide near-term climate benefits while
losses can promote soil carbon sequestration. work continues to develop engineered solutions at scale.
Potential Scalability
Biochar has the potential to remove up to 95 MtCO2e per In order for biochar to be deployed at large scale, the
year11 in the United States, the equivalent of nearly all infrastructure, especially pyrolysis facilities, will need
carbon dioxide emissions from power plants in the New to ramp up significantly, which would also bring down
England and Pacific regions combined.12 This estimate costs of production. In addition, the quantity of biomass
takes into account crop cultivation, biochar production available for biochar production is a limiting factor;
by pyrolysis, and carbon sequestration by biochar used as biochar competes with other applications (e.g., combined
a soil improver. heat and power (CHP), BECCS) for a limited amount
The use of cover crops is one of the main strategies of biomass, which can make large-scale deployment of
to increase soil carbon. Replacing conventional growing biochar more challenging.
Carbon Dioxide Removal: Pathways and Policy Needs 7Although regenerative soil management practices The main drawback for soil carbon sequestration is
are well known, a lack of policy and financial incentives the reversibility of carbon storage if the practices that
can delay large-scale adoption of practices that could led to sequestration cease to be utilized. For example, if
enhance soil carbon sequestration. For example, the cover crops are no longer used on a field, soil respiration
annual cover crop survey by the Sustainable Agriculture would ramp up, increasing carbon losses. Soil tillage and
Research and Education (SARE) program and the erosion may also have negative effects on soil’s carbon
Conservation Technology Information Center (CTIC) capture ability, with precise impacts depending on soil
found that cost share/incentive programs were the top type and other environmental factors.23
factor non-users said would influence adoption.18 In addi-
tion, there is still a need for large demonstration projects Benefits and co-benefits
to build confidence that such practices can be adopted
Biochar can enhance soil fertility and productivity. Some
without incurring substantial costs.
studies suggest that crop productivity increases by 10
percent on average following biochar soil amendment.24
Sink saturation
Soil carbon sequestration can also help enhance soil
Further research is needed to estimate the time needed health, crop yields, and yield consistency. In addition,
for biochar to reach saturation, but analysis of various although soil carbon sequestration is applied on large
studies on the stability and decomposition of biochar land areas, it can be applied without major concerns over
suggests a saturation limit on the scale of several centu- changing land use, as well as with almost negligible water
ries.19 However, these estimates vary based on soil type and energy footprints.
and pyrolysis temperature.
Soil carbon sequestration, like AR, locks away carbon Challenges
until the carbon sink is saturated, which occurs within
Since biomass can be used as a fuel, its conversion to
10-100 years depending on soil type, climate zone and
biochar and burial forgoes some of the potential energy
other factors. The IPCC uses a default saturation time
uses available. In addition, large-scale biochar applica-
of 20 years.20
tion can darken the soil surface, which will decrease the
amount of sunlight reflected from the soil without being
Permanence absorbed (i.e., surface albedo) and lead to changes in
The inert carbon of biochar makes it very stable, which is the land surface radiation balance.
essential for its longevity in soil after application (more As noted earlier, soil carbon sequestration projects
than 100 years).21 The stability of biochar in the soil can cease any new carbon removal after 20 years of
provides a greater degree of permanence than many implementation, but they will need to be maintained
other nature-based solutions because of its extremely indefinitely, considering the reversible nature of soil
slow rate of decomposition.22 Therefore, biochar should carbon sequestration.
remain in the soil for as long as possible to achieve long-
term carbon storage.
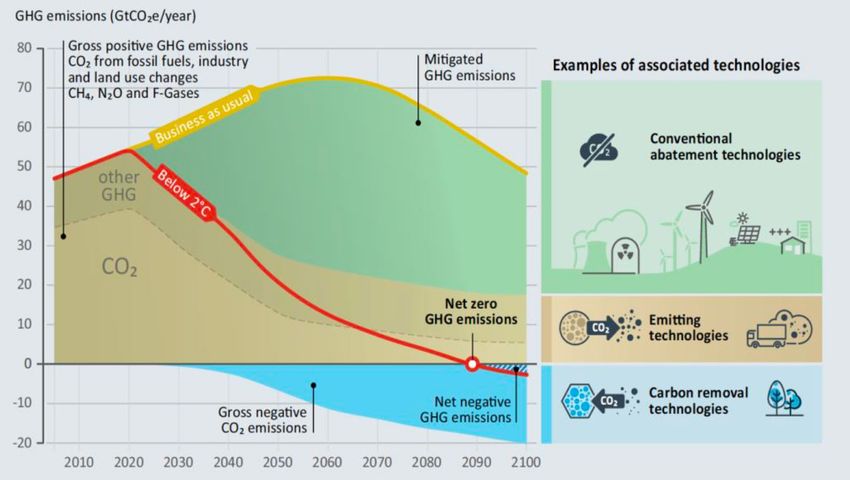
8 Center for Climate and Energy SolutionsTECHNOLOGICAL SOLUTIONS potential of BECCS in the United States is constrained by
the absence of transportation networks between sourced
Bioenergy with carbon capture and storage (BECCS) carbon dioxide and storage sites. A near-term solution
Bioenergy with carbon capture and storage (BECCS) could be to focus on regions where biomass resources are
is the process of using biomass to generate energy, co-located with storage basins that have suitable storage
capturing the released carbon dioxide, and storing it and injection rate capacities. This could result in the
in underground geologic formations (or potentially removal of 100–110 MtCO2e per year with the possibility
utilizing it to make long-lasting products). Biomass of expanding that to 360–630 MtCO2e per year by 2040.
includes both dedicated energy crops and waste (e.g., Regions with highest CO2 potential and co-located suit-
from forestry, agricultural, and municipal sources). CCS able storage sites are the northern Illinois basin, the Gulf
refers to the suite of technologies that capture carbon region, and western North Dakota (see Figure 3 below).26
dioxide from the exhaust of power plants or industrial
sources, transport it in dedicated pipelines, and store Cost
it in deep geologic formations. (When considering Cost estimates of BECCS vary widely depending on the
captured carbon that is utilized rather than stored, a “U” accessibility of biomass, the suitability of various types
is sometimes added into the acronym: CCUS.) of industrial plants, and the distance to storage sites.
For example, cost estimates for carbon dioxide capture
Potential from ethanol fermentation in a typical plant in the
Fully realized, the total biomass currently available in Midwest can be as low as $14–$30/ton of carbon dioxide,
the United States could result in removal of 370–400 but the majority of midwestern biorefineries are not
MtCO2e per year.25 However, the carbon removal co-located with suitable sites for geologic sequestration.
FIGURE 3. Distribution of technical potential of BECCS in the US
Left: carbon dioxide availability from U.S. biomass in 2020, Right: Cumulative sum of the potential carbon dioxide removal in counties
with a suitable storage site for 2020 and 2040. While storage capacity is generally considered abundant, injection rate capacity is an
important limiting factor to consider for geologic storage. Injection rates should not exceed the injectivity limit of a particular geologic
formation to avoid creating fractures in the confining formation which can lead to leakage.
Source: Baik et al., 2018
Carbon Dioxide Removal: Pathways and Policy Needs 9Sixty percent of current nationwide biorefinery capacity facility—as well as further development of carbon
requires pipeline transport to basins in Illinois, the dioxide geologic sequestration sites.
Dakotas, Wyoming, or Kansas.27 Combustion BECCS has
higher cost estimates ranging from $88–$288/ton of Sink saturation
carbon dioxide.28 Transport costs, in turn, could be in
The United States has at least 2,600 billion metric tons
the range of $10-$20/ton of carbon dioxide depending
of possible carbon dioxide storage resource in saline
carbon dioxide transport networks’ capacity and
formations, oil and gas reservoirs, and unmineable coal
length.29 Estimates for the overall net removal costs for
seams. 34 This translates into potentially storing hundreds
different BECCS technologies, including land require-
of years’ worth of industrial greenhouse gas emissions.
ments for biomass, transport, and storage, are generally
in the range of $40-$130/ton of carbon dioxide.30
Permanence
Readiness Assuming suitable storage sites, the carbon dioxide
captured from BECCS facilities can be permanently
Although bioenergy and CCS are each relatively mature
stored in deep geologic formations. Decades of experi-
technologies, in combination they have seen very little
ence with geologic sequestration of carbon dioxide
demonstration at commercial scale (e.g., the Illinois
have demonstrated that injected carbon dioxide can be
Basin-Decatur Project, described below). BECCS
safely stored at suitable sites, essentially in perpetuity,
technologies currently have TRLs ranging from 3-7.31
with minimal risk of leakage or release.35 Injection
While BECCS for combustion and co-firing (i.e., a power
rates must be considered and closely monitored during
plant) is associated with a TRL of 3-6, BECCS for ethanol
carbon dioxide operations, as carbon dioxide injec-
fermentation has a TRL value of 5-7. (See Figure 2,
tion pressure needs to remain lower than the fracture
earlier, for a review of the TRLs.)
pressure of the underground storage reservoir to avoid
creating fractures or activating faults that might lead to
Scalability carbon dioxide leakage. Still, project developers need
The scalability of BECCS faces two main challenges—the to continue to develop technical capacity in geologic
need for ramping up production of biomass to be used storage site characterization and reservoir monitoring.
as a feedstock and the need to accelerate deployment of For instance, the Illinois Basin-Decatur Project (IBDP)
carbon dioxide transport and storage infrastructure.32 injected approximately 1 million metric tons of carbon
With regard to biomass production, most of the dioxide derived from biofuel production into the Mt.
total potential biomass available for BECCS in the Simon Sandstone Saline Reservoir, in Decatur, Illinois.
United States is agricultural residue or harvested and Operational injection started in November 2011 and
residual woody biomass.33 There are other uses (e.g., was completed in November 2014. The IBDP effort is
biochar, ecosystem services) competing for that biomass. currently conducting post-injection monitoring.36
Likewise, to the extent BECCS relies on energy crops,
there are other competing uses for that cropland, and Benefits and co-benefits
switching to energy crops or creating pressure to convert BECCS is a unique CDR solution as it can be utilized to
other land uses to cropland could have impacts on food generate energy—such as ethanol, electricity, or poten-
prices and biodiversity. tially hydrogen—while also removing carbon from the
The lack of spatial co-location of biomass availability atmosphere. BECCS creates the possibility of producing
and suitable carbon dioxide storage basins, as noted carbon-negative energy.
earlier, could also constrain the deployment of In addition, captured carbon dioxide can be utilized
BECCS. Scaling BECCS will require long-distance in different industrial applications. Fermentation
biomass and/or carbon dioxide transport systems—to from corn ethanol in the United States is already a
move biomass to the bioenergy facility and to move large source of carbon dioxide for use in a number of
carbon dioxide from a capture facility to a storage consumer products, such as food, beverage, and dry ice.37
10 Center for Climate and Energy SolutionsChallenges transportation, and storage are similar to other CCS
Putting CCS on a bioenergy facility can address the emis- technologies. Because of the high energy requirements
sions from that facility, but there are still the upstream of removing dilute atmospheric carbon dioxide and
climate impacts from the growing and harvesting of releasing the captured carbon dioxide from the capture
biomass to consider. There are many uncertainties media (particularly for solvents), the type and cost of
related to the accounting of land-use change emissions energy utilized by DAC plants will determine the cost
and their impact on the actual life cycle climate benefits and emissions reduction potential of a given DAC facility.
of BECCS. Studies report that first-generation, near-term DAC
plants may have carbon removal costs on the order of
Direct air capture (DAC) $600–$1,000/ton of carbon dioxide initially, but this
cost could decrease to US$100-$300/ton of carbon
Carbon dioxide in the ambient air is at about 400 parts
dioxide with technological improvements, large-scale
per million, which is 100-300 times more dilute than the
deployment, and increasing availability of low-cost clean
concentration of carbon dioxide in the emissions stream
electricity.39
from a gas- or coal-fired power plant. Direct air capture
(DAC) involves direct removal of dilute carbon dioxide
Readiness
from ambient air via chemical bonding. Currently, there
are two types of DAC being scaled as CDR solutions: There are different DAC processes at various levels of
chemical liquid solvent DAC and chemical solid sorbent maturity. On a commercial scale, there are a few compa-
DAC. While there are technical differences between nies that have started to develop commercial models
the two methods, they operate under a similar concept: for DAC, including Carbon Engineering, who uses a
removal of carbon dioxide from ambient air by contact chemical liquid solvent, and Global Thermostat and
with a basic solution (chemical liquid solvents) or a basic Climeworks, who use a chemical solid sorbent. Currently,
modified surface (chemical solid sorbents). The carbon DAC technologies have a TRL value of 4-7.40
dioxide, now fixated in a carbonate or carbamate bond,
can then be liberated from the capture media through Scalability
the application of heat, producing a high-purity carbon Economic costs, rather than biophysical limitations,
dioxide stream that can be transported to storage sites or remain the main barrier for scaling up DAC, though
industrial plants for utilization. mass production of air capture devices could lead to
cost estimates dropping by orders of magnitude.41 The
Potential deployment of DAC at large scale also depends on access
DAC demonstration projects and activities have received to sufficient low-cost, low-carbon energy and water to
a great deal of attention of late relative to other CDR drive capture and regeneration. While DAC’s ability to
technologies, but there has been very little focus on the be located more or less anywhere can reduce the obstacle
removal potentials of DAC compared to its cost-related to scaling posed by the need for extensive carbon dioxide
barriers.38 Theoretically, DAC may be able to capture transport infrastructure, it is essential to scale up storage
extremely large amounts of carbon dioxide (up to several infrastructure so project developers can be certain of
gigatons), which could then be sequestered in geologic their ability to permanently sequester the captured
formations that also have enormous storage potential. carbon dioxide.
Cost Sink saturation
The economic cost has been the main factor deter- As noted with respect to BECCS, the United States has at
mining the viability of DAC. Costs of DAC include: least 2,600 billion tons of possible carbon dioxide storage
capital investment in equipment and facilities, energy resource in saline formations, oil and gas reservoirs, and
costs associated with capture and operation, energy unmineable coal seams. 42 This equates to hundreds of
costs of regeneration, and sorbent loss and maintenance. years’ worth of industrial greenhouse gas emissions.
Additional costs related to carbon dioxide compression,
Carbon Dioxide Removal: Pathways and Policy Needs 11Permanence sequestered from ambient air can be accurately and
Like BECCS, the permanent sequestration of carbon precisely accounted for, which enables DAC to offer
dioxide captured by DAC is mostly subject to the nature significantly greater investment safety and confidence
of underground geological storage. Assuming suitable compared to other CDR solutions, many of which face
storage sites, the carbon dioxide captured from BECCS carbon accounting challenges related to the variability
facilities can be permanently stored in deep geologic associated with land-use change emissions.
formations, with minimal risk of leakage or release.
Challenges
Benefits and co-benefits The main challenge for DAC is cost, especially in the
The locational flexibility of DAC—the air is every- absence of a price or constraint on carbon that would
where—makes it a particularly promising CDR approach, help justify the costs of DAC. The high energy require-
as does the fact that DAC facilities have small land and ments for large-scale DAC facilities would also require
water footprint (not conisdering the land footprint of an extraordinary increase in low-carbon energy capacity,
associated energy sources). In addition, carbon dioxide beyond what will already be needed to decarbonize the
energy system.
TABLE 2. A summary of removals potentials, costs, and readiness levels of different CDR
solutions in the US
PATHWAY/ POTENTIAL REMOVAL COST ($/TCO2) READINESS/ REMOVAL/ PERMANENCE
SOLUTION RATE BY 2050 (MTCO2/YR) TRL STORAGE RANGE EFFECTIVENESS
NATURE-BASED
Afforestation/ 80–390 5–50 Deployment Decades to Low
Reforestation centuries
Biochar 55–95 20–130 Demonstration Years to decades Low
Soil carbon 52–103 45 (profit)–10 Demonstration Years to decades Low
sequestration (cost)
TECHNOLOGICAL
BECCS 370–400 40–130 5–7 Millennia High
DAC No fundamental limitation 600+ (early 4–7 Millennia High
on technical potential, but stage)
mainly limited by financial 100–300 (longer
and low-carbon energy term)
requirements
12 Center for Climate and Energy SolutionsPOLICY RECOMMENDATIONS
The world will need CDR solutions at large scale in order analyses (LCAs) for a variety of removal technologies.
to limit global temperature increases to 1.5 degrees C. At Credible assessment frameworks need to be widely
the current rate of emissions reductions, the world is on adopted by project developers to demonstrate and
pace to “overshoot”, or exceed, that 1.5-degree threshold. verify the net carbon removal associated with their CDR
The ability of CDR solutions to achieve “negative efforts. Likewise, the integrity of geologic storage will
emissions” to address overshoot makes them a critical be a key enabler for sustained public support for CDR.
addition to the climate solutions toolkit. (Again, the These are described more below as well.
potential of CDR solutions should not be overstated and
will mean little if there are not simultaneous efforts to RD&D
reduce emissions across the economy.) Given the varia-
Government funding for research, development, and
tion in removal potentials, risks, costs, and uncertainties
demonstration (RD&D) programs can make a huge
described earlier, a portfolio of CDR solutions will be
difference in the costs and deployment levels of technolo-
needed in order to maximize the chances of limiting
gies. For example, federal RD&D funding has played a
warming to 1.5 degrees C. Policy can play a vital role in
pivotal role in scaling up renewable energy resources and
making such a portfolio a reality.
driving down their costs over the last several decades.
Policy can accelerate deployment of CDR solutions The U.S. Department of Energy (DOE) spent $9.37
and the associated learning-by-doing, which can drive billion for renewable energy research and development
down the costs of the solutions. Early assessments of from 2009 to 2018.44 These investments, paired with
technologies sometimes fail to consider the potential other complementary policies, managed to steadily
for such policies and thus overestimate the solutions’ decrease costs and double U.S. renewable energy genera-
economic costs. For example, after sulfur dioxide tion since 2008.45 In contrast, federal RD&D funding
emission trading was enacted, sulfur reduction technolo- for CDR-related projects has only amounted to nearly
gies at power plants proved within a few years to be 10 $3 billion over the same period. Nearly half of this was
times cheaper than experts had predicted shortly before dedicated to geologic sequestration projects, 26 percent
trading began.43 In the case of CDR, the hope is that was dedicated to terrestrial and bioenergy projects,
policy incentives can lead to similar results. Ramping while DAC received barely $10.9 million (less than 1
up deployment of removal solutions can help assess percent).46 Higher levels were recently authorized in the
and demonstrate their true economic costs and carbon Consolidated Appropriations Act, 2021, though funding
reduction potentials. for these programs at those levels has yet to be appropri-
Some CDR solutions—primarily nature-based solu- ated. Still, the current size of the federal RD&D budget
tions—are already being deployed and, either because dedicated to CDR does not reflect its potential economic
of low cost or substantial co-benefits, could be scaled or climate benefits.
through modest carbon rules or incentives. However, Given the importance and potential of CDR solu-
these solutions only go so far. Other CDR solutions have tions, there is a need for strong RD&D programs to
even larger removal potentials but need more robust support the development and demonstration of large-
policy support—ideally from a combination of “tech- scale removal capabilities. The National Academies of
nology-push” and “demand-pull” policies—to be brought Sciences, Engineering, and Medicine (NASEM) recom-
to scale. Technology-push policies can foster further mended funding the research of CDR technologies
innovation in CDR solutions, attract investment, and such as BECCS and DAC at an annual average of $217
support the development of carbon dioxide infrastruc- and $240 million respectively over the next 10 years.47
ture, while demand-pull policies can accelerate market NASEM also recommended increased funding for AR
creation for CDR solutions. Some of these policies are research over the next three years and the develop-
described in more detail below. ment of a national monitoring system for forest carbon
In addition, there is a need for other types of policies that would complement the U.S. Forest Service forest
to foster trust and long-term support for CDR solutions. inventory.48 In addition, it will be important for DOE
For example, it is critical to establish rigorous life cycle to coordinate with the U.S. Department of Agriculture
Carbon Dioxide Removal: Pathways and Policy Needs 13and industry to assess the carbon removal potential of be less reliant on the transport infrastructure, given its
biomass approaches, including BECCS and biochar, and siting flexibility). Federal infrastructure policies should
to develop carbon-negative fuel pathways that are cost- address siting, permitting, and investment needs for
competitive. CDR research budgets and programs should carbon dioxide pipelines and sequestration sites.
better reflect the opportunities that these solutions
present for climate mitigation and economic growth. MARKET CREATION
A common challenge for new technologies and
CARBON PRICING AND STANDARDS approaches is the way that risks—real and perceived—
Cost is currently a hurdle for many carbon removal solu- affect the market’s willingness to pay for them, and CDR
tions, particularly as costs associated with greenhouse solutions are no exception. Policies can create demand-
gas emissions are not fully incorporated into economic pull for CDR technologies (and other CCS technologies)
activities. Policies that institute a robust carbon price or by fostering markets for utilization of the captured
carbon constraint could boost CDR’s cost competitive- carbon dioxide. For example, government procurement
ness, which in turn could increase investments in CDR policies can commit to purchasing (and set requirements
solutions. Several legislative approaches have been for) materials that begin to utilize captured carbon
proposed recently to establish a carbon tax or a cap-and- dioxide in their production, such as cement, concrete,
trade program, proposing prices in the range of $15-$52 and aggregate, for use in constructing new state and
per ton in the early 2020s and escalating at different federal buildings. Similarly, building codes could be
rates to $30-$135 per ton by 2030.49 The higher the updated to set maximum life-cycle emission limits for
carbon price, the more potential for CDR solutions to be building and construction materials, and material stan-
deployed at scale. dards and certifications need to be updated to allow for
However, a price alone might not be sufficient. carbon dioxide-based products to be used. Policies could
Additional policy mechanisms will likely be needed also help support existing niche markets that have a
to accelerate the deployment of CDR technologies. higher-than-average current willingness to pay for using
For example, a federal Clean Energy Standard (CES) captured carbon dioxide, (e.g., enhanced oil recovery
that permits CDR projects to contribute in limited (EOR)), which can help drive more early deployment
and targeted ways to an overall clean energy target and bring costs down. Although these niche markets are
could increase the deployment of CDR and provide the miniscule compared to the gigatons required for climate
certainty necessary for large capital investments. CDR stabilization, this early market creation can help CDR
projects could be made eligible for CES credits based on technologies grow and begin to achieve some scale.50
the net carbon dioxide removed from the atmosphere.
California has already adopted a similar approach in its LIFE CYCLE ANALYSIS (LCA) AND ENVIRONMENTAL
Low Carbon Fuel Standard (LCFS) by allowing CCS and MONITORING
DAC projects to be eligible for credits under the LCFS, The credibility and smart deployment of CDR solutions
provided they meet the requirements specified in the will always be tied to how accurately their life cycle
CCS Protocol. The inclusion of CDR in a variety of policy emissions are identified and accounted for. Large-scale
contexts, including in the power and fuels sectors, could deployment of CDR solutions (and of carbon dioxide-
unlock a massive amount of investment and help CDR based materials) will therefore require rigorous and
solutions reach their removal potentials. credible life cycle assessment (LCA). LCA analyses
will also have to go beyond consideration of only emis-
INFRASTRUCTURE sions, as large-scale deployment of CDR solutions will
As described earlier, the need for supporting infra- have impacts on energy, food, water, and land systems.
structure presents a key constraint on the scalability of Furthermore, analyses will have to consider not only the
several CDR approaches, particularly the technological impacts of individual solutions, but also the impacts of
solutions. Like other CCS technologies, both BECCS and deployment of multiple CDR solutions, as some could
DAC rely on accelerated deployment of carbon dioxide create additional pressures on the same systems. For
transport and storage infrastructure (though DAC could example, afforestation and BECCS might compete over
14 Center for Climate and Energy Solutionsland, and biochar and BECCS might compete over INTEGRITY OF STORAGE
biomass feedstocks. EPA should establish a life-cycle Policies are also needed to ensure secure geologic
GHG accounting framework for CDR solutions that can storage and to reduce uncertainties related to long-term
enable carbon removal projects to be accurately credited carbon storage and liability. There is high confidence
for net carbon dioxide removed from the atmosphere. that secure geologic storage is abundant, but liability for
Beyond LCAs, real-world impacts have to be tracked. stored carbon dioxide is a significant barrier for large-
Monitoring, reporting, and verification (MRV) will scale deployment of carbon storage projects and infra-
therefore also be critical in establishing public accep- structure. However low the probability of carbon dioxide
tance of large-scale deployment of nature-based and leakage from geologic storage may be, policy should
technological CDR solutions (and carbon dioxide-based address these concerns to ensure project developers and
materials). While MRV guidelines for emissions are operators are responsible for reasonable environmental
well established, guidelines for CDR are not as fully and economic consequences. Although geologi-
developed. Reporting of carbon removal in nature-based cally sequestered carbon dioxide is intended to stay
solutions can be particularly challenging because the underground permanently, it is challenging for project
land is simultaneously a source and sink of greenhouse developers and operators to commit to legal liability over
gases due to both natural and anthropogenic processes geologic timescales; the prospect of thousands of years
that are hard to disentangle. While there are different of liability is a significant deterrent. A potential solution
available approaches for forest carbon accounting could be a nationally determined minimum period for
(e.g., land-based, activity-based), limitations in these stored carbon dioxide liability. After meeting a minimum
approaches such as measurement uncertainties, data number of years stored and satisfying specific perfor-
quality issues, and required monitoring still need to be mance criteria, regulatory frameworks would enable the
addressed. Ensuring the additionality of nature-based transfer of liability for a storage site or stored carbon
solutions is also a challenge. Reporting guidelines will dioxide, to an appropriate government agency. There
need to be specific to each CDR methodology to offer have been examples of this approach implemented in
rigorous frameworks for the different approaches. Canada, Australia, Netherlands, and the UK.51
CONCLUSION
Carbon dioxide removal will be an important and ready now and will be of particular importance in both
necessary complement to emissions reduction efforts, the near- and long-term. Meanwhile, complementary,
which should remain a top priority. The gravity of our scalable, more permanent technological solutions must
challenge to reduce emissions must also recognize that continue to be developed and deployed. A combina-
some sectors of the economy like industry and aviation tion of CDR solutions will be critical in meeting both
will require CDR and negative emissions solutions as domestic and international emissions goals. In addition
part of their decarbonization. In other cases, the last few to developing domestic technologies and expertise
percentages of emission reductions may create economic that can be exported globally, U.S. leadership will be
hardships for businesses and consumers due to cost. critical to ensuring that CDR solutions are available
Compensating for those emissions with CDR, when part at the scales necessary to meet the global challenge of
of a clear net-zero mandate can provide environmental climate change. Policy is needed to address numerous
and economic benefits. CDR solutions currently vary technological, economic, and regulatory barriers and
considerably in terms of removal potential, costs, enable CDR technologies to contribute meaningfully to a
readiness, scalability, permanence, benefits, and chal- comprehensive decarbonization strategy.
lenges. Nature-based solutions are largely affordable and
Carbon Dioxide Removal: Pathways and Policy Needs 15Other Climate Innovation 2050 Resources:
Getting to Zero: A U.S. Climate Agenda
https://www.c2es.org/document/getting-to-zero-a-u-s-climate-agenda/
Pathways to 2050: Scenarios for Decarbonizing the U.S. Economy
https://www.c2es.org/document/pathways-to-2050-scenarios-for-decarbonizing-the-u-s-economy/
Restoring the Economy with Climate Solutions: Recommendations to Congress
https://www.c2es.org/document/restoring-the-economy-with-climate-solutions-recommendations-to-congress/
Climate Policy Priorities for the New Administration and Congress
https://www.c2es.org/document/climate-policy-priorities-for-the-new-administration-and-congress/
C2ES would like to thank The Bernard and Anne Spitzer
Charitable Trust, the William and Flora Hewlett Foundation,
the Energy Foundation, and the Intel Corporation for their
support of this work. We would also like to thank Dave
Grossman of Green Light Consulting for his contributions to
this work.
16 Center for Climate and Energy SolutionsENDNOTES
1 IPCC Special Report, Global Warming of 1.5°C, 2018.
2 U.S. Environmental Protection Agency, Inventory of U.S. Greenhouse Gas Emissions and Sinks: 1990–2018, 2020
3 National Academies of Sciences Engineering and Medicine (NASEM), Negative Emissions Technologies and Reliable
Sequestration: A Research Agenda; The National Academies Press: Washington, DC, 2019.
4 UNEP, The Emissions Gap Report 2017, United Nations Environment Programme (UNEP), Nairobi, 2017.
5 Golub, A., Hertel, T.W., Lee, H.-L., Rose, S., & Sohngen, B. The opportunity cost of land use and the global potential
for greenhouse gas mitigation in agriculture and forestry. (Resource and Energy Economics, 2009), 31(4), 299–319; Nielsen, A.,
Plantinga, A., & Alig, R. Mitigating climate change through afforestation: New cost estimates for the United States. (Resource and
Energy Economics, 2014), 36(1), 83–98.
6 Jackson, R. B., & Baker, J. S. Opportunities and constraints for forest climate mitigation. (BioScience, 2010), 60(9),
698–707; Alig, R., Latta, G., Adams, D., & McCarl, B. Mitigating greenhouse gases: The importance of land base interactions between
forests, agriculture, and residential development in the face of changes in bioenergy and carbon prices. (Forest Policy and Economics,
2010) 12(1), 67–75; Fargione, J.E., S. Bassett, T. Boucher, S.D. Bridgham, R.T. Conant, S.C. Cook- Patton, P.W. Ellis, et al.
Natural Climate Solutions for the United States. (Science Advances, 2018).
7 D. Haim, E. M. White, R. J. Alig, Agriculture afforestation for carbon sequestration under carbon markets in the United
States: Leakage behavior from regional allowance programs, (Applied Economic Perspectives and Policy, 2015) 38, 132–151.
8 Fuss, Sabine; Lamb, William F.; Callaghan, Max W.; Hilaire, Jérôme; Creutzig, Felix; Amann, Thorben et al.
Negative emissions—Part 2. Costs, potentials and side effects, (Environ. Res. Lett., 2018).
9 John Reilly, Jerry Melillo, Yongxia Cai, David Kicklighter, Angelo Gurgel, Sergey Paltsev, Timothy Cronin,
Andrei Sokolov, and Adam Schlosser, Using Land To Mitigate Climate Change: Hitting the Target, Recognizing the Trade-offs,
(Environmental Science & Technology, 2012) 46 (11), 5672-5679
10 Leakage can occur if a project or an activity causes emissions to increase and/or removals to decrease outside
the spatial, accounting, and/or temporal boundary that is used to define the emission reduction benefits of the project or
activity.
11 Fargione, J.E., S. Bassett, T. Boucher, S.D. Bridgham, R.T. Conant, S.C. Cook- Patton, P.W. Ellis, et al. Natural
Climate Solutions for the United States. (Science Advances, 2018).
12 U.S. Energy Information Administration, Emissions by geographical region for CO 2, SO 2, and NOx: 2013–2018, 2019
13 Fargione, J.E., S. Bassett, T. Boucher, S.D. Bridgham, R.T. Conant, S.C. Cook- Patton, P.W. Ellis, et al. Natural
Climate Solutions for the United States. (Science Advances, 2018).
14 Ogle, S.M., Alsaker, C., Baldock, J. et al. Climate and Soil Characteristics Determine Where No-Till Management Can
Store Carbon in Soils and Mitigate Greenhouse Gas Emissions. Sci Rep 9, 11665 (2019).
15 Fuss, Sabine; Lamb, William F.; Callaghan, Max W.; Hilaire, Jérôme; Creutzig, Felix; Amann, Thorben et al.
Negative emissions—Part 2. Costs, potentials and side effects, (Environ. Res. Lett., 2018).
16 Smith P. Soil carbon sequestration and biochar as negative emission technologies, (Global Change Biology, 2016).
17 Smith P et al, Greenhouse gas mitigation in agriculture, (Phil. Trans. R. Soc. London B Biol. Sci., 2008) 363 789–813
18 Conservation Technology Information Center, Sustainable Agriculture Research and Education, American
Seed Trade Association, Annual Report 2016-2017 Cover Crop Survey, 2017.
19 Wang J, Xiong Z and Kuzyakov Y, Biochar stability in soil: meta-analysis of decomposition and priming effects, (GCB
Bioenergy, 2016).
Carbon Dioxide Removal: Pathways and Policy Needs 17You can also read