Cedar Fair (NYSE: FUN) - INVESTOR PRESENTATION -March 2018
←
→
Page content transcription
If your browser does not render page correctly, please read the page content below
Cedar Fair (NYSE: FUN)
INVESTOR PRESENTATION –March 2018
FORWARD-LOOKING STATEMENTS

Some slides and comments included here, particularly related to estimates, comments on
expectations about future performance or business conditions, may contain “forward-looking
statements” within the meaning of the federal securities laws which involve risks and
uncertainties. You can identify forward-looking statements because they contain words such
as “believes,” “project,” “might,” “expects,” “may,” “will,” “should,” “seeks,” “approximately,”
“intends,” “plans,” “estimates” or “anticipates” or similar expressions that concern our strategy,
plans or intentions. These forward-looking statements are subject to risks and uncertainties that
may change at anytime, and could cause actual results to differ materially from those that we
anticipate. While we believe that the expectations reflected in such forward-looking statements
are reasonable, we caution that it is very difficult to predict the impact of unknown factors, and
it is impossible for us to anticipate all factors that could affect our actual results. Important
factors, including those listed under Item 1A in the Partnership’s Form 10-K could adversely
affect our future financial performance and cause actual results to differ materially from our
expectations.

                                                2
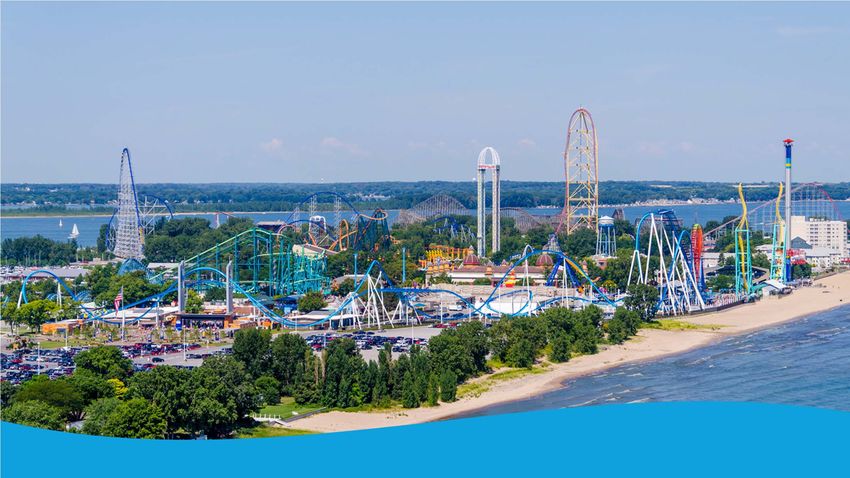
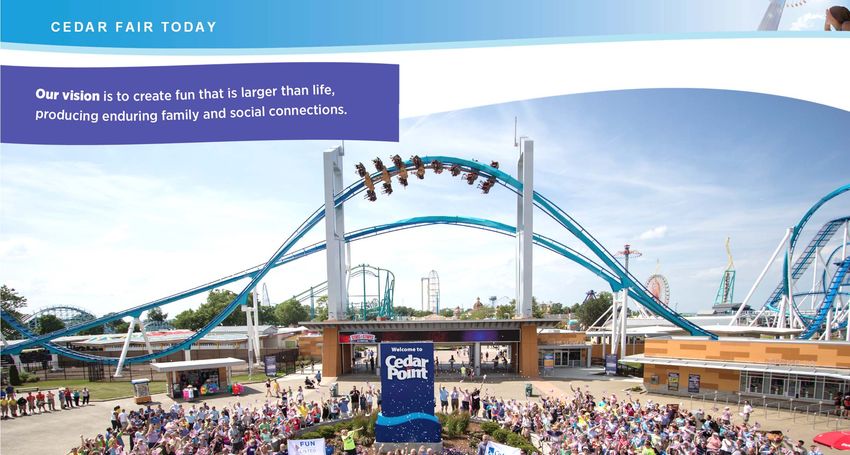
CEDAR FAIR TODAY

                   3
CEDAR FAIR TODAY
KEY STATISTICS
Entertains more than 25 million visitors annually
850+ rides and attractions
120+ roller coasters
More than 1,600 hotel rooms
4
CEDAR FAIR TODAY
STRONG, CONSISTENT RESULTS
TOTAL REVENUE AD J U S T E D E B I T D A(a)
$1,322 500
1,350 $481 $479
$1,289 $459
$1,236
($ in millions)
($ in millions)
450 $431
1,200 $1,160
$1,135 $425
400
$1,068
$391
1,050 $375
350
$1,028
900 300
2011 2012 2013 2014 2015 2016 2017 2011 2012 2013 2014 2015 2016 2017
Record Revenues and Attendance in 2017
Net revenues of $1.32 billion, up 3%
Record attendance of 25.7 million visits, up 3%
Record per capita spending of $47.30, up 1%
Out-of-park revenues of $144 million, down 2%
(a) See Appendix for reconciliation of Adjusted EBITDA
5
Why Invest in FUN?

   6
WHY INVEST IN FUN?
GREAT PARKS, GREAT PEOPLE, GREAT BUSINESS
High-quality assets with high barriers to entry
Well-run parks with a focus on operating excellence
Combination of world-class thrill rides and unique, family-oriented attractions appeal to a
diverse customer base
Value proposition creates loyal and repeat customers
Stable, recession-resistant business with proven strategy driving organic growth
MLP structure allows for tax-efficient return of capital to unitholders
History of impressive total returns; committed to a 4% annual increase in distributions to
unitholders while continuing to invest in the business
Balanced approach to capital allocation
FUNdamentals of our long-term strategy will continue to drive growth
7
WHY INVEST IN FUN?
SUPERIOR TRACK RECORD, FOUNDATION FOR GROWTH
History of success through multiple economic cycles
Revenues increased in 19 of past 20 years
EBITDA growth of 4% CAGR since 2012
Strong, consistent cash flow
Seven consecutive years of record average in-park guest per capita spending
Increasing attendance trends
$2.5 billion total distributions paid to unitholders over 31-year period
Compound annual total return to investors of 17% since going public 30 years ago in 1987
8
WHY INVEST IN FUN?

SUPERIOR TRACK RECORD
Strong Long-Term Growth and Recession Resilience

                   $600
                                                                                                                   Financial Crisis
                   $500                                                                                             2009 = (11.0%)
                                                                                                                    2010 = 13.2%

                   $400
($ in millions)

                                                                                  Early 2000’s
                                                                                  Recession
                   $300                                                          2001 = (6.1%)
                                                                                 2002 = 11.4%
                            Early 1990’s
                            Recession
                   $200

                   $100

                      $0

(a)               Acquisition of Knott’s Berry Farm in December 1997
                                                                                                 Adj. EBITDA (e)
(b)               Acquisition of Michigan’s Adventure in 2001
(c)               Acquisition of Geauga Lake in 2004
(d)               Acquisition of Kings Island, Canada’s Wonderland, Kings Dominion, Carowinds and California’s
                  Great America in 2006
(e)               See Appendix for reconciliation of Adjusted EBITDA
                                                                                                     9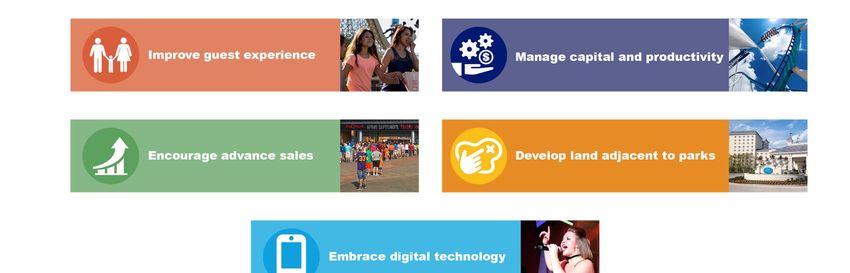
FUNdamentals of Our
Long-Term Strategy

   10
LONG-TERM STRATEGY
FUNDAMENTALS

EXPECTS MOMENTUM TO CONTINUE – DRIVING AN ADJUSTED
EBITDA CAGR OF 4% GOING FORWARD
•   Core focus of strategy remains the same: THE place to be for FUN

•   Disciplined approach to achieve full potential of our core business

•   Remains committed to steadily increasing our distribution by 4% to unitholders on an
    annual basis, consistent with our expected average annual growth rate in Adjusted EBITDA

                               Adjusted EBITDA(a) Growth
                               (in millions)                              $481             $479

                                                           $459

                                               $431
                                   $425

                        $391
               $375

               2011     2012       2013        2014        2015           2016             2017

                                                            (a) See appendix for Adjusted EBITDA reconciliation
                                                      11
LONG-TERM STRATEGY
FUNDAMENTALS
THE FUNDAMENTALS OF OUR LONG-TERM STRATEGY
REMAIN INTACT
12LONG-TERM STRATEGY
FUNDAMENTALS
IMPROVING THE
GUEST EXPERIENCE
Our ability to drive pricing relies upon the delivery
of a quality guest experience, including rides and
attractions, live entertainment offerings and exceptional
guest service – all of which drive repeat visits.
Highly marketable new rides and attractions built
to scale
Vibrant new park areas, created as outdated sections
of the parks are transformed
Enhanced food, merchandise, immersive
entertainment and special event offerings
“Best Day” experience for guests
Opportunities to extend length-of-stay and drive higher
guest spending levels
Season-extending special events
13LONG-TERM STRATEGY
FUNDAMENTALS
IMPROVING THE GUEST EXPERIENCE
Steel Vengeance Unique Culinary Experiences Seasons of FUN
Cedar Point continues to dominate as the We have executive chefs at each park to The addition of limited-time, special events at
Roller Coaster Capital of the WorldTM with the ensure the quality of our food offerings is all of our parks has proven a successful
introduction of Steel Vengeance, the first maintained at the highest levels and to device in driving urgency, enhancing the value
hyper-hybrid roller coaster. This thrill ride introduce new and unique culinary options. proposition of a season pass and tapping into
shatters 15 records, including tallest, fastest, This in-house expertise, combined with new an incremental audience. This includes
steepest and inversion count for a hybrid catering facilities, allows us to better serve our springtime festivals, immersive summer
roller coaster. group sales clients, providing them with entertainment, Halloween frights and
unique experiences that fit both their needs WinterFest holiday celebrations.
. and their budgets..
14LONG-TERM STRATEGY
FUNDAMENTALS
ENCOURAGING
ADVANCE SALES
By getting guests to purchase items ahead of time, we
are able to improve our visibility into market trends and
enhance revenue management capabilities; build a
buffer against traditional barriers to visitation, such as
weather and alternate entertainment options; and gain
favorable in-park spending elasticity.
Steady expansion of season passes and special
offers
All-season dining and beverage plans
FunPix, a new digital imaging platform
Professional group sales teams and continued
investment in improved catering facilities
15LONG-TERM STRATEGY
FUNDAMENTALS
ENCOURAGING ADVANCE SALES
Strong Season Pass Sales All Season Dining & Beverage Advance Purchase Commitments
Our capital investment strategy, including Our All-Season Dining and All-Season Our advance purchase channels make up
recent water park expansions and improved Beverage programs continue to grow in more than two thirds of our overall attendance
food and beverage options, along with our popularity and have helped to drive our record and continue to be the largest area of growth
special event programming provide enduring in-park guest per capita spending in 2017. for FUN. We attribute this success to the
reasons to visit our parks early and to visit Pre-sales of these products for our 2018 “Seasons of FUN” that we have established at
them often. Our focus on providing the “Best operating season are also off to a strong start. Knott’s and are beginning to establish at our
Day” experience for our guests every time other parks, including the introduction of
they visit our parks has led to increased sales. WinterFest at three parks in 2017 and one
more in 2018.
16LONG-TERM STRATEGY
FUNDAMENTALS
EMBRACING
DIGITAL TECHNOLOGY
Applying digital innovations in all aspects of our
business can enhance the overall guest experience,
promote sharing and socialization and provide greater
capital efficiencies through content and storyline
updates.
New mobile apps + free park-wide Wi-Fi
Self-service kiosks improve the guest experience
with service efficiencies while driving labor
efficiencies for the business
Historical guest data from our CRM platform
17LONG-TERM STRATEGY
FUNDAMENTALS
EMBRACING DIGITAL TECHNOLOGY
Mobile App CRM Platform Self-Serve Kiosks
Our mobile app solution enhances the in-park The assembly of multi-year consumer data The expansion of self-serve kiosks at select
experience by providing guests with under one, cohesive system, not previously food locations improves the guest
information they value, creating two-way available to us, will improve the effectiveness experiences, increases transactions per hour
conversations with guests to drive increased of guest communications efforts going and allows us to optimize our labor.
in-park spending and capturing valuable guest forward.
data for CRM applications.
18LONG-TERM STRATEGY
FUNDAMENTALS
MANAGING CAPITAL
AND PRODUCTIVITY
We will continue to be disciplined around the
prioritization of capital and operating initiatives as we
look to realize the full market potential at each of our
parks.
Five-year capital strategy includes:
Spending 10% of revenues on marketable new
rides, attractions and park infrastructures on an
annual basis
Continued evaluation of fixed-cost base to remove
inefficient capacity to help maintain historically high
margins between 36% and 38%
Investing incremental capital dollars to develop land
adjacent to our parks utilizing cash on our balance
sheet
19LONG-TERM STRATEGY
FUNDAMENTALS
MANAGING CAPITAL AND PRODUCTIVITY
Carowinds Multi-Year Expansion Unique Regional Brands Cedar Point
Charlotte is a vibrant market and we are moving We have found that embracing the heritage of Resort offerings enhance the park’s super-
forward aggressively to implement our planned our unique brands and strategically regional appeal and allow us to lean into our
multi-year investments in Carowinds. 2017 was operationalizing those brands, leads to a guest marketing efforts more aggressively in outer
the third consecutive year of record attendance experience unmatched by other regional markets. In 2018, we are expanding overnight
at this park. entertainment options. The in-depth analysis we accommodations with the opening of a new
are performing at each of our parks directly five-story addition to the Hotel Breakers. This
informs our investment strategy, works across expansion, combined with the newly
all departments and functions, and supports rebranded Cedar Point Shores water park,
strong consumer loyalty. strengthens Cedar Point’s appeal as a multi-
day family resort destination.
20LONG-TERM STRATEGY
FUNDAMENTALS
DEVELOPING LAND
ADJACENT TO PARKS
Approximately 1,400 acres of undeveloped land
adjacent to our parks (a)
Hotels, cabins to expand accommodation services
for guests
Amateur sports facilities to drive incremental
attendance
Complementary commercial development
opportunities in dining and entertainment
(a) See Appendix for detailed listing of undeveloped land by park.
21LONG-TERM STRATEGY
FUNDAMENTALS
DEVELOPING LAND ADJACENT TO PARKS
Amateur Sports Facilities Resort Expansion California’s Great America Rezoning
A new multi-million dollar amateur sports There are multiple opportunities, including This park’s favorable location in Santa Clara,
facility located across the bay from Cedar Charlotte and Toronto markets, to expand our CA, adjacent to the new San Francisco 49ers
Point amusement park began hosting resort accommodations which will help to drive stadium, provides us the ability to consider
tournaments in March 2017. The new facility incremental attendance and create a complementary commercial development such
is bringing an incremental customer base to consistent new revenue stream. as dining and entertainment now that our
the region. rezoning application has been approved.
22The FUN Continues 23
THE FUN CONTINUES
2018 CAPITAL EXPENDITURES
FOUR new roller coaster experiences
Steel Vengeance
Steel Vengeance - A record-breaking hybrid
coaster at Cedar Point, has had both guests
and the media alike talking about its massive
steel and wooden structure for months.
HangTime - At 150 feet, HangTime will tower
over the Knott’s Berry Farm Boardwalk area,
showcasing gravity-defying inversions, mid-
air suspensions and twisting dive tracks.
RailBlazer
RailBlazer - At California’s Great America,
RailBlazer will lift riders to a height of 106
feet before plunging them face down at a 90-
degree angle.
Twisted Timbers - Steel and wood combine
forces to bring guests a first-of-its-kind in the
mid-Atlantic hybrid coaster at Kings
Dominion.
24THE FUN CONTINUES
ALSO NEW IN 2018
Expanded family attractions, high capacity dining venues and increased resort offerings
Carowinds’ kids’ area will be
completely transformed into an all-new
Camp Snoopy
Hotel Breakers at Cedar Point will
open its second tower that will add an
additional 158 rooms to the beachfront
property
Two new family rides and expanded
play and splash area will open at
Canada’s Wonderland
Valleyfair will introduce Delirious, a
seven-story 360-degree loop thrill ride
Nordic Chaser, a family ride aboard
mini ships, will open at Worlds of Fun
And more…
25WHY INVEST IN FUN?
GREAT PARKS, GREAT PEOPLE, GREAT BUSINESS
High-quality assets with high barriers to entry
Well-run parks with a focus on operating excellence
Combination of world-class thrill rides and unique, family-oriented attractions appeal to a
diverse customer base
Value proposition creates loyal and repeat customers
Stable, recession-resistant business with proven strategy driving organic growth
MLP structure allows for tax-efficient return of capital to unitholders
History of impressive total returns; committed to a 4% annual increase to our distribution to
unitholders while continuing to invest in the business
Balanced approach to capital allocation
FUNdamentals of our long-term strategy will continue to drive growth
26Appendix
APPENDIX

   SIGNIFICANT REAL ESTATE HOLDINGS
   The Company owns more than 4,000 acres of developed and developable
   real estate

                      Sandusky, Buena Park, Allentown,   Kansas City,   Shakopee,     Muskegon,     Cincinnati,     Toronto,     Richmond,       Charlotte, Santa Clara,
Location
                         OH         CA          PA          MO             MN            MI            OH           Ontario         VA             NC           CA

Date Opened             1870       1920        1884         1973          1976          1978           1972           1981           1975          1973              1976

Date FUN Acquired       N/A        1997        1992         1995          1978          2001           2006           2006           2006          2006              2006

Acreage (developed/
                      515 / 110    175 / -    180 / 30    250 / 100      110 / 80     120 / 140      330 / 350       295 / -      280 / 460      300 / 100       165 / - (a)
developable)

                                                                                          (a) Great America land is leased; all other land is owned by the Company

                                                                                 28
APPENDIX
STRONG BALANCE SHEET
• Ample financial flexibility to capitalize on future growth opportunities
• Consolidated Leverage Ratio was 3.5x as of 12/31/17
• Cash interest costs expected to be between $80 million to $85 million annually
• Cash on hand was ~$166 million as of 12/31/17
Debt Maturities
$1,400
$1,200
(in millions)
$1,000 $450
$800
$600
$400 $735
$200 $500
$275
$‐
2018 2019 2020 2021 2022 2023 2024 2025 2026 2027 2028
Revolver Term Debt 5.375% Bonds
29APPENDIX
NON-GAAP RECONCILIATIONS
(in thousands) 2017 2016
Net income $ 215,476 $ 177,688
Interest expense 85,603 83,863
Interest income (855) (177)
Provision for taxes 1,112 71,418
Depreciation and amortization 153,222 131,876
EBITDA 454,558 464,668
Loss on early debt extinguishment 23,121 -
Net effect of swaps (45) (1,197)
Unrealized foreign currency (gain) loss (29,041) (14,345)
Equity-based compensation 13,789 18,496
Loss on impairment/retirement of fixed assets, net 12,728 12,587
Gain on sale of other assets (1,877) -
Employment practice litigation costs 4,867 -
(a)
Other 877 1,039
(b)
Adjusted EBITDA 478,977 481,248
(a) Consists of c ertain costs as defined in the Company's 2017 Credit Agreement and prior c redit agreements. These items are exc luded in
the calc ulation of Adjusted EBITDA and have included certain legal expenses, costs associated with certain ride abandonment or
reloc ation expenses and severanc e expenses.
(b) Adjusted EBITDA represents earnings before interest, taxes, depreciation, amortization, other non- c ash items, and adjustments as
defined in the 2017 Credit Agreement and the 2013 Credit Agreement. Adjusted EBITDA is not a measurement of operating performance
c omputed in acc ordance with GAAP and should not be considered as a substitute for operating income, net income or cash flows from
operating ac tivities c omputed in acc ordance with GAAP. The Company believes Adjusted EBITDA is a meaningful measure as it is widely
used by analysts, investors and comparable c ompanies in our industry to evaluate our operating performanc e on a consistent basis, as
well as more easily compare our results with those of other companies in our industry. Further, management believes Adjusted EBITDA is a
meaningful measure of park- level operating profitability and uses it for measuring returns on capital investments, evaluating potential
acquisitions, determining awards under inc entive c ompensation plans and c alculating complianc e with c ertain loan c ovenants. Adjusted
EBITDA may not be comparable to similarly titled measures of other companies.
30You can also read