9M18 Results - DIA Corporate
←
→
Page content transcription
If your browser does not render page correctly, please read the page content below

9M18 Results

Legal disclaimer
This document does not constitute a purchase, sale or exchange of securities invitation or offer, nor does it constitute advice on any securities
issued by DIA.
DIA cautions that this document contains forward-looking statements found in various places throughout the presentation and include, without
limitation, estimates, projections or forecasts relating to possible future trends and the performance of DIA. These forward-looking statements
speak only as of the date on which they are made and the information, knowledge and views available on the date on which they are made;
such knowledge, information and views may change at any time. Forward-looking statements may be identified by words such as "expects",
"anticipates", "forecasts", "estimates" and similar expressions. Current and future analysts, brokers and investors must operate only on the basis
of their own judgment taking into account this disclaimer, and must bear in mind that these estimates, projections and forecasts do not imply any
guarantee of DIA's future performance and results, price, margins, exchange rates, or other events, which is why they do not constitute a
guarantee of future compliance and are subject to risks, uncertainties and other factors beyond DIA's control and may cause that the final results
and outcome differ from those contained in said estimates, projections and forecasts. In consequence, the future results and the real
performance could differ substantially from these forecasts, projections and estimates.
The risks and uncertainties that could affect the information provided are very difficult to anticipate and predict. DIA does not assume the
obligation of publicly reviewing or updating these statements in case unforeseen changes or events occur which could affect these statements.
DIA provides information on these and other factors that could affect the business and the results in the documents it presents to the CNMV
(Comisión Nacional del Mercado de Valores) in Spain. This information is subject to, and must be read in conjunction with, all other publicly
available information.
Accordingly, these estimates, projections and forecasts must not be taken as a guarantee of future results, and the directors are not responsible
for any possible deviation that could arise in terms of the different factors that influence the future performance of the company. Neither the
company, its directors, nor its representatives shall have any liability whatsoever for any loss arising from any use of this document or its
contents, or otherwise arising in connection with this document.
This document contains some expressions (gross sales under banner, comparable growth of gross sales under banner, adjusted EBITDA,
adjusted EBIT, etc.) which are not IFRS (International Financial Reporting Standards) measures.
In addition, it is stated that the present document may contain confidential information which may be also considered inside information, which is
why the recipient of the same shall assess such circumstance and comply, where applicable, with applicable obligations under market abuse
regulations.
Index

    01   Introduction                4
    02   Business review             7
    03   Strategic Plan highlights   16
    04   Conclusions                 34
    05   Appendix                    36

                                          /3
01
Introduction
Corporate Governance update

    Antonio Coto, the new CEO of DIA
     – Joined DIA in 1986 and in 1997 appointed CEO of DIA Argentina
     – 1999: Head of Latam business (adding the leadership of Partnerships in 2010)

    Changes to the Board of Directors
     – Ms Ana María Llopis resignation as Chairwoman
     – Mr Stephan DuCharme, Mr Richard Golding and Mr Mariano Martín appointed as First, Second and
       Third Vice-Chairmans respectively
     – Mr Sergio Ferreira Dias as new Board member (also appointed to Audit and Compliance Committee)

                                                                                                        /5
15th October’s Relevant Fact

   EUR56m equity reduction in 2017 mostly attributable to Iberia
                                                          2017
    (EURm)                      2017    Adjustments                  1. Outstanding
                                                      re-expressed   supplier invoices
                                                                     deferred (EUR 18m)
   Reserves                      305        -36           269        to the next period
   Net profit of the period      110        -20            90
                                                                     2. Reversal of
   Total Equity                 326         -56           270        income provisions
                                                                     recognized in
                                                                     previous periods
   Trade and other payables     1,711       70           1,781       (EUR 18m)

   Current tax liabilities       86         -14            72        3. Overestimate of
                                                                     commercial
   Current Liabilities          2,291       56           2,347       discounts

   TOTAL EQUITY & LIABILITIES   3,626                    3,626

                                                                                          /6
02
Business
  review
2018 adjusted EBITDA outlook
Normalized adjusted EBITDA of EUR494.4m affected by:
1) IBERIA: 2) EMERGING MARKETS:
New FY 2018
• Reduced sales in a challenging competitive • Competitive environment and negative
adjusted EBITDA environment impact of transport strikes in Brazil
outook of • Increased OPEX: • Adverse FX effect
EUR350-400m Higher penetration of perishables
Additional labour costs
6.7%
5.8%
570.3 -26.5
543.8 -49.4 ≈5.0%
494.4 ≈-45-55
≈-5-15 ≈-15-25 ≈-30-50
350-400
Margin (%)
1. After discontinuation of Cash&Carry (EUR1.8m) FY 2017 Re-expressed2 FY 2017 2017 FY 2017 Spain Portugal Operational FX New FY 2018E
2. Spain commercial discounts overstimated Adjusted adjusted other adjusted adjusted EBITDA
3. One-off income occured in 2017 but not EBITDA EBITDA items3 EBITDA Latam (before IAS29)
replicated in 2018 such as gain on sales of reported1 re-expressed normalized
warehouse call options, income related to China
and changes in tax regulation
/8Group gross sales under banner
EURm
Change +2.7% -0.1% +2.6% -11.6% -9.0%
+206.3 -7.6 7,838.9 -889.6
7,640.2
6,949.3
9M 2017 LFL Space 9M 20181 FX & calendar 9M 2018
effect2 (before
IAS29)
1. Ex-FX and ex-calendar effect
2. Calendar effect -0.1% /9Iberia gross sales under banner LFL performance after remodellings
+21.7%
+7.9%
EURm
Change -0.3% -2.2% -2.5% +0.4%
-1.8%
DIA DIA La
4,834.6 -14.5 -106.4 Market Maxi Plaza
DIA&Go
4,713.3
Spain sales performance per category
(9M 2018 vs 9M 2017)
+3.5%
9M 2017 LFL Space & 9M 2018
calendar effect1
-6.9%
National Private
brand label
Ambient Fresh &
sales Perishables
-5.2%
-8.5%
1. Calendar effect -0.1% / 10Emerging Market gross sales under banner
EURm
Change +7.3% +4.2% +11.5% -31.8% -20.3%
+204.8 +117.8 3,128.3 -892.2
2,805.7
2,236.1
9M 2017 LFL Space 9M 20181 FX & 9M 2018
calendar (before
effect2 IAS29)
1. Ex-FX and ex-calendar effect
2. Calendar effect -0.2% / 11Normalized adjusted EBITDA breakdown
EURm
353.3 -17.3 -27.9 308.1 -27.0 281.1
9M 2017 Iberia Emerging 9M 2018 IAS29 9M 2018
normalized1 Markets (before
IAS29)
1. Normalized adjusted EBITDA margin: Restated and excluding 2017 one-off items (EUR16.9m) / 12Normalized adjusted EBITDA margin
% DIA Group
Iberia Emerging
6.5%1 5.5%1
6.3% 3.9% 5.4%
3.4%
9M 2017 9M 2018 9M 2017 9M 2018 9M 2017 9M 2018
With IAS29
Iberia Emerging DIA Group
6.5%1 5.5%1
6.3% 3.9%
2.2% 5.1%
9M 2017 9M 2018 9M 2017 9M 2018 9M 2017 9M 2018
1. Normalized adjusted EBITDA margin: Restated and excluding 2017 one-off items (EUR16.9m) / 13Evolution of capex
≈ EUR350m
211.3
131.6
87.1 57.8
Iberia EM Iberia EM Iberia EM
FY 2018
9M 2017 9M 2018 outlook
/ 14Net debt at EUR1.4bn at 30 September 2018
EURm
1,422
1,141
September 2017 September 2018
/ 1503
Strategic
Plan
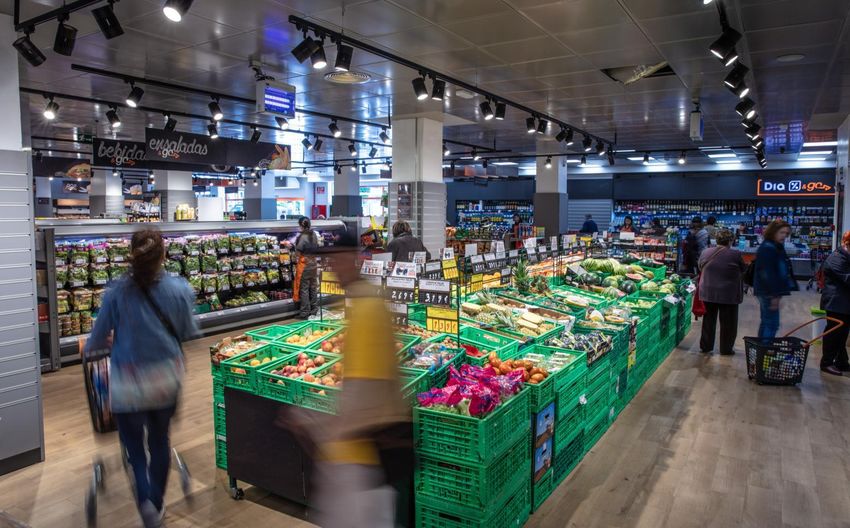
highlightsProximity store: the most resilient format and expected to
drive global food retail growth in the mid-term
Current trends in the global food retail sector… …support DIA’s long-term strategic positioning
Mature markets Emerging markets
3.0% 3.0% 3.0%
• Ageing population
• Higher shopping frequency • Increase of urban population
Low
•
1.0% 1.0% 1.0%
Less people per home / • Rise of middle class Hard
reduced storage capacity discounters
• Rise of transportation costs
• Value-for-money approach
CAGR '11-'16 • Rising personnel
CAGR '16-'21 costs call for efficient
• Unemployment remains high in formats
certain geographies
Price
Hypermarkets
Spain Brazil Argentina Supermarkets
6% 10% 13% 13% 13%
8%
High
Department Convenience
4%
5% stores
2%
Attraction Proximity
CAGR '17-'22 CAGR '17-'22 CAGR '17-'22 Format
Convenience & Discount Hypermarkets Supermarkets
Source: Euromonitor (growth in nominal terms)
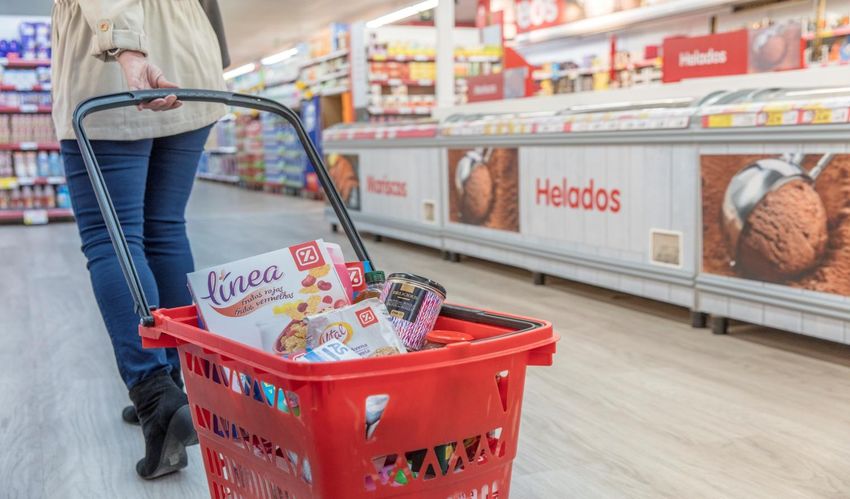
/ 17Spanish consumers, with less and less time, have a growing
need for proximity, having become the main shopping driver
Respondents (%) 2010
+20
2015
65 67 66 2016
57 57 58
48 49
45
29 28
22 25 25 25
Proximity/Ease Quality Price Product choice Customer attention
(ex-promotions)
Source: MAPAMA; Company information; BCG Analysis
/ 18DIA strategy focus
Transform grocery Continue selective Analyse potential
business in Iberia self-funded growth in strategic alternatives
Latam for non-core businesses
Top layers of management already appointed, fully committed with the
implementation of the new strategy
/ 19Strategic approach: Spain
Strong pillars to become a winning model in Spain
Create a differentiated commercial offering
Optimize value perception through a new
promotional effort
Implementation of an improved operating model
Openings in targeted regions, profitable
refurbishment programme with higher uplift potential
and closings of non-performing stores
Launch of profit boosting initiatives that supports
refurbishment plan and reduce leverage
/ 20We have strong pillars to achieve our ambition (I)
DIA is #3 player in the market, driven by large household penetration and number of trips
Key levers driving retailers' market share1
Household penetration (%) Frequency, #trips per HH Avg. household expenditure per trip Value market share per retailer (%)
1 1 3 1
2 9 1 2
3 5 6 3
4 8 8
6 6 5
5 10 2
8 2 7
9 9
4
7 10
11
10
7 4
11
3 11
0 50 100 0 10 20 30 40 0 10 20 30 40 0 10 20 30 40
Source: Kantar "Informe clientele DIA 2017", Company information
Note: Retailers sorted according to their respective share of wallet. DIA includes all DIA banners (Market, Maxi, Supermarkets and Clarel). Does not include perishable fresh.
1. PGC market size, not including perishable fresh / 21We have strong pillars to achieve our ambition (II)
Being #2 retailer in terms of share of wallet
Share of wallet1 of main grocery retailers
(%)
40
30
20
10
0
Source: Kantar "Informe clientela DIA 2017", Company information
Note: Not including perishable fresh. DIA includes all DIA banners (Market, Maxi, Supermarkets and Clarel)
1.Share of wallet measures how much the average grocery retail customer spends at each retailer
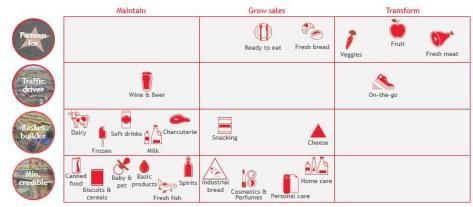
/ 22New DIA's commercial offering to be built around strong
fresh focus, state of the art own & exclusive brand and
customer-centric assortment
1 Identify priorities 2 Define category strategy 3 Set range & space
Set roles (importance of the category Leverage shopping missions and
Deep customer research to within the value proposition) & intents roles & intents to allocate space and
determine what clients are (business objective for the category), define assortment for each new
demanding from us build hero categories format, including hero products
Assortment
Maintain Grow sales Transform
Top-class fresh offering, • Think of units of need leveraging big
Famous
data
both in quality and for
• Use own brand to optimize range and
assortment Traffic
driver
provide unique reason to shop at DIA
• Create hero products
Basket
Space
builder
Innovative and • Understanding product elasticities and
Min.
differentiated private label credible
return on space
• Considering direct product profitability
Source: Company information / 23DIA is developing winning store formats that cover
customer missions
Each customer has different types of DIA is developing the winning store formats
shopping missions, defined by: to satisfy customer missions
Focus on next meal and Focus on next meal and
1 Stock-up on-the-go stock-up
• Close from home • A "value supermarket"
• Healthy / fresh / High- model
quality products • Fresh at its best
• Innovative experience,
• Staff focused on
2 Next Meal
through product and
general modernity customer service
• Convenient experience, • Adequate FMCG and
without stress HPC assortment
• Good service
3 On-the-go1
1. On-the-go mission defined as food/drinks for immediate consumption, off premises / 24New Dia&Go and La Plaza: successful seeds
Monthly LFL sales evolution Monthly LFL sales evolution
11.0%
31.3%
27.0%
25.6% 8.9% 8.7% 8.0%
22.9%
7.5% 7.4%
20.8%
6.8% 6.7%
21.9% 17.6%
Jan-18 Feb-18 Mar-18 Apr-18 May-18 Jun-18 Jul-18 Aug-18 Jan-18 Feb-18 Mar-18 Apr-18 May-18 Jun-18 Jul-18 Aug-18
Source: Company information
/ 25Optimize value perception through lower promotional
intensity and personalized promos
From… …to
• Hi-Lo complex pricing strategy with limited
personalization
• Promotional activity sometimes resulting in Mid-Lo strategy where we Improve own brand
limited product availability (hard to keep invest on shelf prices (to recognition while
drive perception) and differentiating our branded
promo products on shelves)
optimize ineffective offering, increasing value
promos for money perception
• Better prices than competitors only visible
through loyalty in many cases and not in
shelfprice
• As a consequence, price leadership not Shift towards personalised Understand category
translated into price or value perception promotions strategy and roles & intents
to prioritize investment in
pricing
/ 26New proposition to be supported by improved
operating model
Cutting-edge technology
Optimized E2E operations Updated franchise model
advantages
• Review supply chain
(more deliveries to
enable fresh) • Relaunch new agreements • Self checkouts freeing
(incentives and level of sales surface and
• Develop new store control) speeding-up shopping
operating model trips
(replenishment, • Support franchisees in
customer service) implementing and • Big data to leverage
maintaining standards internal data (especially
• Adapt commercial model from loyalty card) to
and product • Personalized training optimize operations
breadth/depth to drive
higher availability
/ 27Strategic approach: Portugal
Replicate the model of Spain
(commercial offering, value stack / personalised
promos and improved operating model)
Limited openings and major refurbishments
(targeted to key areas and stores with higher growth
potential)
Immediately launch profit boosting initiatives to
maximise cash flow generation
/ 28Strategic approach: Brazil
Prioritize expansion in regions where DIA has a
winning and profitable model
Improve attractiveness of stores to attract more
customers
Improve fresh food offering to increase customer
value proposition
Reduce stock-outs which are a major point of customer
dissatisfaction
/ 29Strategic approach: Argentina
Conservative approach to store network expansion.
Potential for accelerated self-funded growth if macro
backdrop stabilizes
Specific cost efficiency measures (enhancement in
technology, apps and training aimed at equipping
franchisees)
Increase bet on perishable, winery and beauty
Maintain the #1 position in Private Label in the market
/ 30Long-term financial outlook
Transformed model to underpin healthy growth in the future
2019; a transition year 2020 – 2023; confirming turnaround
Sharpen our commercial model and
Mid-single digit TOP LINE GROWTH
optimise operating performance
EBITDA upturn in 2020E and healthy
growth thereafter benefiting from
Launch profit boosting initiatives
top-line growth and significant
operating leverage
CAPEX at 3.5%-4.0% in the
Contained CAPEX deployment
2020-2023 period to roll-out our new
(below EUR200m)
winning commercial model
/ 3104 Conclusions
Conclusions
  New strategic focus to gravitate around the customer
  Our business has great
                     fundamentals and enjoys an outstanding supplier
  base and franchisee network that will deliver solid and sustainable results

  We are building up a   top-class leadership team and an efficient corporate
  organisation around it

  We are conscious of the challenging situation that we are navigating and understand
  that we need to be disciplined in capital allocation and deleverage

  The new Strategic Plan is unanimously backed by the Board of
  Directors of DIA

                                                                                        / 33
05 Appendix
Gross sales under banner by country

                                                                     FX     Change
(EURm)             9M 2017     %      9M 2018     %      Change
                                                                   effect   (ex-FX)
Spain              4,194.1   54.9%    4,094.0   58.9%    -2.4%       -       -2.4%

Portugal            640.5     8.4%     619.3     8.9%    -3.3%       -       -3.3%

IBERIA             4,834.6   63.3%    4,713.3   67.8%    -2.5%       -       -2.5%
Argentina          1,306.8   17.1%    1,023.3   14.7%    -21.7%    -47.8%    26.1%
Brazil             1,498.9   19.6%    1,212.8   17.5%    -19.1%    -17.5%    -1.6%
EMERGING MARKETS   2,805.7   36.7%    2,236.1   32.2%    -20.3.%   -31.6%    11.3%

TOTAL DIA          7,640.2   100.0%   6,949.3   100.0%   -9.0%     -11.6%    2.6%

                                                                                      / 35
Currency performance
(%) EUR/ARP
EUR/BRL
16.4
6.5
-2.5
-7.6 -7.4
-12.2
-17.8 -19.7 -16.1
-17.5
-19.0
-30.9
-37.5
-44.0
Q2 2017 Q3 2017 Q4 2017 FY 2017 Q1 2018 Q2 2018 Q3 2018
SOURCE: Bloomberg average currency rates (a negative change in exchange rates implies a depreciation versus the Euro) / 36Gross Sales Under Banner & adjusted EBITDA by segment
9M 2017 Gross sales under banner 9M 2018 Gross sales under banner
Iberia 63.3% Iberia 67.8%
Emerging 36.7% Emerging 32.2%
9M 2017 adjusted EBITDA 9M 2018 adjusted EBITDA
Iberia 75.5% Iberia 87.3%
Emerging 24.5% Emerging 12.7%
/ 37IAS29: Financial Reporting in Hyperinflationary Economies
The Company applied the IAS29 accounting standards for its Argentinian
accounts for the first time in 30th September 2018
Net gain of inflation in monetary items increases the net
income by EUR13m and
the net equity by EUR58m but decreases adjusted EBITDA by EUR27m
Following the strict application of the IAS29 non-monetary balance sheet
items are adjusted by the underlying inflation
/ 38PARQUE EMPRESARIAL DE LAS ROZAS
Jacinto Benavente, 2 A
Las Rozas (Madrid) Spain - Post Code: 28232
+34 91 398 54 00
www.diacorporate.comYou can also read