CEO Strategic Update
Ford Motor Company | October 3, 2017
←
→
Page content transcription
If your browser does not render page correctly, please read the page content below
CEO Strategic Update Ford Motor Company | October 3, 2017
Jim Hackett | CEO
Ford Motor Company

Our solid profits allowed us to distribute
    over $15 billion to shareholders since 2012
                                                                              Billions

           Supplemental Dividend
                                                                                                  $15.4
                                                                                                               $1.2
           Anti-Dilutive Share Repurchases
           Regular Dividends                                                                       $2.7

                                                                                                   $11.5
                                                                       $3.5
                                  $2.3                                        $1.0       $2.7
                                                           $0.6
                                    $1.7                               $2.4              $2.4

                            Average                                    2016              2017*   2012 - 2017
                           2012 - 2015

     * Assumes 2017 regular dividends of $0.15 per share per quarter

3
We have grown the business but have fallen
    short of our 8% automotive operating margin goal
               Automotive Revenue (Billions)                       Automotive
                 and Volume (Thousands)                          Operating Margin

     Automotive Revenue
     Wholesale Volume

                                  $142
                                          6,651                  8%+ Target
                      4,866                              6.1%
        $104
                                                                                             6.7%
                                                                                   4.6%

                                                  (0.7)%
                2009                  2016        2009   2010   2011 2012   2013    2014   2015 2016

4
Jim Farley
President, Global Markets

Joe Hinrichs
President, Global Operations

Marcy Klevorn
President, Mobility

Bob Shanks
Chief Financial Officer

Five principles we need to act on:

    1. Ford will prepare for disruption by becoming fit

    2. We will be in the vehicle business – moving both people and goods

    3. Our vehicles will be smart and connected

    4. These smart vehicles will thrive in a new transportation operating system

    5. We will evolve to capitalize on new business opportunities within this
       transportation operating system

6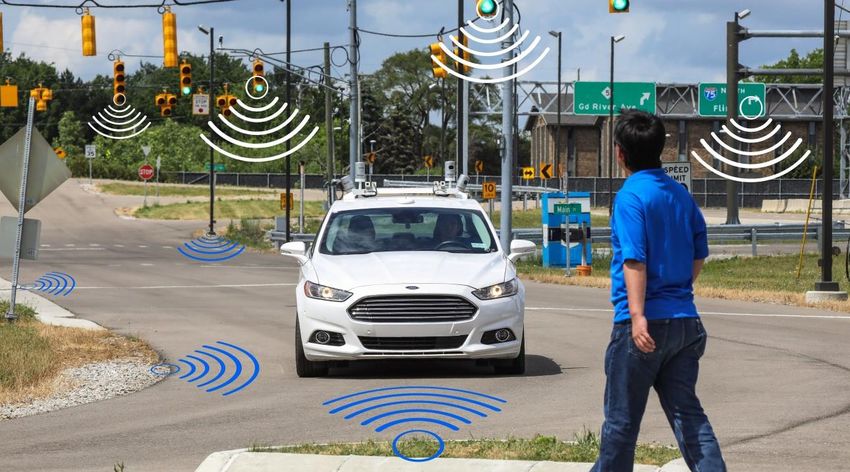
Since the Great Recession, our industry enjoyed strong
    demand…
                                                          U.S. Industry Volume (Millions)*

                                                                                                    17.8   17.9
                                                                                             16.8
                                                                                  15.9
                                                                        14.8
                  13.5
                                                             13.0
                                                   11.8
                                            10.6

                 2008                       2009   2010       2011      2012      2013       2014   2015   2016
     * Includes Medium and Heavy vehicles
7
…and we achieved record levels of profitability

                          Ford Adjusted Pre-Tax Results (Billions)

                                                      $10.1             $10.8   $10.4
                                 $9.3      $8.9
                       $8.2
                                                                 $7.3

                $-

       $(7.3)

       2008     2009   2010       2011      2012      2013       2014   2015    2016

8
We need to be able to navigate
    the now, near and far
                                       FAR
                                NEAR
                     NOW

9
A new type of clock for CEOs

                                     FAR
                                    NEAR
                                    NOW

10
A new type of clock for CEOs 11
A new type of clock for CEOs

               NOW            NEAR   FAR

12
We cannot compete for the future unless
we get fit today
13Our first priority is to reset revenue and attack costs 14
Our costs have grown as fast as revenue;
     capital spending has grown even faster
                             Automotive Revenue and                                                          Capital Spending
                               Total Cost Growth*                                                      as Percentage of Net Revenue

                                                                                                                            5.4%
                                                                                                                                          4.9%

                                                                                                3.5%
                    30%                                                        29%
                     Growth                                                     Growth

            2010      2016                                             2010      2016           2010   2011   2012   2013   2014   2015   2016
             Auto Revenue                                                Total Cost

      * Adjusted data; includes China Joint Ventures at share; excludes Parts and Accessories

15
We established Global Markets
and Global Operations organizations
• Promote better accountability across the markets
• Enable more effective cost reduction
• New industrial model for the next generation of vehicles
• Have already launched profit improvement and spending
reduction initiatives
16We are reducing the pace of cost growth
Automotive Cost Performance Future 5-Year Incremental Efficiencies
Product
Engineering
$4
Billion
Automotive
Cost Growth
50% Material
Cost
$10
Billion
2010 - 2016 2017 - 2022
17We are also addressing the need for a
fundamental redesign of our operations
18Not only one-time savings but also
compounding improvements
Profits
Time
19Our re-imagined F-Series yields
great results now and in the future
F-Series Progress 2014 - 2017
Share 1.7 ppts
Average Transaction Price 16%
F-150 Weight 700 lb
F-150 Fuel Economy up to 19%
+ CAFE positive
Next-Generation F-Series
90% manufacturing equipment re-use
Remains positive to CAFE
20We are regaining focus on what our customers
value the most and reducing complexity
Orderable Combinations
Current Model
Forward Model 35,000
360 2,302
1,168
672
26 228 96
Focus Escape Fusion Explorer
21We are also taking a hard look at our product
development process to improve efficiency
New Vehicle Product
Development Time 20% Change-over Time 25%
22Internal combustion spending will be re-deployed
into electrification for future demand
Internal Combustion Reinvest Into Electrified Powertrains
Engine Powertrain Capital
Architectures Spending (Bils.)
17 $1.7
12 $1.2
$$$
29% 32%
Decline Decline
2016 2022 2016 2022
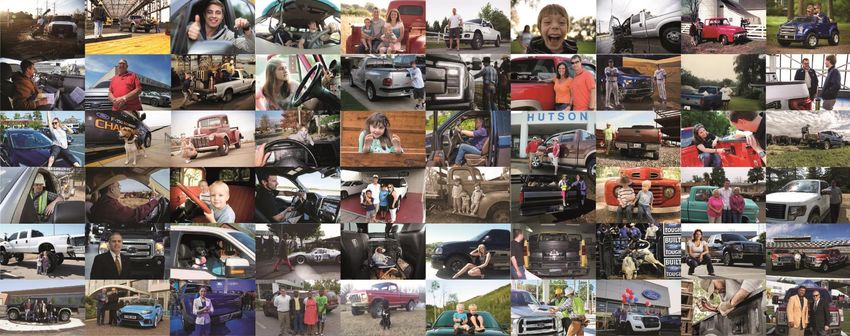
23Factory of the Future promises smaller footprints,
faster logistics and closer customer contact
24Understanding our future starts with
a winning aspiration
25Our vision for the future
Ford Motor Company was built on the belief
that freedom of movement drives human progress.
It’s a belief that has always fueled our passion
to create great cars and trucks.
And today, it drives our commitment to become the world’s most
trusted mobility company, designing smart vehicles for a smart
world that help people move more safely, confidently and freely.
Smart Vehicles in a Smart World
2627
People have passion for their vehicles

28
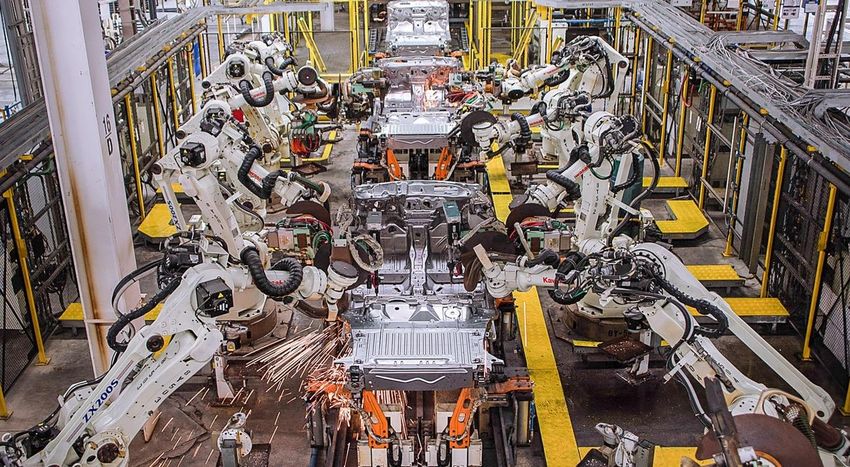
Vehicles can enable technology with passion

29
It is more than mobility…
     it is mobility with passion

30
There are many more choices for where
we play and how we win
WHAT IF A CITY MOVED WITH THE
RHYTHMS OF ITS INHABITANTS?
INTRODUCTION OF FULLY ELECTRIFIED VEHICLE
AUTONOMOUS SAE LEVEL POPULATION INCREASES
4-CAPABLE VEHICLES
EBIKES
WIRELESS
CHARGING
CROWD-SOURCED DYNAMICALLY-
ROUTED SHUTTLE SERVICE
31There are persistent forces that will help us
make the choices to move from Now to Far
THE CITY OF TOMORROW, DECADES
ADVANCED, HIGH-SPEED MASS TRANSIT
AND DECADES FROM NOW.
VEHICLES ROUTED AROUND
PEDESTRIANS AND EACH OTHER SIGNIFICANT POPULATION OF
FULLY AUTONOMOUS VEHICLES
PARKING CUT TO ALLOW RE-USE
IMPROVED WALKABILITY
32Focusing on strategic choices 33
Investing now in the understanding of use
     is the gift that will keep on giving

34
Recent advances in deep learning
are breathtaking
35Deep learning will help us understand vehicle
interactions to optimize autonomous vehicles
36Environments will actually communicate
to the vehicles
37There will be a variety of propulsion choices
but electrification will become more common
Global Industry 2017 Global Industry Outlook 2030
Internal Combustion Engine (ICE) Hybrid Electric Vehicle (HEV) Battery Electric Vehicle (BEV) / Plug-in Hybrid (PHEV)
38Advanced propulsion systems need to offer
passion and intimacy
39City of Tomorrow Video
Smart Vehicles in a Smart World
                                           AUTONOMOUS                           ROAD USER
                                               VEHICLES                         CHARGING

                                  CONNECTED                                                DYNAMIC
                                    VEHICLES                                               SHUTTLE

                         INTEGRATED FARE                                                       REAL-TIME TRAFFIC
                            MANAGEMENT                                                         MANAGEMENT

                              MULTI-MODAL                                                   INCENTIVES
                           TRANSPORTATION                                                   (DISCOUNTS, TRAVEL,
                                SOLUTIONS                                                   VOUCHERS, ETC.)
                                 PERSONAL TRAVEL                                    SMART
                                  ASSISTANT APPS                                    PARKING

                                  REAL TIME TRAVELLER INFO                  RIDE SHARING

                                                             BIKE SHARING
      Source: Deloitte

41
Flexibility and partnerships enable agility
Ford Transportation
Microtransit
Fleet Dynamic incl.
Customer Management FordPass
Shuttle
as a Service
Non-Emergency
Digital Services And more…
(incl. ride hailing)
Medical Transport
Solutions
Management
Notifications
And more…
Telemetry
Telemetry
Payments
Inventory
Analytics
Partner
Mapping
Routing
Identity
Vehicle
Device
Data
Solutions
Core Services
Cloud Connectivity
and Big Data
42Connectivity Non-Emergency Medical Transport Chariot FordPass and Digital Services Platform
Evolving our portfolio to optimize returns

                  Utilities             Leverage regional strengths
                  Play to Win

                  Commercial Vehicles
                                        Build on leadership: F-Series, Ranger and Transit
                  Leadership

                  Cars
                                        Profitable subsegments and value partnerships
                  Smart plays

                  Powertrains
                                        Simplify and partner ICE and diversify electrification
                  Pivot to BEVs

44
Accelerating pure electric vehicle portfolio
• Profit driven
• New Zotye BEV MOU and other alliances
• New dedicated BEV team - Team Edison
• Expanded BEV line-up post 2020
• End-to-end business model change from
design through ownership
• …more to come
45On-track for production ready AV business
• Business model driven:
People, Goods, Content
• Human-centered design
• Argo AI: On-track with scalable
and production ready tech
• Max utilization: HEV, commercial
durability, flexible vehicle format
• Expanding tech and future commercial
business partnerships
46We are redesigning our industrial model
for smart vehicles in a smart world
Today Tomorrow
Deep • Machine Learning
Learning
• Artificial Intelligence
Lean Manufacturing Data • 3D Printing
• Virtual Factory
Capital • Manufacturing 4.0
47BEV product simplification yields floor space
and capital efficiencies
Current State – Final Assembly Future State – Final Assembly
Benefits vs. ICE
PRE-DELIVERY
• 50% reduction in footprint
TRIM / CHASSIS /
PRE-DELIVERY • 50% reduction in capital
CHASSIS
investment
• 30% reduction
in hours per unit
Open Space for
Battery
• Flexible tooling / process
TRIM
Assembly and
BEV Power fully scalable and
Components
reconfigurable to support
increase in demand
48Improving time to market and engineering efficiency
Total Time
To Market Incl. Top Hat
Platform Time To Market Cumulative Engineering Efficiency (Billions)
$4.0
Lower is
Better Cumulative Savings
2016 2017 2018 2019 2020 2021 2022
49Financial update
• Remain committed to investment-grade balance sheet
• Strong shareholder distributions via unchanged distribution strategy
• Continue to be focused on:
– Growth … grounded in analytically risk-assessed assumptions
– 8%+ Automotive operating margin
– ROIC in excess of cost of capital
– Top-quartile total shareholder return
• 2017 guidance unchanged; 2018 outlook to be provided in January
• Ford Credit … a strategic asset that continues to perform well.
New opportunities ahead as Ford transforms
50We will accelerate the introduction
of connected, smart vehicles and services
New Ford Vehicles Connected – U.S. Take Rate New Connected Vehicles
100%
55% 90%
Globally By 2020
2018 2019
51We will rapidly improve our fitness to lower
costs, release capital and finance growth
New Partnerships in Emerging Markets Global Lincoln Sales (000)
159
India and EM 108
Partnership
47%
Growth
China Low 2014 2016
Cost BEV
Global Lincoln Quality
2013 2017
Yusheng Low
Cost Utility Initial Quality Survey #9 #4
APEAL #9 #6
52We will re-allocate capital to
where we can win in the future
Re-allocating $7 Billion of Capital from Cars to SUVs and Trucks
$7
Billion
Fewer Nameplates / Lower Spend New SUVs and Trucks Investment
• North America Ranger – 2018
• All-new Bronco – 2020
• Three other vehicles including BEV SUV North America
EcoSport - 2018
53We will continuously innovate to create
the most human-centered mobility solutions
54We will empower our team to work
together effectively to compete and win
55Risk Factors
Statements included or incorporated by reference herein may constitute “forward-looking statements” within the meaning of the Private Securities Litigation Reform Act of 1995. Forward-looking
statements are based on expectations, forecasts, and assumptions by our management and involve a number of risks, uncertainties, and other factors that could cause actual results to differ
materially from those stated, including, without limitation:
Decline in industry sales volume, particularly in the United States, Europe, or China, due to financial crisis, recession, geopolitical events, or other factors;
Lower-than-anticipated market acceptance of Ford’s new or existing products or services, or failure to achieve expected growth;
Market shift away from sales of larger, more profitable vehicles beyond Ford’s current planning assumption, particularly in the United States;
Continued or increased price competition resulting from industry excess capacity, currency fluctuations, or other factors;
Fluctuations in foreign currency exchange rates, commodity prices, and interest rates;
Adverse effects resulting from economic, geopolitical, protectionist trade policies, or other events;
Work stoppages at Ford or supplier facilities or other limitations on production (whether as a result of labor disputes, natural or man-made disasters, tight credit markets or other financial distress,
production constraints or difficulties, or other factors);
Single-source supply of components or materials;
Labor or other constraints on Ford’s ability to maintain competitive cost structure;
Substantial pension and other postretirement liabilities impairing liquidity or financial condition;
Worse-than-assumed economic and demographic experience for pension and other postretirement benefit plans (e.g., discount rates or investment returns);
Restriction on use of tax attributes from tax law “ownership change;”
The discovery of defects in vehicles resulting in delays in new model launches, recall campaigns, or increased warranty costs;
Increased safety, emissions, fuel economy, or other regulations resulting in higher costs, cash expenditures, and/or sales restrictions;
Unusual or significant litigation, governmental investigations, or adverse publicity arising out of alleged defects in products, perceived environmental impacts, or otherwise;
Adverse effects on results from a decrease in or cessation or claw back of government incentives related to investments;
Cybersecurity risks to operational systems, security systems, or infrastructure owned by Ford, Ford Credit, or a third party vendor or supplier;
Failure of financial institutions to fulfill commitments under committed credit and liquidity facilities;
Inability of Ford Credit to access debt, securitization, or derivative markets around the world at competitive rates or in sufficient amounts, due to credit rating downgrades, market volatility, market
disruption, regulatory requirements, or other factors;
Higher-than-expected credit losses, lower-than-anticipated residual values, or higher-than-expected return volumes for leased vehicles;
Increased competition from banks, financial institutions, or other third parties seeking to increase their share of financing Ford vehicles; and
New or increased credit regulations, consumer or data protection regulations, or other regulations resulting in higher costs and/or additional financing restrictions.
We cannot be certain that any expectation, forecast, or assumption made in preparing forward-looking statements will prove accurate, or that any projection will be realized. It is to be expected that
there may be differences between projected and actual results. Our forward-looking statements speak only as of the date of their initial issuance, and we do not undertake any obligation to update or
revise publicly any forward-looking statement, whether as a result of new information, future events, or otherwise. For additional discussion, see "Item 1A. Risk Factors" in our Annual Report on Form
10-K for the year ended December 31, 2016, as updated by subsequent Quarterly Reports on Form 10-Q and Current Reports on Form 8-K.Appendix
Reducing global material cost by an
     incremental $10 billion through 2022
                        2018 - 2022 Plan by Workstream (Billions)

          $10 billion

             Total          New Model              Current          Complexity
                           Product Cost           Model Cost
                                                  Reductions
59
You can also read