CHanalysis 2016 Meeting of Swiss Analytical Scientists November 18-19, 2016 Dorint Hotel Beatenberg Organized by the Division Analytical Sciences ...
←
→
Page content transcription
If your browser does not render page correctly, please read the page content below
CHanalysis 2016
    Meeting of Swiss Analytical Scientists
          November 18–19, 2016
          Dorint Hotel Beatenberg

Organized by the Division Analytical Sciences
       of the Swiss Chemical Society
Cover picture: Copyright Alena Tierbach, Eawag
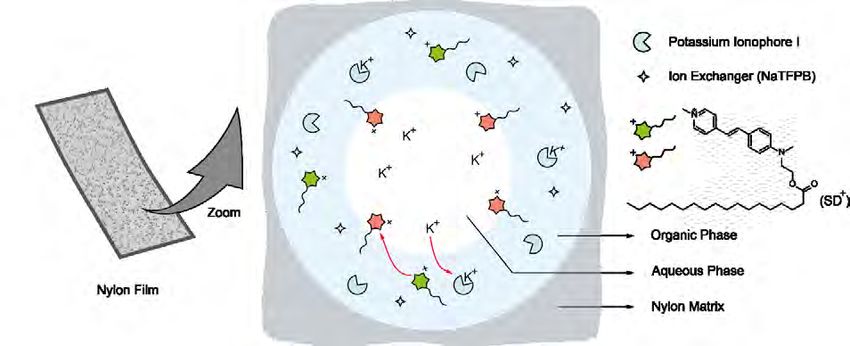
Table of contents
General Information .  .  .  .  .  .  .  .  .  .  .  .  .  .  .  .  .  .  .  .  .  .  .  .  .  .  .  .  . 5
Scientific Program.  .  .  .  .  .  .  .  .  .  .  .  .  .  .  .  .  .  .  .  .  .  .  .  .  .  .  .  .  .  6
Abstracts of Oral Presentations.                  .    .    .    .    .    .    .    .    .    .    .    .    .    .    .    .    .    .    .    .    .    . 9
  Session 1.  .  .  .  .  .  .  .  .  .  .  .     .    .    .    .    .    .    .    .    .    .    .    .    .    .    .    .    .    .    .    .    .   11
  Session 2.  .  .  .  .  .  .  .  .  .  .  .     .    .    .    .    .    .    .    .    .    .    .    .    .    .    .    .    .    .    .    .    .   14
  Session 3.  .  .  .  .  .  .  .  .  .  .  .     .    .    .    .    .    .    .    .    .    .    .    .    .    .    .    .    .    .    .    .    .   20
  Session 4.  .  .  .  .  .  .  .  .  .  .  .     .    .    .    .    .    .    .    .    .    .    .    .    .    .    .    .    .    .    .    .    .   24
Abstracts of Poster Presentations.  .  .  .  .  .  .  .  .  .  .  .  .  .  .  .  .  .  .  .  . 33

                                                                                                                                                                 3
4
General Information
Organizing Committee:
  Ernö Pretsch, ETH Zürich
  Ralph Schlapbach, Universität Zürich, ETH Zürich
  Marc Suter, Eawag

Scientific Advisory Board:
   Franka Kalman, HES-SO Valais-Wallis
   Veronika Meyer, Empa St. Gallen
   Götz Schlotterbeck, Fachhochschule Nordwestschweiz, Muttenz

Conference Office
  Lilo Weishaupt
  c/o Eawag
  Überlandstrasse 133
  CH-8600 Dübendorf
  Phone: 058 765 52 00
  E-mail: infodas@eawag.ch

Participation fee (includes meals and accommodation)
   Regular fee: CHF 300.–
   Students including PhD students: CHF 100.–

                                                                 5
Scientific program

Friday, November 18, 2016

12.00   Lunch

Session 1 Chair: Gérard Hopfgartner, University of Geneva
14.00 Conference opening, Gérard Hopfgartner, University of Geneva
14.15 Karin Mölling, University of Zürich
       The amazing world of the viruses
15.00 Bernhard Blümich, RWTH Aachen University
       Compact NMR
15.30 Stefan Reimann, Empa Dübendorf
      Measurements of new halogenated greenhouse gases at the high-
      alpine site Jungfraujoch using a GC-quadrupole- and a GC-TOF-
      MS

16.00 Coffee break

Session 2 Chair: Götz Schlotterbeck, FHNW Muttenz
16.30 Davide Bleiner, EMPA, Dübendorf
       Table-top X-ray laser chemical imaging
16.45 Ralf D. Dumler, University of Basel
       Open hardware miniature plasma ion source for ambient
       ionization mass spectrometry
17.00 Lu Wang, University of Geneva
       Reversible pH-independent optical potassium sensor with
       lipophilic solvatochromic dye transducer on surface modified
       microporous nylon
6
17.15 Nadezda Pankratova, University of Geneva
Fluorinated tripodal compounds as receptors for potentiometric
chloride detection in biological fluids
17.30 Carla Rigling, ETH Zürich
Studying the conformational ensemble of β3/β2-peptides using
ROEs, J-couplings and RDCs
17.45 Myriam Guillevic, METAS, Bern
SI-traceable standards for at mospheric monitoring of F-gases
18.00 Poster session
20.00 Dinner
21.30 Get-together party
Saturday, November 19, 2016
Session 3 Chair: Marc J-F Suter, Eawag, Dübendorf
09.00 Hubert Girault, EPFL, Sion
Electroanalytical chemistry: From bio-imaging to ionisation
methods for mass spectrometry
09.30 Rolf Kipfer, Eawag, Dübendorf
Real-time noble gas analysis in the field, black smokers, and the
paleocene-eocene-thermal maximum
10.00 Edith Schallmeiner, Novartis, Basel
Near patient testing
10.30 Coffee break
Session 4 Chair: Franka Kalman, HES-SO Sion
11.00 Yingdi Zhu, EPFL, Lausanne
Sensitive and fast identification of bacteria in blood samples by
immunoaffinity mass spectrometry: a quick BSI diagnosis tool
711.15 Sophie Bravo-Veyrat, University of Geneva
Simultaneous quantification of reduced and oxidized glutathione
in biological samples with a high-throughput differential mobility
spectrometry-mass spectrometry (DMS-MS) method
11.30
Debora Käser, ETH, Zürich
A comparison of UV-ns-LA and UV-fs-LA-ICP-MS for the
analysis of Si-based geological samples
11.45 Joanna Hajduk, ETH Zürich
Monitoring of antibody glycosylation pattern based on microarray
MALDI-TOF mass spectrometry
12.00 Michel Raetz, University of Geneva
LC-SWATH/MS Metabolomics platform with hyphenation of
extraction and analysis of polar and non-polar metabolites in
plasma
12.15 Christian Berchtold, Fachhochschule Nordwestschweiz, Muttenz
Automated dried blood spot analysis by LC-MS for newborn
screening, challenges and opportunities
12.30 General Assembly of the Division Analytical Sciences (DAS) of
the Swiss Chemical Society
13.00 Lunch
14.00 End of the meeting
8Abstracts of
Oral Presentations
910
Session 1
                                  The amazing world of viruses
                                        Karin Moelling
                    Institute of Medical Microbiology, University of Zürich
                    and Max Planck Institute of Molecular Genetics, Berlin
Influenza, AIDS, Ebola, Zika: Viruses are normally defined as pathogens. This is a result of
the history of medicine. Most viruses are, however, not enemies. New technologies such as
sequencing have resulted in a surprising and unexpected new view of the world of viruses.
Viruses are ubiquitous in the oceans, our environment, even in the smog of Peking and in the
clouds, in all living organisms, in and on our body, they are even part of our genome - not only
ours but of all organisms. We came much much later, they arose about 3.8 billion years ago
(perhaps as viroids). What is the role of viruses to allow them to stay inside our genomes for
hundred millions of years? They protect us!
Furthermore, sequencing revealed that we are all related, the mechanism of gene exchange led
to a complex mixture of genes from all microorganisms populating a being. In 2010 sequencing
resulted in another surprise, the microbiome was discovered, the coexistence of viruses but also
of bacteria and fungi. They contribute many more genes to our organism than our inherent
genes. Their role in the guts has become a focus of research.
Viruses can modify their host, possibly useful for therapies. CRISPR/Cas9 is only one example.
Are viruses alive? This will be discussed also in the light of the newly discovered giant viruses.
How did viruses arise, how do they evolve, how do they drive evolution, are they our oldest
ancestors? We are the invaders in the world of microorganisms – not the other way round.
Viruses are a general model how innovation occurs!

                                                                                               11
Session 1
Compact NMR
Bernhard Blümich
Institut für Technische und Makromolekulare Chemie, RWTH Aachen University,
Aachen, Germany
The most striking component of nuclear magnetic resonance (NMR) spectrometers for
chemical analysis used to be a large super-conducting magnet, confining NMR spectrometers
to dedicated laboratories away from the chemical work bench. This situation has changed in
2010 with the invention of small permanent magnets capable of providing magnetic fields
sufficiently homogeneous and stable to resolve the chemical shift [1, 2]. Up to then NMR with
compact magnets was limited to materials testing by relaxation and diffusion measurements
without chemical-shift resolution. While sensitivity and spectral dispersion of high-resolution
tabletop NMR spectrometers are lower than those of hitherto conventional high-field NMR
spectrometers due to lower field strength, they can be operated with the whole methodology
known from high-field NMR but inside the chemical laboratory and under the fume hood
[3]. This shortens the time for chemical analysis in reaction control applications from hours
to minutes and opens up new opportunities for reaction monitoring and analysis of hazardous
compounds. The lower cost makes NMR available to a wider user community and drives the
progress in simplification and automation of the measurement process. The current state-of-
the-art of compact low-field NMR instruments is reviewed from a methodological point of view
[1, 2, 4] with examples from mobile NMR relaxometry [5] and tabletop NMR spectroscopy [6].
References
[1] B. Blümich, E. Pretsch, eds., Compact NMR, Trends Anal. Chem. 83 Part A, Special Issue,
Elsevier, Amsterdam, October 2016.
[2] B. Blümich, S. Haber-Pohlmeier, W. Zia, Compact NMR, de Gruyter, Berlin, 2014.
[3] B. Blümich, Miniature and Tabletop Nuclear Magnetic Resonance Spectrometers, in:
R.A. Meyers, ed., Encyclopedia of Analytical Chemistry, John Wiley, Chichester, DOI:
10.1002/9780470027318.a9458.
[4] B. Blümich, Introduction to compact NMR: A review of methods, Trends Anal. Chem. 83
Part A (2016) 2, DOI: 10.1016/j.trac.2015.12.012.
[5] B. Blümich, J. Perlo, F. Casanova, Mobile single-sided NMR, Prog. Nucl. Magn. Reson.
Spectr. 52 (2008) 197-269.
[6] K. Singh, B. Blümich, NMR spectroscopy with compact instruments, Trends Anal. Chem.
83 Part A (2016) 12, DOI: 10.1016/j.trac.2016.02.014.
12Session 1
Measurement of halogenated greenhouse gases at Jungfraujoch by GC-quadrupole and
GC-TOF-MS
Stefan Reimann, Martin K. Vollmer, Lukas Emmenegger
Empa, Swiss Federal Laboratories for Materials Science and Technology, Laboratory for Air
Pollution / Environmental Technology, Ueberlandstr. 129, CH-8600 Duebendorf
stefan.reimann@empa.ch
Chlorofluorocarbons (CFCs) and other long-lived halocarbons destroy stratospheric
ozone and have been globally banned from usage since 2010 within the Montreal Protocol.
Hydrofluorocarbons (HFCs), as their replacement compounds, do no longer destroy ozone but
are very strong greenhouse gases. Therefore, industry has initiated a program for the production
of hydrofluoro alkenes, which have a very short atmospheric lifetime and hence a small impact
on climate. World-wide first meas-urements of these compounds have been performed at
Jungfraujoch, showing their increasing usage in Europe. In addition to this new generation
of compounds, we also have been tracking recently dis-covered hydrochlorofluorocarbons
(HCFCs), which have no purposeful usage in consumer products but are released to the
atmosphere as intermediate products during the synthesis of HFCs.
Measurements of halocarbons at Jungfraujoch are embedded in a global network, where they
are used for both verification of emission inventories down to the national level and as an
early-warning tool for the detection of new hitherto unknown trace gases on the global level.
Finally, we will also present first measurements from an Advancend PRECONcentrations
(APRECON) technique currently built at Empa, using Stirling-cycle cooled analyte traps
followed by gas-chromatography time-of-flight mass spectrometry (GC-TOF-MS).
13Session 2
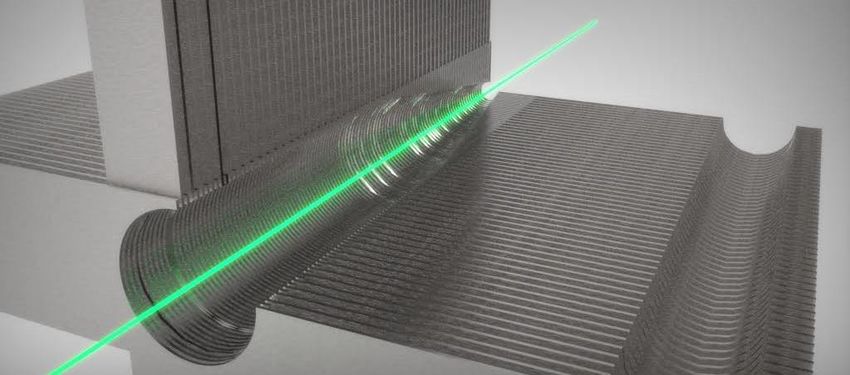
Table-top X-ray laser chemical imaging
D. Bleiner,1,2 Y. Arbelo,1 F. Barbato,1 L. and G. Patzke2
1Empa - Swiss Federal Laboratories of Materials Research & Technology, Ueberlandstrasse
129, CH 8600, Duebendorf, Switzerland
davide.bleiner@empa.ch
2University of Zurich, Dept. Chemistry, Winterthurerstrasse 190, 8057 Zürich, Switzerland
Laser action in the extreme ultraviolet and soft X-ray has been demonstrated using laser-
produced and discharge-produced hot/dense plasmas as single-pass high-gain media. In the
time of large accelerator-based X-ray lasers, fundamental and applied research on compact
plasma-driven X-ray laser carries the promise of bridging the gap between the user and the tools.
This demands contributions in (i) better quantitative understanding of the parameter effect on
plasma-lasing, and generalization of the empirical models, (ii) assembling compact “table-top”
demonstrators with the required robustness to address research and industry challenges, (iii)
performing proof-of-principle experiments on “real world” advanced “analytical cases”.
Experiments were run using the newly installed BeaglePlus system at the Empa Laboratories. A
0.2 ps Nd:glass oscillator feeds a chirped-pulse amplification stage to deliver Terawatt pulses
on a target for TGRIP X-ray plasma lasing. The “back-end system”, i.e. compact and close to
the application needs, uses also a self-developed pseudospark XUV source for imaging or
spectroscopy. A parametric study is also presented.
Nano-analytics were indeed performed on certified reference materials as well as catalysts.
Imaging was performed using a self-developed Schwarzschild microscope, with a back-end
resolution well-below the resolution of commodity confocal microscopes and without the
sample prep for super-resolution techniques. Proof-of-principle spectroscopy experiments
using a home-built “frequency-dispersive” Mass Spectrometer as well as X-ray absorption and
fluorescence measurements in the so-called HEROS (High-Energy Resolution Off-resonance
Spectroscopy) configuration are discussed. The latter tests were validated at the Elettra beamline
in Trieste, to be replicated on the BeaglePlus.
14Session 2
Open hardware miniature plasma ion source for ambient ionization mass spectrometry
Ralf D. Dumler, Peter C. Hauser
Department of Chemistry, University of Basel, Spitalstrasse 51, 4056 Basel, Switzerland
Atmospheric pressure plasma ion sources are gaining an important role in mass spectrometry
and are complementary to the established ESI and APCI ionization methods. Numerous
devices for ambient ionization, even from the surfaces of solid samples, have been described in
the last decade [1]. Two of these, DESI and DART, have been made available commercially at a
cost of > 40’000 Swiss Francs.
In the spirit of the Open Source Hardware (OSH) movement, a development which has its origins
in the shareware software community and has been extended to laboratory instrumentation [2],
we introduce an ambient ionization source which can be built with limited effort and at very
low cost. The plasma is produced in helium as a miniature jet at the tip of a fused silica capillary
with 320 µm ID. A dielectric barrier discharge (DBD) employing two contactless electrodes
inside a feedthrough cell is utilized for its creation. The plasma ion source is positioned directly
in front of the inlet capillary of the mass spectrometer and solid samples are placed at the tip of
the plasma. Liquid samples can be analysed by taking up a small amount with a cotton swab,
for example.
The DBD cell requires a high voltage AC waveform of high frequency, which is created with
a small and inexpensive electronic circuitry. To prevent spurious discharges and for safety the
electrodes are completely insulated by separating them from the plasma capillary with the help
of a fused silica sleeve and encapsulation in a high voltage grade potting epoxy. The required
mould, as well as a holder for the finished cell, was produced with a 3D printer. The helium flow
is regulated with a mass-flow controller, which is connected to an Arduino (an open source
microcontroller platform) and operated with the Instrumentino software package developed
in our laboratory [3].
The device was found to be well suitable for the analysis of compounds such as pharmaceuticals,
herbicides, pesticides, narcotics, precursors of chemical warfare agents and legal highs.
References
[1] Ambient Ionization Mass Spectrometry (New Developments in Mass Spectrometry),
ISBN-13: 978-1849739269.
[2] J.M. Pearce, Open-Source Lab: How to Build Your Own Hardware and Reduce Research
Costs, Elsevier, 2014, ISBN: 9780124104624.
[3] I. J. Koenka, J. Sáiz, P. C. Hauser, Instrumentino: An Open-Soure Software for Scientific
Instruments, Chimia, 69, 171-175 (2015).
15Session 2
Reversible pH-independent optical potassium sensor with lipophilic solvatochromic dye
transducer on surface modified microporous nylon
Lu Wang, Xiaojiang Xie, Jingying Zhai and Eric Bakker
Department of Inorganic and Analytical Chemistry, University of Geneva, Quai Ernest-
Ansermet 30, CH-1211 Geneva, Switzerland
Ion selective optodes are one of the most accepted types of optical ion sensors and have been
extensively researched in the last few decades. The response of classical ion optodes based on
chromoionophores are dependent on solution pH, because the ion-exchange with hydrogen
ion is at the basis of how the sensor works. Using positive charged solvatochromic dyes (SDs)
instead of chromoionophores as signal transducers, the extraction competition between the
analyte ion and H+ is no longer the basis for the sensor response. Such ionophore-based ion
optodes now operate independently of the sample pH.
However, SD based sensors are still not sensors in the strict sense, as SD transducers are water
soluble and readily leave the sensing phase. Recent progress rendered SDs more hydrophobic,
thereby retaining the molecules in the organic phase and only allowing the ionic chromophore
functionality to partition into the aqueous phase. This was shown to prevent SD leakage and
influence of sample dilution on the analytical signal.1
Here, we introduce a fluorescent ion optode that is based on the surface modification of a
nylon membrane and that functions continuously in a reversible manner, independent of pH
changes. The SD transducer ((E)-1-methyl-4-(4-(methyl(2-(stearoyloxy)ethyl)amino)styryl)
pyridinium), introduced here for the first time, remains confined to the sensing film and does
not protonate even in mild acid solution, resulting in a pH independent response to the ion
of interest. The hydrophobic tail of the SD avoids dye leakage. The resulting film respond to
K+ with excellent selectivity over the range of 10-7 to 10-2 M and a response time of t95 < 60 s
above 10-6 M. These characteristics, along with demonstrated operational reversibility, make
this optical sensing approach very promising for a range of practical sensing applications.
Scheme. Illustration of the cross section of a K+-selective modified nylon pore that responds
to K+.
Reference
1. X. Xie, J. Zhai, L. Wang, and E. Bakker, ACS Sens., 2016, 1, 516.
16Session 2
Fluorinated tripodal compounds as receptors for potentiometric chloride detection in
biological fluids
Nadezda Pankratova,1 Maria Cuartero,1 Nathalie Busschaert,2 Ethan N.W. Howe,2
Philip A. Gale,2 Eric Bakker1 and Gastón A. Crespo1
1Department of Inorganic and Analytical Chemistry, University of Geneva, Quai Ernest-
Ansermet 30, CH-1211 Geneva, Switzerland, Nadezda.Pankratova@unige.ch
2Chemistry, University of Southampton, Southampton SO17 1BJ, UK
Chloride is one of the most abundant and critical analytes in biological fluids since its
concentration is required for rapid patient care decisions in clinical laboratories.1 Approaches
to monitor the critical care species require the development of sensors and devices for real-time
monitoring with very high accuracy. The conventional AgCl-based solid-state electrodes are
not suitable for the analysis of biological samples because they suffer from protein adsorption.
Solvent polymeric membrane-based ion-selective electrodes have recently become an attractive
tool for direct monitoring of chloride in clinical analysis,2 however, only a few of the receptors
reported so far possess adequate selectivity for practical applications. At the same time, all of
the commercially available chloride ionophores do not provide better selectivity and stability
for clinical applications than traditional ion-exchanger tridodecylmethylammonium chloride.3
The salicylate anion is the main interferent for chloride detection due to its lipophilicity, high
concentration and variable content in biological fluids. Indeed, the determination of chloride
in serum using ion-selective electrodes often provides erratic results due to increased levels of
salicylate in the samples originating from the patients who took aspirin.2 Another challenge
in the development of membranes suitable for clinical chloride analysis is the upper detection
limit of the sensors since the high chloride concentration in the biological samples (ca. 100
mM) often causes too strong complexation in the sensing phase and therefore the Donnan
exclusion failure.4
Here we report the potentiometric properties of a series of
fluorinated tripodal compounds that were recently shown
to be efficient transmembrane transporters for chloride,
nitrate, bicarbonate and sulfate.5,6 Chloride detection in
the serum samples was accomplished using the receptor
providing the best selectivity over salicylate. A good
correlation between the potentiometric detection and the
argentometric titration show the selected receptor to be a
promising candidate for chloride detection in serum samples.
References
(1) Dimeski, G.; Badrick, T.; St. John, A. Clin. Chim. Acta 2010, 411, 309-317.
(2) Yoon, I. J.; Shin, J. H.; Paeng, I. R.; Nam, H.; Cha, G. S.; Paeng, K.-J. Anal. Chim. Acta 1998,
367, 175-181.
(3) Bratov, A.; Abramova, N.; Dominguez, C. Anal. Chim. Acta 2004, 514, 99-106.
(4) Radu, A.; Bakker, E. Chem. Anal. 2005, 50, 71-83.
(5) Busschaert, N.; Wenzel, M.; Light, M. E.; Iglesias-Hernandez, P.; Perez-Tomas, R.; Gale, P.
A. J Am Chem Soc. 2011, 133, 14136-48.
(6) Busschaert, N.; Karagiannidis, L. E.; Wenzel, M.; Haynes, C. J. E.; Wells, N. J.; Young, P. G.;
Makuc, D.; Plavec, J.; Jolliffe, K. A.; Gale, P. A. Chem. Sci. 2014, 5, 1118-1127.
17Session 2
Studying the conformational ensemble of β3/β2-peptides using ROEs, J-couplings and RDCs
Carla Rigling,1 Beata Kolesink,2 Marc-Olivier Ebert1
1ETH Zürich, Switzerland
2University of Lodz, Poland.
NMR spectroscopy is the method of choice for determination of the three-dimensional
structure of molecules in solution. Commonly, it is assumed that a single dominant
molecular conformation in solution can represent all the experimental NMR data. However,
molecules are constantly subjected to conformational changes in solution and representing
the conformational ensemble as single structure can lead to over-restraining and thus to
misinterpretation of the available data. Efforts to overcome this problem have mainly been
focused on large biomolecules. For small and medium-sized molecules the small density of
available restraints still renders a full description of the conformational ensemble difficult.
We have studied the solution-structure of the mixed β3/β2-peptides 1a and 1b in detail. It is
known that β3/β2-peptides can exhibit antimicrobial activity, and only recently they were found
to penetrate the lipid bilayer of eukaryotic cells [1]. Earlier studies suggested that a 12/10 helix
is the dominant conformation of the terminally protected β3/β2-nonapeptide 1a in methanol.
Deprotection (1b) is believed to lead to an equilibrium between a 10/12 and a 314 helix [2].
To investigate this hypothesis in more detail we have used an extended set of experimentally
derived restraints, including RDCs, and a multi-copy simulated annealing procedure. The
RDCs were measured using a stretched polyvinyl acetate gel in methanol. For comparison
the structures were also calculated with the common single conformation procedure. The
structures resulting from the two different methods are discussed.
References:
[1] a) P. Arvidsson et al. Chembiochem 2003, 4, 1345.
b) B. Kolesinka et al.Chemistry & Biodiversity 2015, 12, 697.
[2] a) M. Rueping et al. Helv. Chim. Acta 2002, 85, 2577.
b) D. Trzensniak et al. J. Am. Chem. Soc. 2005, 127, 14320.
18Session 2
SI-traceable standards for atmospheric monitoring of F-gases
Myriam Guillevic, Simon A. Wyss, Céline Pascale, Martin K. Vollmer,
Bernhard Niederhauser, Stefan Reimann
Eidgenössisches Institut für Metrologie METAS, 3003 Bern-Wabern
To support greenhouse gas monitoring in the atmosphere, we developed a method to produce
reference gas mixtures at pmol/mol levels (ppt) for fluorinated gases (F-gases, i.e. gases
containing fluorine atoms) in a SI-traceable way, meaning that the amount of substance
fraction in mole per mole is traceable to SI-units (meter, kilogram, mole, second, etc.). This
collaboration in between Empa and METAS is conducted in the framework of the HIGHGAS
and AtmoChem-ECV projects. The method has been applied to HFC-125 (pentafluoroethane,
widely used), HFC-1234yf (2,3,3,3-tetrafluoropropene, a car air conditioner fluid of growing
importance) and SF6 (insulant in electric switch-gears). It can as well be applied to a large
variety of molecules (e.g., water vapour, NO2, volatile organic compounds such as BTEX, NH3,
CFCs, HCFCs, HFCs and other refrigerants) and is particularly suitable for gas species and/
or concentration ranges that are not stable in cylinders. The expanded uncertainty is less than
3 %. This method could moreover be adapted to breath analysis.
The generation process is composed of four successive steps. In the first step the matrix gas,
nitrogen or synthetic air is purified. Second, this matrix gas is spiked with the pure substance,
using a permeation device which contains a few grams of the pure substance (e.g., HFC-125) in
the liquid form and loses it linearly over time by permeation through a membrane. This mass
loss is precisely calibrated, using a magnetic suspension balance. In a third step, to reach the
desired concentration, the first, high concentration mixture exiting the permeation chamber
is diluted with a chosen flow of matrix gas in one or two subsequent dilution steps. All flows
are piloted by mass flow controllers. All parts in contact with the gas mixture are passivated
using coated surfaces, to reduce adsorption/desorption processes as much as possible. In the
last, 4th step, the mixture is pressurised into Silconert2000-coated stainless steel cylinders by
cryo-filling. The cylinders’ mixture can be further diluted if needed by use of METAS’ “2-step-
dilutor”, a portable, dynamic dilutor.
Finally, we present the development and construction of a portable generator to allow for an
easy on-site calibration with SI-traceable, multi-component reference gas mixtures, at the
required levels, i.e. ppb to ppt levels (nmol/mol to pmol/mol). Such a device could be adapted
in the future to calibrate point-of-care instruments for breath analysis
19Session 3
Electroanalytical chemistry: From bio-imaging to ionisation methods for mass spectrometry
Hubert Girault
EPFL Valais Wallis, Sion, Switzerland
Electroanalytical chemistry has evolved a lot during the last decade. If areas like Ion-
Selective Electrodes, Glucose electrodes, pH electrodes, etc… still represent a large part of the
electroanalytical device market, new areas are emerging.
In our laboratory, we are interested in Scanning ElectroChemical Microscopy (SECM) for the
imaging of biosurfaces such as cells or tissues. We have developed microfabricated soft probes
to image such biological samples in a contact mode without altering the sample. In particular,
we shall present our work on melanoma tissues imaging. We shall also present our recent
development for coupling SECM to optical microscopy.
A second field of research is the development of novel ionisation methods for mass spectrometry.
We have developed a contactless method called ElectroSTAtic Spray Ionisation (ESTASI) which
allows to spray both cations and anions with a single electrostatic pulse. We have used this
approach to spray directly from microfluidic devices to analyse on-line reactions taking place
in a microchip. We shall compare this pulse technique to classical electrospray from microchips
and discuss the detection limits obtained from these different approaches.
Finally, we shall also present our recent work on TiO2-modified MALDI target plates for the
detection of antibiotic resistant bacteria.
20Session 3
Real-time noble gas analysis in the field, black smokers, and the paleocene-eocene-thermal
maximum
M. S. Brennwald, R. Rüssel, R. Kipfer
Eawag, Swiss Federal Institute of Aquatic Science and Technology, 8600 Duebendorf,
Switzerland
Available techniques to quantify (noble) gases in terrestrial fluids (e.g., water, oil, natural
gases, soil air) are expensive and labour-intensive as the analysis is mainly laboratory-based.
Consequently only very few samples can be analysed which do neither allow assessing the
spatial (noble) gas distribution (e.g., gas mapping at con-taminated sites or gas fields) nor
resolving fast (noble) gas partitioning processes (e.g., air transfer during bank infiltration). As
studies on reactive gases (O2, N2, CO2, CH4) barely address noble gases the powerful concepts
of terrestrial noble gas geochemistry are prevented to be adapted in environmental sciences.
To overcome these conceptual and technical limitations we recently developed a membrane
inlet mass spec-trometric system operating at gas / water equilibrium (GE-MIMS) enabling
real time (noble) gas analysis under field conditions. The new second-generation of the system
is portable and can be operated under on-site in the field (e.g., < 40 kg, < 40W). He, Ar, Kr, as
well as N2, O2, CH4 and CO2 concentrations in terrestrial fluids are measured simultaneously
and quasi-continuously (< 15 min.) [1].
We will discuss different field studies where this novel gas analytics was applied.
Golf of California. Such a GE-MIMS system was used on the German RV Sonne to determine
dissolved gas concentrations in the northern Guaymas, Mexico, to analyse methane and gas
emission from cold seeps [2]. The GE-MIMS was modified to enable quantitative gas analysis
on 8 L of water taken from standard 10 L Niskin samplers [3].
Most investigated sites in the northern Guaymas Basin were inactive and were found not to
emit fluids. However, the water column at one site was highly enriched with CH4, CO2 and He
and its source was identified as a field of various Black Smokers. The on-board analysis showed
the gas concentrations to be linearly correlated. The observed gas pattern is interpreted as
binary mixture of a deep-sited terrestrial gas source and dissolved gas-es from ocean water. The
online analysis allowed to select the most enriched water samples for subsequent la-boratory
based analysis. These few measurements showed that Black Smokers to emit He from the Earth
man-tle. The isotopically light CH4 is mainly of biogenic origin and seems to be mobilized by
the Black Smoker activity.
The Golf of California can be interpreted as a recent analogue of the young and opening
Atlantic Ocean. Thus, our results add support to the idea that the Paleocene-Eocene-Thermal
maximum 55 Myrs ago was caused by magmatism and Black Smoker activity in response to
ocean formation [4].
Oxygen dynamics in groundwater. Initial dissolved O2 concentrations at (ground) water
recharge cannot be de-termined by the prevailing temperature (and salinity) of the water as all
atmospheric gases are delivered to (ground) water not only by atmosphere / water equilibration,
but also by the formation of a characteristic excess of air, i.e., at recharge the concentrations of
atmospheric gases in (ground) water commonly exceed saturation equilibrium.
As Ar and O2 have nearly the same physical properties with regard to gas/air-water partitioning,
Ar concentra-tions allow the initial dissolved O2 concentrations at (ground) water recharge to
be determined. The GE-MIMS technique, therefore, enables, the quantification of O2 turnover
21Session 3
rates on the small time scales being typical for aquatic systems, such groundwater recharge
during bank infiltration [5].
References
[1] Mächler L. et al. (2012) Environ. Sci. Technol., 46, 8288-8296.
Mächler L. et. al (2014) Chimia, 68, 155-159.
[2] http://www.geomar.de/en/research/expeditionen/detail-view/exp//332376/
[3] Brennwald M. S. et. al (2015) Goldschmidt Abstracts, 386 & 387.
[4] Svensen H. et al. (2004) Nature, 429, 542-545.
[5] Mächler L. et al. (2013) Environ. Sci. Technol., 47, 7060-7066.
Mächler L. et al. (2013) Water Resour. Res., 49, 1-10.
22Session 3
Centralized and near patient testing for personalized healthcare
Edith Schallmeiner
Global Diagnostic Strategy Lead, Diagnostics Solutions
Novartis, CH-4001 Basel
Technology, Science and Medical innovations have allowed us to move from observational
science practices in the last centuries to being able to modify diseases on a molecular level.
Our increased understanding has built the basis for the development of new and effective
therapies[1].
Measuring distinct characteristics in patients to identify disease dates back to ancient times.
Hippocrates advocated tasting urine, listening to the heart and lungs to determine patients
disease, today we perform whole genome sequencing in an effort to understand complex
diseases [1].
Diagnostic testing today comes in many shapes and sizes, histology, genome sequencing,
molecular testing, protein and clinical chemistry tests in different sample types.
85% of all diagnostic tests are performed in a laboratory environment providing reliable results
within hours or days from a variety of samples [2].
However, the implementation of new diagnostics in routine clinical practice is often a complex
process driven by clinical data, the development of central lab IVD test and the deployment of
testing in the market [3]. In addition to the central lab near patient diagnostics can bring quick
and reliable results not only for highly urgent tests but also for improved patient management
in a decentralized care settings. However, near patient diagnostics cover a comparably small
portion of existing markers, driven by the historic lack of available technologies with acceptable
performance and barriers in access to POC devices. Especially novel or markers for smaller
patient populations, such as personalized markers, are often not targets for point of care
developments [4] and are mainly delivered through the central lab. This talk will be looking at
the interface of the pharma industry and diagnostics and its unique challenges to testing.
References
[1] Darlene Berger, A brief history of medical diagnosis and the birth of the clinical laboratory
Part 1—Ancient times through the 19th century.
[2] Oncology, A.S.o., Cancer Facts and Figures 2015.
[3] Development., T.C.f.t.S.o.D., Personalized Medicine Is Playing a Growing Role in
Development Pipelines. 2010.
[4] FDA, Paving the Way for Personalized Healthcare 2013.
23Session 4
Sensitive and fast identification of bacteria in blood samples by immunoaffinity mass spec-
trometry: a quick BSI diagnosis tool
Yingdi Zhu, Hubert Girault
Laboratoire d’Electrochimie Physique et Analytique, École Polytechnique Fedérale de
Lausanne, Switzerland
Background: Bloodstream infections (BSI), caused by the presence of bacteria or fungi in
bloodstream, rank among the most serious causes of morbidity and mortality in hospitalized
patients.1 Blood cultures is the current standard method for BSI diagnosis which takes about
one week.2 Developing quick BSI diagnosis methods is crucial for timely determination
of appropriate therapy. Matrix-assisted laser desorption/ionization time-of-flight mass
spectrometry (MALDI-TOF MS) has been widely used for bacteria identification by protein
fingerprinting.3 However, for blood samples, it is hard to perform direct MS fingerprinting
as blood brings interference. Thereby, a step to purify and concentrate bacteria before MS
detectionis required. Also, a comprehensive database (bacteria reference spectra) is crucial for
successful identification.
Methodsand Results: Sensitivity of MALDI-TOF MS was enhanced by reducing sample spot
size to ≤ 0.8 mm. Bacteria database was built by collecting reference spectra from different
bacteria species at 5 different cells number (10, 102, 103, 104, 105). Protein A/G-coated magnetic
beads were modified with IgG isotype anti-bacterial antibodies to separate bacteria form blood
samples for MALDI-TOF MS detection.To give identification result, the resulting mass spectra
were compared with reference spectra in the database with a cosine correlation method. The
identification was believed to be successful if the similarity score between resulting-spectrum
and reference-spectrum was ≥ 0.8.
The present method allowed bacteria identification from blood serum (LOD 500 cells mL‑1),
whole blood (LOD8,000 cells mL-1) and multi-species spiked whole blood. It could also identify
bacteria directly from clinical positive blood cultures,without the need of time-consuming
sub-culture.
To monitor real diagnosis, human blood spiked with low concentration of bacteria was cultured
in commercial blood culture bottles. After every 2 hours of culture, 1 mL of liquid was taken
out and analyzed with the present method. Results showed 2-4 hours of culture was enough
for correct identification. As a compare, it took 9-11 hours for the bottles to become positive
(In hospital, this is a necessary step before conducting identification). As a conclusion, the
present method provided a way for quick BSI diagnosis. The entire diagnosis process, from
blood collection to identification result, could be completed within 4-6 hours.
References:
[1] GotoM., Al-HasanM. N., Clin. Microbiol. Infect. 19 (2013), 501-509.
[2] Riedel S., Carroll K. C., J. Infect. Chemother. 16 (2010) 301-316.
[3] Claydon M. A., Davey S. N., Edwards-Jones V., Gordon D. B., Nat. Biotechnol. 14 (1996)
1584-1586.
24Session 4
Simultaneous quantification of reduced and oxidized glutathione in biological samples with a
high-throughput differential mobility spectrometry-mass spectrometry (DMS-MS) method
Sophie Bravo-Veyrat and Gérard Hopfgartner
University of Geneva, Life Sciences Mass Spectrometry, Department of Inorganic and
Analytical Chemistry, 30 Quai-Ernest-Ansermet, CH-1211 Genève 4
Introduction: Determination of the blood stability during the storage of transfusion bags is of
high importance for the patients. Glutathione (GSH) is a low molecular weight biomarker of
red blood cells (RBC) oxidation. Its quantification is challenging because the oxidized form
of glutathione (GSSG) occurs quickly in the sample. The derivatization by N-ethylmaleimide
(NEM) is commonly used to stabilize the analyte in its reduced form prior to analysis. This
study presents the comparison between a LC-MS analytical technique and a novel, rapid and
high throughput differential mobility spectrometry-mass spectrometry (DMS-MS) method
for the identification and quantification of reduced and oxidized GSH in whole blood, urine
and liver samples.
Methods: Samples are analyzed after NEM derivatization. Both methods use a 5500 QTrap (AB
Sciex) mass spectrometer equipped with a TurboIonspray probe. With the LC-MS method
the analytes are separated on a Hypercarb column whereas for the DMS-MS the sample is
introduced in the MS by flow injection. MS detection is performed in the Multiple Reaction
Monitoring mode. The DMS-MS method was cross validated with the LC-MS method.
Results: Derivatization of GSH allows an ESI response increase of about 1000-fold. For DMS-
MS method the addition of a modifier (EtOH, MeOH) enables to separate GSH and GSSG
based on their compensation voltage (CoV) value without any chromatography. The absence of
chromatographic separation in DMS/MS decreases the run time from 10 minutes with the LC-
MS method to 0.5 minutes. These results show that flow injection DMS-MS technique allows
development of fast and high-throughput screening in metabolomic field with selectivity and
accuracy without the need of chromatographic separation.
25Session 4
A comparison of UV-ns-LA and UV-fs-LA-ICP-MS for the analysis of Si-based geological
samples
Debora Käser, Joachim Koch, Detlef Günther
ETH Zürich, Laboratory of Inorganic Chemistry, Vladimir-Prelog-Weg 1, CH-8093 Zürich,
Switzerland
Laser ablation (LA) in combination with inductively-coupled plasma mass sp ectrometry (ICP-
MS) for the determination of major, minor and trace elements has become one of the most
spread techniques for the analysis of geological samples over the past two decades. The idea of
using LA as sampling tool is to form stoichiometric aerosols which represent the composition
of the sample to be analyzed by an ICP-MS. Various studies on the performance of LA-ICP-
MS systems have shown strong dependencies on physical properties of the sample (optical
transparency, heat conductivity, boiling points of constituents etc.) during the LA process,
giving rise to elemental fractionation by the production of non-stoichiometric aerosols. A
number of parameters such as laser wavelength, pulse width, beam profile, fluence, repetition
rate, or aerosol carrier gas control the chemical composition of the aerosol and the particle size
distribution of the LA-produced aerosols. The influence of some of the sources of elemental
fractionation have been minimized by using ArF- or Nd:YAG-based UV-ns-LA systems with
homogenized beam profiles [1]. Recently, the application of UV-fs-LA has also been reported
to reduce elemental fractionation and to give higher accuracy for non-matrix-matched
calibration [2, 3]. Nevertheless, there are still limitations concerning the accuracy for analyses
of certain non-metals due to separation of elements into mineral phases formed or falling out
in the course of material decomposition and aerosol transportation [4, 5]. As a consequence,
certified reference materials (CRMs) are often required to enable matrix-matched calibration;
not to mention that internal standards are commonly needed to correct for variations in the
absolute amount of material brought to the ICP-MS and, therefore, the concentration of at
least one homogeneously distributed element must be known. Another quantification strategy
reported by Liu et al. [6] makes use of a 100 % normalization scheme, where exact knowledge
about the concentration of an individual internal standard is not needed anymore.
This paper is dealing with a comparison of state-of-the-art UV-ns-LA and UV-fs-LA systems
operated at wavelengths of 193 nm and 257/206 nm, respectively, concerning accuracy and
precision of ICP-MS for the analyses of CRMs in the form of Si-based glasses and minerals.
Thus, it resumes previous efforts to work out pros and cons of ns-LA and fs-LA and in
addition aims at providing insight into unknown origins or mechanisms behind the collective
phenomenon of elemental fractionation occurring during LA-ICP-MS for certain elements,
especially for Silicon. The influence of LA parameters including laser wavelength, fluence, and
crater size were studied. Significant different laser-induced fractionations between widely used
external reference materials (NIST SRM 610 - 614) and natural silicate reference materials (e.g.
USGS basalt glasses) have already been shown by Hu el al. in 2010 [7]. Additionally, our results
revealed differences in the accuracy of analysis for the content of Silicon found when analyzing
samples made from pressed nano-powders of basalt CRMs, while using an external standard
composed of glass-matrix. The origins of the deviations observed among matrix-matched and
phase-matched calibration strategies are discussed.
26Session 4
References
[1] M. Wälle et al., Journal of Analytical Atomic Spectrometry, 2010, 25, 193-195.
[2] J. Koch et al., Journal of Analytical Atomic Spectrometry, 2006, 21, 932-940.
[3] H. Wiltsche and D. Günther, Anal. Bioanal. Chem., 2011, 399, 2167-2174.
[4] J. Kosler et al., Journal of Analytical Atomic Spectrometry, 2005, 20, 402-409.
[5] R. Glaus et al., Spectrochimica Acta Part B, 2010, 65, 812-822.
[6] Y. Liu et al., Chemical Geology, 2008, 257, 34-43.
[7] Z. Hu et al., Journal of Analytical Atomic Spectrometry, 2011, 26, 425-430.
27Session 4
Monitoring of antibody glycosylation pattern based on microarray MALDI‐TOF mass
spectrometry
Joanna Hajduk,1 Robert F. Steinhoff,1 Daniel J. Karst,2 Vania Bertrand,2 Miroslav Soos,3
Massimo Morbidelli,2 Renato Zenobi1
1Laboratory of Organic Chemistry, Department of Chemistry and Applied Biosciences, ETH
Zurich, CH‐8093 Zurich, Switzerland
2Institute for Chemical and Bioengineering, Department of Chemistry and Applied
Biosciences, ETH Zurich, CH-8093 Zurich, Switzerland
3Faculty of Chemical Engineering, University of Chemistry and Technology, 16628 Prague,
Czech Republic
The industrial production of therapeutic monoclonal antibodies is highly regulated and requires
careful product quality monitoring. The observed hetereogeneities within a production batch
depends on many different criteria e.g. production process, feeding conditions, cell line stability
and many others. A very critical hetereogeneity that impacts on the antibody effector function
is microvariants such as post‐translational modifications or sequence discrepancies. Therefore,
the glycosylation analysis of the antibody structure is of great importance and constitutes an
analytical challenge. The mass of the intact antibody, glycopeptides or released N‐glycans can
be easily monitored by state‐of‐art mass spectrometry techniques.
Here, we present a high‐throughput matrix‐assisted laser desorption/ionization mass
spectrometry (MALDI‐MS) method based on a microarray technology to monitor N‐glycan
structures and glycopeptides profiles of an IgG1 antibody from a perfusion cell culture process.
This stable perfusion process conditions are thought to result in very stable glycosylation
profiles. We are investigating different glycan analysis steps in order to find and create the most
suitable high‐throughput method for a 30‐day monitoring experiment. In a first attempt, the
IgG1 is selectively digested by IdeS in order to isolate Fc/2 using rapid C4 chromatography.
Subsequently, the PNGase F deglycosylation reaction of the Fc/2 is monitored by high‐mass
MALDI‐TOF analysis. The released N‐glycans are purified with graphitized carbon solid phase
extraction, and labelled directly on microarray for mass spectrometry (MAMS) target. A site‐
specific identification of Fc/2 fragments N‐glycosylation is presented based on glycopeptide
analysis. Therefore, the monoclonal antibody product is treated with IdeS and with or without
PNGase F enzyme. After deposition of the protein into microarray target, each spot is
subjected to trypsin digestion to generate the profile of intact glycopeptides and peptides with
enzymatically released glycans.
28Session 4
LC-SWATH/MS Metabolomics platform with hyphenation of extraction and analysis of polar
and non-polar metabolites in plasma
Michel Raetz,1 Renzo Picenoni,2 Günter Böhm,2 Gérard Hopfgartner1
1University of Geneva, Life Sciences Mass Spectrometry, Department of Inorganic and
Analytical Chemistry, 30 Quai-Ernest-Ansermet, CH-1211 Genève 4
2CTC Analytics AG, Industriestrasse 20, CH-4222 Zwingen
Introduction: For sample preparation most of the metabolomics studies are based on a liquid-
liquid extraction, most commonly the Bligh and Dyer extraction or one of its variants, to
separate polar and non-polar metabolites. In this work we propose a robotic sample preparation
hyphenated to multiple LC-SWATH/MS acquisitions for the analysis of plasma samples. This
automation allows an increase in sample quality and throughput as well as in reproducibility.
Methods: The sample preparation including a Bligh and Dyer extraction is performed on a PAL
RTC (CTC Analytics). Subsequently, an aliquot thereof is submitted to an online SPE to class
separate the lipids. Neutral lipids and phospholipids (PL) are analyzed using NP-APCI and
HILIC-ESI on two Nexera LC-30AD pumps (Shimadzu), respectively, and MS acquisition on
a TripleTOF 5600 (Sciex). High resolution MS spectra were recorded in SWATH acquisition
mode and searched against in-house and external spectral libraries.
Results: The SPE based fractionation of lipids allows equalizing the difference in abundance
of the lipid classes. The sample cleanup during the extraction process reduces ionization
suppression and enhancement phenomena. As a result, an increase in the number of feature
detection and identification is observed.
A special emphasis is given on the HILIC-SWATH/MS acquisition of PL. As PL are large and
diverse classes a data independent approach is necessary to cover the broad range of analytes.
Once, to overcome limitations in cycle time of data dependent approaches for extensive analyte
lists. On the other hand, SWATH/MS acquires fragment spectra of all the present precursors.
This allows quantification on selective fragments other than defined SRM mode. Depending
on the size of the chosen precursor window structural information can be retrieved and the
fatty acid composition elucidated. As in SWATH/MS all spectra are recorded data reprocessing
can reduce the need of new measurements when a new biological question arises during the
project progression.
29Session 4
Automated dried blood spot analysis by LC-MS for newborn screening, challenges and
opportunities
Christian Berchtold,1 Irene Wegner,1 Stefan Gaugler,2 Tamara von Däniken,3
Markus Wyss,2 Ralph Fingerhut,3 Götz Schlotterbeck1
1University of Applied Sciences and Arts Northwestern Switzerland FHNW, Institute for
Chemistry and Bioanalytics, Gründenstrasse 40, 4132 Muttenz. Switzerland
2CAMAG Chemie-Erzeugnisse & Adsorptionstechnik AG, Sonnenmattstrasse 11, 4132
Muttenz, Switzerland
3University Children`s Hospital, Children’s Research Center, Swiss Newborn Screening
Laboratory Steinwiesstrasse 75, 8032 Zurich, Switzerland
Introduction: Dried blood spot analysis (DBS) is a very convenient technique for blood sample
collection and storage and is well-established in newborn screening [1]. In Switzerland, about
84’000 newborns are screened for inborn errors every year by DBS [2]. However, traditional
methods in this field are laborious as they are based on punching and offline extraction. Even
more critical, sometimes sample confusion is caused due to electrostatic effects, which directs
punched samples into the wrong tube or well.
These issues were the focus of a CTI (commission for technology and innovation) funded
project (Nr. 6898.1 PFLS) in a collaboration with CAMAG, the children’s hospital in
Zürich and the School of Live Sciences of the University of Applied Science Northwestern
Switzerland (FHNW). The main objective was to develop a fully automated screening method
for acylcarnitines, amino acids, steroids and other metabolites by LC-MS/MS for newborn
screening [2, 3, 4]. This task was finally achieved by the use of the new DBS-MS 500 from
CAMAG, which was already investigated in an early collaboration of the University of Applied
Sciences and CAMAG.
The important step in this project was the integration of steroids into the already used flow-
injection method for amino acids and acylcarnitines. This is challenging since acylcarnitines,
amino acids and steroids have very different physico-chemical properties in terms of solubility,
polarity and ionization potential, which require careful selection and optimization of extraction,
chromatographic and MS-ionization parameters. In addition, blood as a complex and
inhomogeneous matrix adds an additional challenge into this composite method development
procedure. Thus, this project is a perfect example for showing the challenges and opportunities
of the fully automated DBS-LC-MS/MS analysis of dried blood spot cards.
Finally, a validated method according to ICH standards [4] was developed and implemented at
the Swiss children’s hospital in Zurich which is presented in this work.
Materials and Methods: A fully automated dried blood spot sampler, the DBS-MS 500, (CAMAG,
Muttenz, BL, CH) and a 6410 triple quadrupole mass spectrometer (+ESI) equipped with a
1100 series quaternary HPLC pump (Agilent, Santa Clara, CA, USA) were used. Solvents,
additives and steroid standards were provided by Sigma-Aldrich (Buchs, SG, CH). Standards
for amino acids and acylcarnitines were provided by Chromsystems (München, Ba, D).
Results and Discussion: The dir ect extraction method of the DBS-MS 500 without the use
of SPE cartridge limits the use of extraction solvent composition and volume on one hand
and on the other hand this workflow reduces the usage of consumables and allows a fast and
high throughput of samples. It is therefore necessary to optimize the composition and volume
of the extraction during method development to maintain the chromatographic separation
30Session 4
and to extract as much analytes as possible without co-extraction of interfering compounds.
For acylcarnitines, amino acids and steroids this was achieved with 70% methanol and 30%
water and a total injection volume of 10 microliters. This volume was transferred via sample
injection loop on a 30 mm C18 Analytical column. The fast separation allows a total cycle time
of less than 2.5 minutes for the extraction, separation and detection including the complete
card handling process. The final detection is provided by LC-MS using specific MRMs (multi
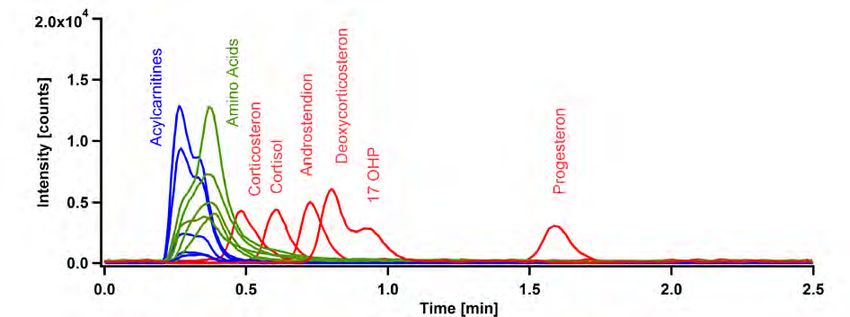
reaction monitoring) (see Figure 1).
For a sufficient ionization of the steroids a perfect optimization of the ion source and suitable
buffer is needed. A mixture of 2 mM ammonium fluoride and 0.1 % formic acid in water/
methanol (35:65) showed the best performance. Although the sensitivity for the amino acids
has been reduced, it was sufficient for screening purposes.
Figure 1: Overlaid MRM of the steroids
The averaged CV of the amino acids and acylcarnitines was 4.2 % within one day and 7.2%
for several days using the automated method. This was comparable to the established routine
method, which was found to be 5.6% CV for one day and 6.3% CV for several days. Each value
represents the average for the complete analyte panel, including amino acids, acylcarnitines
and steroids. The CVs are comparable and the variation of the automated method is improved
compared to the manual routine method used at Children`s Hospital Zurich.
Conclusions: It has been shown that the new direct elution method has significant advantages
compared to the traditional method: It covers more analyte classes, it is fully automated and
the total analysis costs are significantly reduced. This means after the sample card has been
placed in the DBS-MS 500, no further manual step is necessary. As soon as the analysis starts,
all cards are scanned by the camera and all samples are extracted and measured sequentially.
Finally, most of the analytes have been detected in higher sensitivity compared to the manual
method. The combination of these 25 markers allows the screening for several diseases in less
than 2.5 minutes per sample.
Outlook: Our approach significantly improves not only newborn screening programs, but also
opens new avenues for dried blood spot analysis in other fields such as screening for doping,
therapeutic drug monitoring, or point of care analytics. However, our research shows also
the challenges to identify optimal extraction conditions, chromatographic separation and
detection. Additionally, the availability of reference values and reference standards remains
not completely solved. Also aspects of haematocrit influence or the best quantification strategy
remain a challenge for future research.
31Session 4 References [1] Dried Blood Spots: Applications and Techniques ISBN: 9781118054697. [2] Neugeborenscreening Kinderspital Zürich http://www.neoscreening.ch. [3] CAMAG http://www.camag.com/en/dbs/dbs-ms_500.cfm. [4] Fingerhut et. al Rapid Commun. Mass Spectrom. 2014, 28, 965–973. [5] ICH Validation Guidelines http://www.ich.org. 32
Poster Abstracts

                   33
Poster 1
Boundary treatment at numerical simulation of potential response of ion-selective electrode
by finite difference method
Dajing Yuan, Maria Cuartero, Gaston A. Crespo and Eric Bakker
Department of Inorganic and Analytical Chemistry, University of Geneva,
Quai Ernest-Ansermet 30, CH-1211 Geneva, Switzerland
The output signal of an ion selective electrode sensor is generally described under Nernstian
assumptions where the electrode potential is a function of logarithmic activity of the primary
ion. However, deviations of Nernstian response are often found when the electrode is
exposed to different ions. This phenomenon can be reasoned as ion exchange process at the
membrane/aqueous interface and the concomitant counter-fluxes of primary and interfering
ions. Therefore, it is essential to interpret the diffusion process for their better experimental
performance. From a mathematical point of view, the diffusion process can be written by
setting first and/or second order differential equations considering some particular boundary
conditions. Unfortunately, for most of cases, it is difficult to derive analytical solutions, and
numerical simulation are the currently still the best approximation of the system.1
When numerical simulations are performed, the “boundary element” or “zero element” should
be treated differently than others, depending on the considered boundary conditions. To the
best of our knowledge, there is no shortage of mathematical discussion about treatments
of well-known boundary conditions such as the Dirichlet with given concentrations at the
boundary and Neumann where concentration gradients are specified at the boundary.2
However, the treatment of the boundary element in ion selective membranes, where multi-
ion diffusion at both sides of the interface should be considered, is seldom considered. We
explore here the case of an ion selective membrane and present three methods of calculation
for “boundary elements”, i.e., the direct two-point approximation of first derivative at both
sides, the Morf ’s method3 that takes only one side two-point approximation, and the Crank’s
method4 that introduces an imaginary element at the boundary. Each method is evaluated in
terms of stability and convergence and is also validated by the experimental counterpart. We
discuss limitations and advantages in order to encourage scientist to develop their own models
by using the most appropriate method to simulate their results of diffusion in composite media
especially for the case of ion-exchange materials such as ion selective membranes.
References
1. Allen J. Bard et al., Electrochemical Methods: Fundamental and Applications p. 785-788.
2. Dieter Britz, Digital Simulation in Electrochemistry p. 27.
3. W.E. Morf et al., Journal of Electroanalytical Chemistry 2007, 602, 43-54.
4. J. Crank, The Mathematics of Diffusion p. 150.
34You can also read