PROCEEDINGS OF FIFTH INTERNATIONAL WORKSHOP ON SKILL SCIENCE (SKL 2018) - ASSOCIATED WITH JSAI INTERNATIONAL SYMPOSIA ON AI 2018 (ISAI-2018)
←
→
Page content transcription
If your browser does not render page correctly, please read the page content below
Proceedings of Fifth International
Workshop on Skill Science (SKL 2018)

Associated with
JSAI International Symposia on AI 2018 (IsAI-2018)
Workshop Chair
Tsutomu Fujinami (Japan Advanced Institute of Science and Technology)

Steering Committee Members
Ken Hashizume (Osaka University)
Kentaro Kodama (Kanagawa University)
Yoshifusa Matsuura (Yokohama National University)
Kohichi Matsuda (Iwate Prefectural University)
Yuta Ogai (Tokyo Polytechnic University)
Mihoko Otake (RIKEN)
Daichi Shimizu (Tokyo University)
Masaki Suwa (Keio University)

Workshop Date:November 12, 2018
Venue:Raiosha Building, Keio University Kanagawa, Japan Proceedings
issued on 30th October 2018
ISBN xxx-x-xxxxxx-xx-x xxxxx(JSAI)
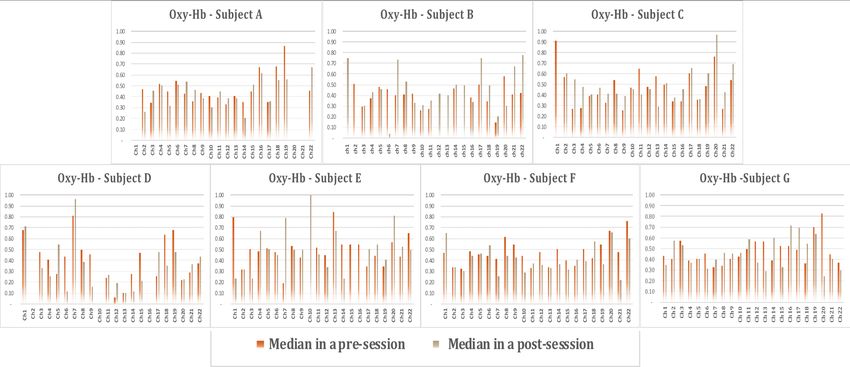
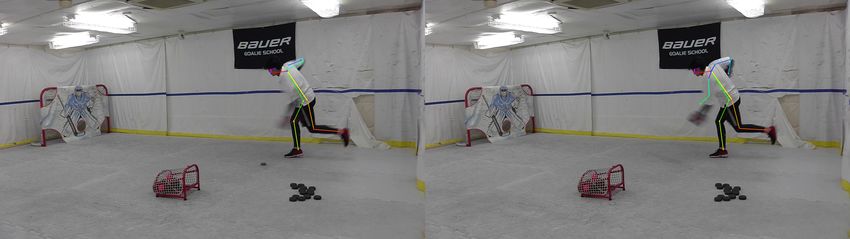
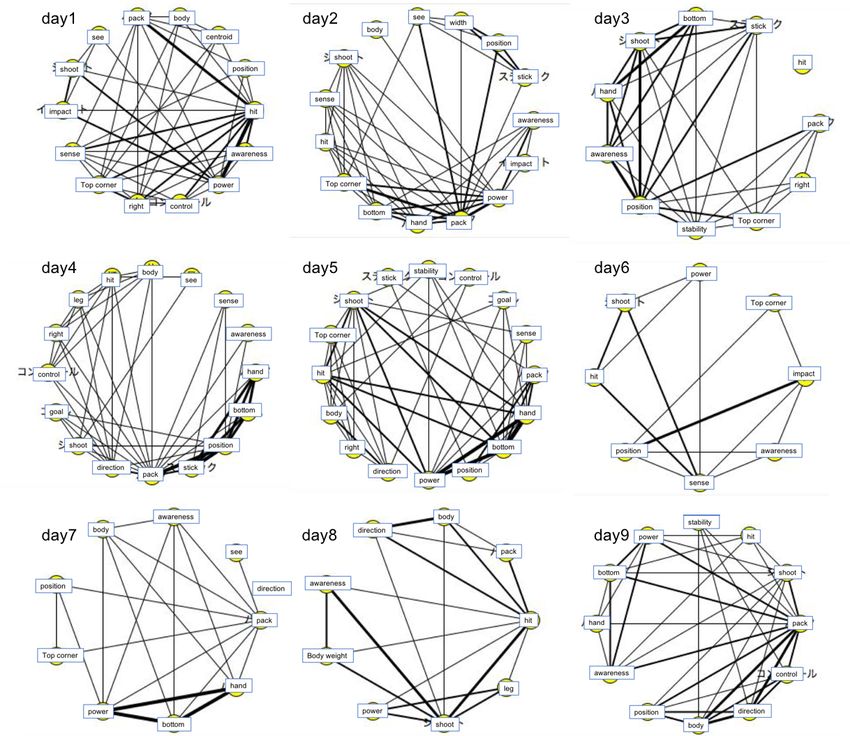
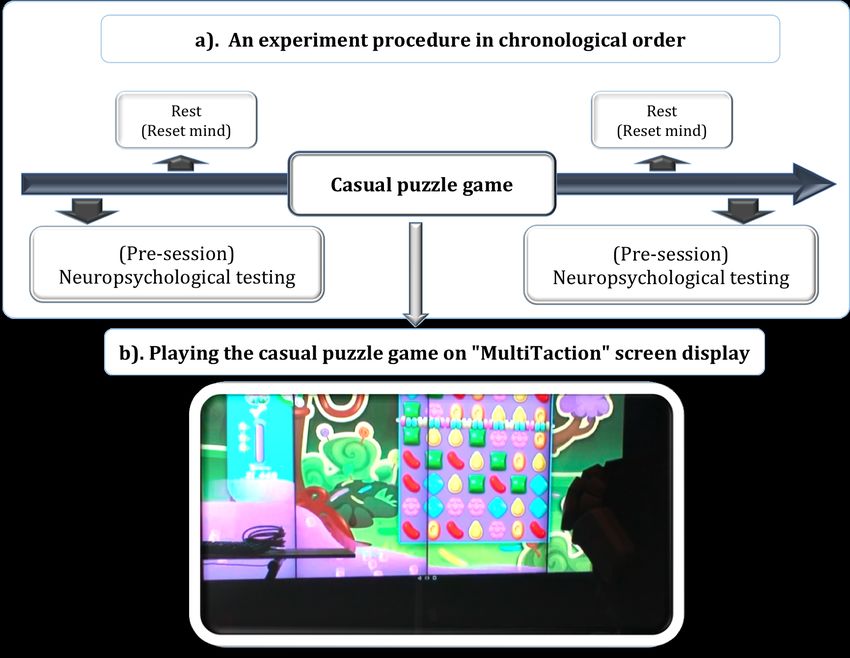
Table of Contents

Lectures
Prediction of basketball free throw shooting by OpenPose
Masato Nakai,Yoshihiko Tsunoda, Hisashi Hayashi, Hideki Murakoshi __ 1

Detecting freezing-of-gait symptom in Parkinson’s disease by analyzing
vertical motion from force plate
Dinh-Khiet Le, Takuma Torii, Tsutomu Fujinami, Wannipat Buated,
Praween Lolekha ___________________________________________________ 11

Interactive Presentations
The relationship between degrees of freedom and the adaptability or
flexibility in human postural standing
Kentaro Kodama, Kazuhiro Yasuda, Hideo Yamagiwa _________________ 22

Visualization of cognition and action in the shooting skill acquisition process
in ice hockey
Masayuki Yamada, Kentaro Kodama, Daichi Shimizu Yuta Ogai,
Shogo Suzuki _______________________________________________________ 34

A research about rhythm and phrase recognition of classical music performer
learning Jazz ad-lib solo phrases based on score
Daichi Ando ________________________________________________________ 53

Effects of Casual Computer Game on Cognitive performance through
Hemodynamic Signals
Phetnidda OUANKHAMCHAN, Tsutomu Fujinami ____________________ 58

Effects of auditory feedback for a running assist system
Anna Yoshioka, Tsutomu Fujinami _________________________________ 69
The effect of metrical structure on the auditory-motor coordination of
dance-like movement
Takahide Etani, Akito Miura, Masahiro Okano, Masahiro Shinya,
Kazutoshi Kudo ____________________________________________________ 70

Invited Lectures
Reduction of Retrograde Interference in a Motor Learning by Idiosyncratic
Cross-Modal Mappings
Eiko Matsuda ______________________________________________________ 71

Panel Discussion
In Search of Foundations of Skill Science - What shall we study of skills?
____________________________________________________________________ 72

Can we rely on the sense of body?
Tsutomu Fujinami

Difficulty in distinguishing input from output in human movement
Kentaro Kodama

What kinds of roles does a somatic sensation serve in human movements?
Daichi Shimizu

Why not dealing with subjective thoughts and feelings for studies of
embodied-ness?
Masaki Suwa

Application of artificial life research method for inseparability of motion and
perception
Yuta Ogai
SKL2018                                                                                       2018-11-12

          Prediction of Basketball Free Throw Shooting by
                             OpenPose

              Masato Nakai,Yoshihiko Tsunoda, Hisashi Hayashi, Hideki Murakoshi

              School of Industrial Technology, Advanced Institute of Industrial Technology
                       1-10-40, Higashiooi, Shinagawa-Ku,Tokyo, 140-0011, Japan

                Abstract. OpenPose, which was developed by Carnegie Mellon Uni-
                versity (CMU) presented at CVPR 2017 last summer, takes in real-time
                motion images via a simple web camera and is capable of recognizing
                skeletons of multiple persons in these images. It also generates recog-
                nized skeleton point coordinates to files. OpenPose is featured by CMU’s
                original top-down method for real-time recognition and it is open online
                especially for research purposes. Thus we aimed to build a posture anal-
                ysis model using OpenPose skeletal recognition data and verifying the
                practicality of OpenPose by verifying the accuracy of the model. As a
                posture analysis model, we adopted a logistic regression model that pre-
                dicts the shooting probability of the basketball free throw with skeleton
                posture data as explanatory variables and the shooting or not as a target
                variable. As the result, high prediction accuracy was obtained. Therefore,
                posture analysis using OpenPose has been verified to be practical with
                our model. We consider that with many skeleton data which are easily
                provided by a simple web camera, OpenPose make statistical diagnostic
                approach possible. We also consider it could lower costs (in both finan-
                cial and time-wise) of such analysis which has previously required more
                equipments and more time for preparation regarding motion capture
                analysis systems.

          Keywords: OpenPose, Logistic regression, Basketball shooting prediction, Pos-
          ture diagnosis

          1   Introduction
          We consider that a large amount and variety of human posture data with high
          precision are required to improve performance in statistical posture analysis.
          However we found that there are little available posture data because of com-
          plexity for acquiring posture data. In order to acquire the whole posture data as
          a time-series, there are major two methods. One is video motion analysis(manual
          marking) and the other is motion capture analysis. Video motion analysis, which
          divides into photographs and marks annotations on the pose images, is very labo-
          rious. Motion capture analysis is necessary to attach so many sensors on human
          limbs that acquisition of data is complicated in operation. At CVPR 2017 con-
          ference, Carnegie Mellon University (CMU) presented OpenPose[1]1 which can

                                                 1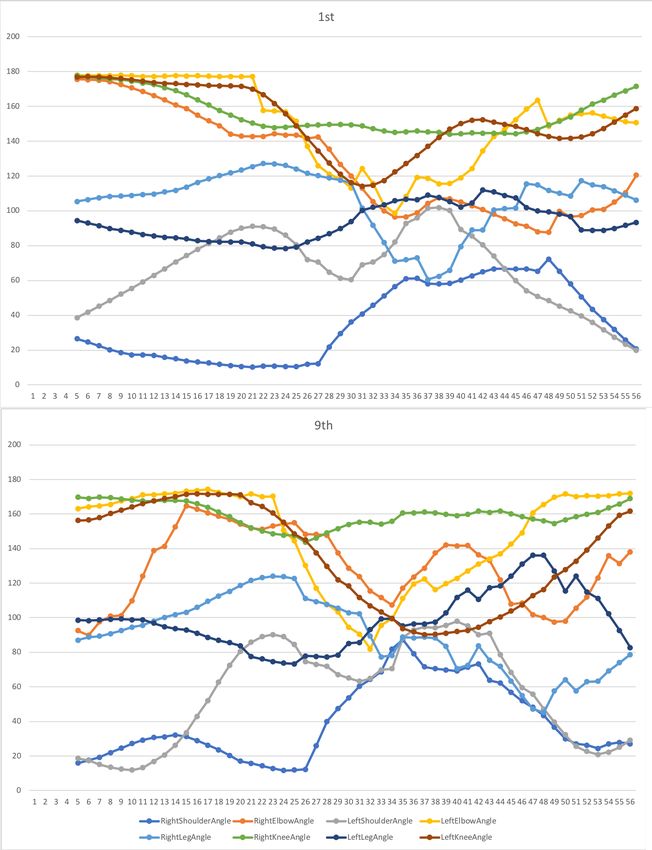
SKL2018                                                                                          2018-11-12

          recognize skeletons of multiple players in real-time, using a simple web camera,
          as shown in Fig. 1. OpenPose adopted the unique top-down position recognition
          using Deap Learning and also the unique algorithm as affiliation recognition of
          body parts by PAF (Part Affinity Fields)[2]. As a result, in the moving skeletal
          pictures generated by OpenPose, the skeleton marks are shown and overlapped
          well with the figure of people, and it seems that recognition accuracy is very high
          even for various people in various environments. OpenPose can be expected as
          a convenient generation model of available and accurate posture data. In oder
          to evaluate performance of OpenPose, we built a basketball shooting prediction
          model as a prototype using real-time skeletal data generated by OpenPose. As
          the result, we found that the shooting prediction model showed sufficient high
          accuracy. Thus, we found that OpenPose is a convenient and practical generator
          of posture data. The rest of this paper is structured as follows. In Section 2, we
          briefly review of previous posture analysis method. In Section 3, we define the
          experimental methods. In Section 4, we show experimental results. In Section
          5,we conclude this paper. In Section 6, we present future work.

                                            Fig. 1. OpenPose

          2     Previous research for posture analysis

          As a previous analysis of sports motion, there was a method called video motion
          analysis which divides video into photographs and marks points on the pose
          image for annotation[3]. As a direct sampling posture data, motion capture was
          used to collect data from sensors on body and limbs[4]. However, these methods
          are so expensive to collect data that statistical models such as regression could
          not be applied. Thus, these method were often used for argument about the dif-
          ference of posture between beginners and experts. On the other hand MicroSoft
          1
              OpenPose realizes three-dimensional acquisition by stereo (compound eye) camera
              in March 2017, but in this research, OpenPose of 2D position recognition version
              using monocular Web camera is used because of easy operation and sufficient use
              frequency.

                                                 2
SKL2018                                                                                          2018-11-12

          KINECT, which is not sold now, can easily take 3D posture data, but the sensing
          range is very narrow and recognition accuracy of skeletal point is low[5].
              As a statistical approach, it is realized that winning prediction of basketball
          game was modeled by logistic regression using records which include the winning
          / losing result and the frequency of shooting and robbing ball in the game[6].
              As a time-series analysis for motions, there was a research that tried to trans-
          fer abstracted motions from a human to a robot with hidden variables estimated
          by Hidden Markov and reversely predict the next action of the robot from esti-
          mated hidden variables [7]. However our shooting prediction of basketball free
          throw is not a general time-series model that predicts the next action from the
          last time-series of motions because our model predicts a result whether to shoot
          in the basket or not rather than an aciton. The number of persons monitored
          in this experiment was limited to 51. We adopted a logistic regression[8] using
          the features which are composed with the position of start and end or the differ-
          ence, velocity and acceleration between start and end position extracted from a
          time-series of the free throw motions.

          3     Method

          3.1    Subject of Experiment

          In order to construct the shooting prediction model of basketball free throw, we
          took movies about basketball free throw motion with web camera. The subject of
          Experiment covered various skill levels of 51 people. We generated their skeletal
          data by OpenPose from the movies. In the experiment, twenty of 51 people
          succeeded in free throw.

          3.2     Output of OpenPose

          The version of OpenPose1 adopted in this paper is for 2 dimensional skeleton
          recognition, and the skeletal coordinates of 18 points shown in Fig. 2 are out-
          putted to files by about 10 to 20 frames per second depending on a computer
          performance2 and connected as shown in Fig. 3 to make time-series data. A
          skeletal coordinate is composed of 3 values which are x as horizontal, y as verti-
          cal and p as confidence probability. We ignored low confident coordinates with
          less than 0.7 confidence probability.

          2
              Our experimental machine is CPU: AMD Ryzen 7 1800X, MEMORY: 16GB, GPU:
              NVidia GeForce GTX 1080ti,OS: Ubuntu 14.04 LTS,CUDA version: 8.0, cuDNN
              version: 5.1 for CUDA8.0

                                                 3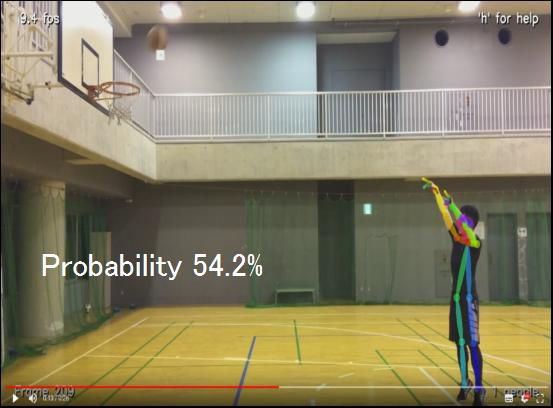
SKL2018                                                                                        2018-11-12

          Fig. 2. Skeleton points of OpenPose re-
                                                            Fig. 3. Connection of frames
          ferred from [2]

             Though we used only skeletal data for prediction of shooting model, Open-
          Pose can recognize also hands and faces as shown in Fig. 4 and outputs each
          recognized data to each file.

                 Fig. 4. Recognized finger and face points of OpenPose (cited from [2])

          3.3   Statistic model

          The shooting prediction model is a binary prediction as to whether to enter a
          basket or not. As major binary prediction models there are logistic regression[8],
          SVM[9] and Xgboost[10]. The SVM using the kernel method is a nonlinear model
          which may make high accuracy but cannot calculate the shooting probability.
          Xgboost using the stochastic gradient method that has a high reputation for ac-
          curacy and robustness is not adequate for a diagnostic model because this model
          cannot indicate explicitly the degree of importance of explanatory variables. So
          we adopted a logistic regression model as shown in Fig. 5 that is one of most
          used in data analysis.

                                                4
SKL2018                                                                                          2018-11-12

                                       Fig. 5. Logistic regression

              Probability of logistic regression is as follows using multiple regression coef-
          ficients β and features.

                                                 ∑
                                                 n
                                           Z=          βi · f eaturei                     (1)
                                                 i=1
                                                           1
                                    probability =                                         (2)
                                                     1 + exp(−Z)

          3.4   Valuable of Logistic regression

          The explanatory variables of the logistic regression model were features calcu-
          lated from the time-series data. Features include the positions of skeletal points,
          moving speed, acceleration, etc. The target variable is the fact whether a shoot-
          ing ball entered into the basket or not. In the time-series data, as shown in Fig.
          6, everyone bent knees at the start of the throw and lifted hands to the highest
          level upon completion of the throw. So we decided to define the interval of a free
          throw between the time point when the knees were bent the most as its start
          and the time point when the hands were lifted to the highest physical point as
          its end. All the coordinate positions were relative from the neck point.

                                                 5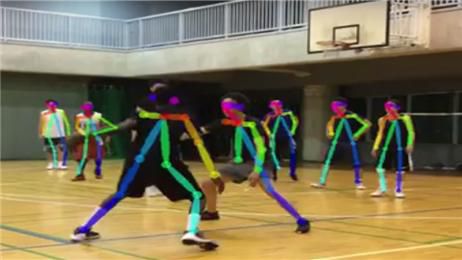
SKL2018                                                                                           2018-11-12

                                    Fig. 6. Posture of start and end

          4     Result

          4.1   Accuracy of Logistic Regression

          In general, the precision of the logistic regression model is expressed in the pareto
          diagram in Fig. 7. In this diagram, the horizontal axis shows the composition
          rate of all the members in descending order of shooting probability, and the
          vertical axis shows the composition rate of the number of people who succeeded
          in shooting into the basket. Red dots in Fig. 7 indicate number of accumulated
          people who shot in basket. About 40% people succeeded in shooting into the
          basket at this experiment. If the model was perfect, it would be represented by
          the line of the perfect model with descending order of shooting probability, and if
          the shooting probability of the model was uncorrelated with the actual shooting
          in basket, it would be the line of the uncorrelated model. The accuracy of logistic
          regression model is indicated by the ratio of the area A of the cumulative curve
          shown in Fig. 8. This figure shows that high accuracy AR = 41% was obtained.

                     Fig. 7. Parete figure                    Fig. 8. Area of AR value

                                                 6
SKL2018 2018-11-12
4.2 Interpretation of significant features in Logistic Regression
As a result, significant features that make the high shooting probability in the
logistic regression were shown in Fig. 9. The shooting probability becomes higher
when the blue color features are larger. The shooting probability also becomes
higher when the red color features get smaller. From this result, the following
was found out. It shows that the shooting probability is higher if the bend of the
knee is increased and knees are pulled quickly and at the same time the ball is
pulled and thrown over head. This motion uses the force of the knee extension
and the centrifugal force created when throwing the ball overhead.
Fig. 9. Relation for shooting probability and features
4.3 Real time Diagnosis
The diagnostic system using OpenPose can display the shooting probability in
real-time as shown in Fig. 10. and even if there are not any basket and ball, it
becomes possible to judge the skill level directly just by gesture.
7SKL2018 2018-11-12
Fig. 10. Real time diagnosis by OpenPose
4.4 Posture diagnosis
By comparing feature quantities between beginners (people with low shooting
probability) and experts (people with high shooting probability), it is possible
to diagnose the amount of correction for beginner postures. In the example of
Fig. 11, one of the remarkable differences between beginners and experts is the
position of the arm at the start. The beginners pushed the ball from the chest
but the experts put the ball in front of the head and threw the ball over head. In
this case, it is necessary to teach the beginners the form of overhead throwing.
Fig. 11. Comparison of features between beginner and senior
5 Conclusion
As a result, high accuracy was obtained in logistic regression model, the following
was found out.
1. The skeletal data recognized by OpenPose were found to be highly applicable
with sufficient accuracy.
8SKL2018 2018-11-12
2. In the previous posture diagnosis, data were generated by marking on a
picture frame from a video stream or collected sensor signals by motion
capture on the human parts. These methods were so expensive for data
collection that statistical models could not be introduced. On the other hand,
OpenPose can easily collect data by using a simple web camera, it became
possible to obtain more accurate posture diagnosis by collecting more data.
6 Future work
The data of basketball free throw in this experiment were taken from one side
only by a web camera, so it was suitable to analyze with 2 dimensional data
provided by OpenPose. However analysis of general sports motion requires 3
dimensional data like a tennis or ballet dance, so it is necessary to use 3 dimen-
sional OpenPose or expand 2D data generated by 2D OpenPose to 3D data[11].
Acknowledgment
We would like to thank Basketball Club Team of Tokyo Metropolitan College of
Technology for taking movie of basketball free throw. We would like to special
thank to Dr. Atushi Shibata of AIIT for provision of experimental computation
environment.
References
1. CMU-Perceptual-Computing-Lab,https://github.com/CMU-Perceptual-
Computing-Lab/openpose
2. Cao Z., Simon T., Wei S., Sheikh Y. : Realtime Multi-Person 2D Pose Estimation
using Part Affinity Fields,CVPR2017
3. Hulka K., Cuberek R., Svoboda Z . : Timemotion analysis of basketball players:
a reliability assessment of Video Manual Motion Tracker 1.0 software,Journal of
Sports Sciences, 2013
4. Wang X.. : An Optimization Method of Basketball Teaching and Training System
Design based on Motion Capture Technology,2017
5. Yokota K. : Construction of Motion Analysis System using Kinect
6. Shanahan J. K. : A model for predicting the probability of a win in basket-
ball,University of Iowa 1984
7. Inamura T., Nakamura Y., Toshima I.. : Embodied symbol emergence based on
mimesis theory, International Journal of Robotics Research,vol. 23, no. 4, pp.
363377, 2004.
8. Bishop C. M. : Pattern Recognition and Machine Learning 4.Linear Models for
Classification,Springer(2006)
9. Platt J. C. : Fast Training of Support Vector Machines using Sequential Minimal
Optimization,1999
10. Chen T., Guestrin C., Christopher : XGBoost: A Scalable Tree Boosting Sys-
tem,Arixv2016
9SKL2018 2018-11-12
11. Kudo Y., Ogaki K., Matusi Y., Odagiri Y. : Unsupervised Adversarial Learning of
3D Human Pose from 2D Joint Locations,arXiv:1803.08244
12. Kempka M., Wydmuch M., Runc G., Jaskowski W. : ViZDoom: A Doom-based AI
Research Platform for Visual Reinforcement Learning , 2016 IEEE Conference
10SKL2018 2018-11-12
Detecting Freezing-of-Gait Symptom in
Parkinson’s Disease by
Analyzing Vertical Motion from Force Plate
Dinh-Khiet Le 1 , Takuma Torii 1 , Tsutomu Fujinami 1 , Wannipat Buated 2 ,
and Praween Lolekha 3
1
Japan Advanced Institute of Science and Technology,
1-1 Asahidai, Nomi, Ishikawa 923-1292, Japan
2
Department of Physical Therapy, Faculty of Allied Health Sciences,
Thammasat University, Thailand
3
Neurology Division, Department of Internal Medicine, Faculty of Medicine,
Thammasat University, Thailand
Abstract. Introduction: Freezing of Gait (FoG) is a common symp-
tom in Parkinson’s Disease (PD), which has impact on the gait pat-
tern and relevant to risk of falls. Data-driven approach to FoG detection
would allow systematic assessment of patient’s condition and objective
evaluation of the clinical effects on treatments. Many researchers recently
studied FoG in PD by analyzing patient’s center of pressure dynamics
in term of various features such as path-length. Objective: In this re-
search, we attempt to automatically separate two groups of PD patients
that with and without FoG by considering standing balance ability dur-
ing cognitive loading tasks. Methods: The dataset consists of sixty PD
patients (Hoehn and Yahr stages 1-3) were collected from Thammasat
University Hospital, Thailand. The participants were categorized either
to be FoG or non-FoG according to the Freezing of Gait-Questionnaire
(FoG-Q) scores. Their postural balance ability was measured with Nin-
tendo Balance board which produces a time-series of center of pressure
along with the value of changing weight. We turn to a new kind of fea-
ture named ”FVA” which informs us the acceleration due to the body’s
up-down motion, and employ Wilcoxon signed-rank statistic to compare
the changing of postural control between one with the cognitive load-
ing state (Reading or Counting Backward) and the other in the rest
state (Before I or Before II). We also use Student’s t-test statistic to
analyze the difference of the changing of postural control between two
groups, FoG and non-FoG. Results: Significant increases of FVA were
observed for all cases (for all data, for each group) with cognitive load-
ing (pSKL2018 2018-11-12
of pressure (such as path-length). Conclusions: The new feature FVA
seems to well reflex postural control in people with PD. It informs us the
postural instability in PD, which is more informative than other indices
when the subject are under cognitive loading. It is also monotonous with
level of complexity of cognitive loading, and is sensitive with FoG group.
Keywords: Parkinson’s disease, Postural control, Cognitive loading,
Freezing of gait
1 Introduction
Freezing-of-gait (FoG) is a common clinical symptom in Parkinson’s disease[2]
(PD), observed as inability to start doing a motion and shaking/shuffling gait
in a motion [13, 9]. FoG is usually found in PD patients in the advanced stages,
but recently FoG has been reported in the early stages as well. Approximately
44–53% of PD patients have the symptom of FoG [6, 12] and the percentage
increases up to 80% of PD patients in the advanced stages [17, 10]. PD patients
with FoG often have significant changes in their gait progression, decreased foot
length, and tremors in FoG attacks [13]. Due to these changes, a basic risk for
PD patients with FoG is falling over [15, 1, 14] and so PD patients with FoG
are exposed to high risk of fatal accidents, such as fractures or immobility [3].
Therefore, early detection of FoG symptom among PD patients is helpful to
prevent them from such accidents, as well as to improve their quality of life.
The mechanism of FoG is yet not entirely understood up to now. Currently,
with or without FoG is classified by clinical assessment but often detected af-
ter accidents. Recent researches have attempted to elucidate procedures of FoG
assessments by incorporating recent findings on the relationship between FoG
and other factors. In bio-mechanical approach, Pelykh et al. [16] and Buated
et al. [4] characterized the postural control ability of PD patients during cogni-
tive loading tasks by analyzing their center-of-pressure time series. Both studies
showed reduced postural control during cognitive loading tasks in both FoG and
non-FoG groups; however, no significant difference between groups was reported.
In clinical approach, Duncan et al. [8] invented the sub-clinical screening test,
called the BESTest, to examine some difference between FoG and non-FoG and
obtained high reliability (p < 0.001). However, a shortcoming of this test is tak-
ing longer than 30 minutes, and expert factors will be cause of limitations in
clinical application to a large number of patients.
In this study, our objective is to defect the freezing-of-gait (FoG) symptom
in Parkinson’s disease (PD) patients based on physical or bio-mechanical data.
For this objective, we develop a new feature statistic (or factor) for automat-
ically detecting the FoG symptom of PD patients, easily applicable in clinical
assessments. To test our proposed feature, including the standard path length,
we analyzed the center-of-pressure time series under cognitive loading tasks.
12SKL2018 2018-11-12
2 Methodology
2.1 Participants
We briefly describe our data, originally collected by our colleagues [4]. See Buated
et al. [4] for details.
60 patients (24 males and 36 females) with Parkinson’s disease (PD) were
recruited and their center-of-pressure time series were collected in Thammasat
Hospital, Thailand. Their clinical stages of Parkinson’s disease were classified
according to the modified Hoehn & Yahr scale [11]. Patients who can stand alone
for 3 minutes were included to this study. Patients with other problems (e.g.,
atypical parkinsonism, unable to stand without support, partial or complete
blindness, etc.) were excluded. All participants with Parkinson’s disease were
examined during the on-time medication without presenting excessive rigidity,
bradykinesia, or tremor.
2.2 Apparatus and Procedures
Center-of-pressure (CoP) time series were recorded using a force place, called
Nintendo Wii Balance Board [5], which is a platform for measuring distribution
of weight bearing of the subject on it. A recorded data consists of the rela-
tive positions of the center-of-pressure (CoP) along the medial-lateral (x) and
anterior-posterior (y) dimensions, on the two dimensional surface of the Wii
Balance Board. Plus, as a force plate, this Wii Balance Board can record the
additional dimension, we call it, ‘weight’ acting on the balance board surface,
due to the motion of the subject. This ‘weight’ is measured in units of kilo-
gram [kg], unlike the units in physics [kg × g] with gravitational acceleration
g = 9.8(m/s2 ).
Each patient was instructed first to stand upright on the balance board,
looking horizontally to a marker on the wall at 3 meter apart, and then to follow
the four instructions: (1) Before I: Keep standing for 30 seconds; (2) Reading
(RE): Keep standing with reading a material for 30 seconds; (3) Before II: Keep
standing for 30 seconds; and (4) Counting Backward (CB): Keep standing with
counting numbers backward for 30 seconds.
3 Features for Postural Instability
In this section, we described the newly proposed feature statistic, called Fluctu-
ation of Vertical Acceleration (FVA), as well as the clinical standard, known as
path length.
3.1 Path Length
Path length is simply the total length of a CoP path. Given time series of CoP
(x(t), y(t)) at time frame t, it was calculated by summing up the distances be-
13SKL2018 2018-11-12
tween consecutive data points [7], i.e.,
Xp
PathLength := [x(t + 1) − x(t)]2 + [y(t + 1) − y(t)]2 (1)
t
3.2 Fluctuation of Vertical Acceleration (FVA)
We derive a new feature statistic, we name it, Fluctuation of Vertical Accel-
eration (FVA). As we have described, the Wii Balance Board can record the
‘weight’, divided by 9.8(m/s2 ) (unit equivalent to kg) of the subject for each
time. This ‘weight’ has not been incorporated for characterizing the balance dy-
namics of PD patients. You may think that it is strange if the ‘weight’ of the
subject changes over time. Then, we have to clarify the difference of ‘weight’
and ‘mass’ in physics terminology. In physics, ‘weight’ is simply the mass × 9.8,
in units of kg × 9.8, where 9.8 is the gravitational acceleration on Earth. If the
subject has exactly no motion on the balance board (or force place), then the
‘mass’ of the subject and ‘weight’ divided by 9.8 can take the same or close
value. However, if the subject has in motion on it, then the force (or kinetic
acceleration) acted on the surface of the balance board can be detected and
included in part of the ‘weight’ measured by the balance board. And so, the
‘weight’ of the subject measured can vary over time. In other words, the 3rd
dimension of recorded data, ‘weight’ divided by 9.8, contains information due
to vertical acceleration. In this paper, we proposed to incorporate this feature,
vertical acceleration, to characterize the postural stability of subjects.
According to the Newton’s second law, the weight w̄ on Earth at the rest
state is the body mass m times gravitational constant g: w̄ = mg. In addition
to this, the weight w(t) measured by the balance board at time t can include
the additional factor due to the acceleration (or force) approximately along the
vertical az (t): w(t) = mg + maz (t). Then, from recorded time series w(t), we
can extract the vertical acceleration at time t by
w(t) − w̄
az (t) = . (2)
m
Taking the ratio gives a quantity independent of the body mass m as
az (t) w(t)
= −1 . (3)
g w̄
which is in units of percent [%]. The value of w̄, the weight at no motion, can
be measuredP by a weight scale at home or estimated by the average over time
w̄ = (1/T ) t w(t). Finally, our new feature, Fluctuation of Vertical Acceleration
(FVA), is defined as its deviation from the mean
az (t)
FVA = std × 100 , (4)
g
where the std(·) operator calculates the standard deviation.
14SKL2018 2018-11-12
3.3 Visualization of Features
Figure 1(a) visualized a CoP path of a patient. Four colors, green, red, yellow,
and blue, were used for the four conditions, i.e., Before I, Reading, Before II,
Counting Backward, respectively. In Figure 1(b), we showed the time series of
Vertical Acceleration (VA), calculated by using Equation (3). Our new feature,
Fluctuation of Vertical Acceleration (FVA), Equation (4), characterizes the vari-
ation of Vertical Acceleration in Figure 1(b).
Before I Before I
3 Reading Reading
Before II Before II
Counting Backward 102 Counting Backward
2
101
1
relative weight (%)
Y (cm)
100
0
99
−1
98
−2
−1.0 −0.5 0.0 0.5 1.0 1.5 20000 40000 60000 80000 100000 120000
X (cm) time (ms)
(a) Center-of-Pressure path (b) Vertical Acceleration (VA)
Fig. 1: (a) A visualization of a patient’s center-of-pressure data. The green, red,
yellow, and blue colors corresponds to the four conditions: Before I, Reading,
Before II, Counting Backward. (b) Part of the new feature, Vertical Acceleration,
in Equation (3).
4 Results
4.1 Data Processing
In our data analyses, for each PD patient’s CoP path, we calculated two feature
statistics, Path Length (PL) and Fluctuation of Vertical Acceleration (FVA), for
four data segments corresponding to the four conditions of our data recording:
i.e., Before I, Reading, Before II, and Counting Backward. In some analyses, we
also used two combined features, difference in the values of each feature (FVA
or PL) between Before I and Reading and between Before II and Counting
Backward. Resulting, we obtained 4 × 2 = 8 features, or 4 × 2 + 4 features for
each PD patients.
15SKL2018 2018-11-12
PD patients were classified into two groups, FoG and non-FoG, based on
FoG-Q scores, FoG-Q ≥ 6 for FoG (n = 39) and the rest for non-FoG (n = 21).
Table 1 is the summary of two kinds of feature statistics for all combinations
of the four conditions times three subsets of data. Each cell of Table 1 contains
µ ± σ as the mean µ and the standard deviation σ. In most cases, the mean
values increase from non-FoG to FoG and from Before I, Before II, RE, to CB,
orderly.
Feature FVA Path length
Task All data FoG non-FoG All data FoG non-FoG
Before I 0.23 ± 0.18 0.25 ± 0.21 0.19 ± 0.08 81 ± 33 85 ± 39 73 ± 14
RE 0.32 ± 0.32 0.36 ± 0.39 0.23 ± 0.07 93 ± 58 100 ± 70 79 ± 16
Before II 0.27 ± 0.28 0.32 ± 0.34 0.20 ± 0.06 89 ± 47 95 ± 56 77 ± 17
CB 0.41 ± 0.54 0.48 ± 0.65 0.28 ± 0.12 109 ± 82 121 ± 98 87 ± 24
Table 1: The average and standard deviation of FVA and path length in the
dataset. RE = Reading; CB = Counting Backward; FVA: unit in percent; Path
length: unit in centimeter
4.2 Goals and Procedures of Statistical Analysis
In this study, we set two goals for analysis. Firstly, we analyze the effects of the
cognitive loading tasks (Reading and Counting Backward) on postural control
by comparing them from the preceding rest conditions (Before I and Before II),
within the groups. Secondly, to demonstrate the power of the new feature for
detection of FoG in PD patients, we compared the effects on postural control
between the groups, the FoG and non-FoG group. To evaluate the influence of
cognitive loading to postural control within the groups, we used the Wilcoxon
signed-rank test with the null hypothesis of no difference between the tasks. To
evaluate differences between the groups, we used the Student’s t-test with the
null hypothesis of no difference between the groups.
4.3 Impact of Cognitive Loading on Postural Control
The results of empirical data analysis showed in Table 2. Each cell contains the p-
values of Wilcoxon signed-rank statistics in comparison between the conditions.
We observed that both FVA and PL produced the significant influence (mostly
p ≤ 0.01) of cognitive loading on posture control. Generally, using FVA tends
to be more significant. The results suggest that both features, FVA and PL,
can work for defecting FoG in comparing the CoP paths within the groups or
between the conditions.
We observed the influence of the cognitive loading tasks, within the groups,
also in Figure 2. Figure 2 shows the FVA’s of all patients, their ID = 0, 1, 2, . . . , 59,
16SKL2018 2018-11-12
separately, along the horizontal axis of each figure. The bottom figure includes
all four conditions, i.e., Before I (green), Reading (red), Before II (yellow), and
Counting Backward (blue). The top-left includes only Before I (green) and Read-
ing (red) and the top-right includes only Before II (yellow) and Counting Back-
ward (blue). We also observed the increases in FVA’s clearly from Before I
(green) to Reading (red), and from Before II (yellow) to Counting Backward
(blue).
Task FVA Path Length
A B All data FoG non-FoG All data FoG non-FoG
Before I RE < 0.001 < 0.001 < 0.001 < 0.001 < 0.001 < 0.001
Before II CB < 0.001 < 0.001 < 0.001 < 0.001 < 0.001 < 0.001
Before II RE < 0.001 0.002 < 0.001 0.010 0.044 0.120
RE CB < 0.001 0.035 0.021 0.002 0.008 0.010
Before I Before II < 0.001 0.001 0.01 0.003 0.01 0.006
Table 2: Results (p-values) of Wilcoxon signed-rank test between the experimen-
tal conditions. RE = Reading, CB = Counting Backward
4.4 Comparison between the FoG and non-FoG group
Next, we examined differences between the FoG and non-FoG group. In this
analysis, we used the combined features, described in the section of data pro-
cessing, denoted by ∆(Before I, RE) for the difference in a feature between the
Before I and Reading condition, and ∆(Before II, CB) between the Before II and
Counting Backward condition. The results showed in Table 3 with p-values of
the Student’s t-test. We observed the significant difference between the non-FoG
and FoG group, in using both features, FVA and PL. In some cases, using FVA
tends to be more significant.
We can also confirm visually the results of statistical tests in Figure 3. Fig-
ure 3, the left two figures compare the impacts of the Reading task and the right
two figures compare the impacts of the Counting Backward task. The bottom
two figures contain the FVA’s of PD patients with non-FoG and the top two
figures contain the FVA’s of PD patients with FoG. From these figures, we ob-
served that the patients with FoG tend to show larger individual variation in
FVA, in both the cognitive loading tasks.
5 Discussion
In this paper, we tried to defect the freezing-of-gait (FoG) symptom in Parkin-
son’s disease (PD) patients based on physical or bio-mechanical data. In our data
analysis, in addition to the standard Path Length (PL), we evaluated our newly
proposed feature, called Fluctuation of Vertical Acceleration (FVA). Our results
17SKL2018 2018-11-12
3.5 before I 3.5 before II
reading CB
3.0 3.0
2.5 2.5
2.0 2.0
FVA
FVA
1.5 1.5
1.0 1.0
0.5 0.5
0.0 0.0
0 10 20 30 40 50 60 0 10 20 30 40 50 60
patient's index patient's index
FVA for all dataset
3.5 before I
reading
3.0 before II
CB
2.5
2.0
FVA
1.5
1.0
0.5
0.0
0 10 20 30 40 50 60
patient's index
Fig. 2: Comparison of FVA between the experimental conditions. Before I
(green), Reading (red), Before II (yellow), and Counting Backward (blue).
Task FVA Path length
Before I 0.073 0.054
RE 0.018 0.035
Before II 0.017 0.042
CB 0.034 0.023
∆(Before I, RE) 0.010 0.040
∆(Before II, CB) 0.085 0.022
Table 3: Results (p-values) of Student’s t-test between the FoG and non-FoG
group. RE = Reading and CB = Counting Backward. ∆(Before I, RE) = change
from Before I to Reading. ∆(Before II, CB) = change from Before II to Counting
Backward.
18SKL2018 2018-11-12
BeforeI BeforeII
3.5 Reading 3.5 CB
3.0 3.0
2.5 2.5
2.0 2.0
FVA
FVA
1.5 1.5
1.0 1.0
0.5 0.5
0.0 0.0
0 10 20 30 0 10 20 30
FOG FOG
BeforeI BeforeII
3.5 Reading 3.5 CB
3.0 3.0
2.5 2.5
2.0 2.0
FVA
FVA
1.5 1.5
1.0 1.0
0.5 0.5
0.0 0.0
0 5 10 15 20 0 5 10 15 20
Non-FOG Non-FOG
Fig. 3: Comparison of FVA between the FoG and non-FoG group. Before I
(green), Reading (red), Before II (yellow), and Counting Backward (blue).
19SKL2018 2018-11-12
suggest that both PL and FVA can work for defecting the FoG symptom. Thus,
our new feature, FVA, can be as good as the clinical standard, PL. In our results,
we observed that, in some experimental conditions, our new feature, FVA, can
be better than PL. This suggest that we can develop some experimental schemes
suitable for FVA, which can be helpful for earlier defection of the FoG symptom.
One of our future works is to develop such experimental schemes, toward data-
driven clinical assessments, to help people with the freezing-of-gait symptom in
Parkinson’s disease patients.
References
1. Allen, N., Schwarzel, A., Canning, C.: Recurrent falls in parkinson’s disease: a
systematic review. Parkinson’s Disease 2013, 906247 (2013)
2. Bloem, B., Hausdorff, J., Visser, J., Giladi, N.: Falls and freezing of gait in parkin-
son’s disease: a review of two interconnected, episodic phenomena. Movement
Disorders 19, 871–884 (2004)
3. Bloem, B., Steijns, J., Smits-Engelsman, B.: An update on fall. Current Opinion
in Neurology 16, 15–26 (2003)
4. Buated, W., Lolekha, P., Hidaka, S., Fujinami, T.: Impact of cognitive loading
on postural control in parkinson’s disease with freezing of gait. Gerontology and
Geriatric Medicine 2, 1–8 (2016)
5. Clark, R., Bryant, A., Pua, Y., McCrory, P., Bennell, K., Hunt, M.: Validity and
reliability of the nintendo wii balance board for assessment of standing balance.
Gait & Postural 31, 307–310 (2010)
6. Contreras, A., Grandas, F.: Risk factors for freezing of gait in parkinson’s disease.
Journal of the Neurological Sciences 320, 66–71 (2012)
7. Donker, S., Roerdink, M., Greven, A., Beek, P.: regularity of center-of-pressure
trajectories depends on the amount of attention invested in postural control. Ex-
perimental Brain Research 181, 1–11 (2007)
8. Duncan, R., Leddy, A., Cavanough, J., Dibble, L., Ellis, T., Ford, M., et al: Balance
differences in people with parkinson’s disease with and without freezing of gait.
Gait & Posture 42 (3), 306–309 (2015)
9. Giladi, N., Nieuwboer, A.: Understanding and treating freezing of gait in parkin-
sonism, proposed working definition, and setting the stage. Movement Disorders
23, S423–425 (2008)
10. Hely, M., Reid, W., Adena, M., Halliday, G., Morris, J.: The sydney multicenter
study of parkinson’s disease: the inevitability of dementia at 20 years. Movement
Disorders 23, 837–844 (2008)
11. Hoehn, M., Yahr, M.: Parkinsonism: Onset, progression and mortality. Neurology
17, 427–442 (1967)
12. N.Giladi, Treves, T., Shabta, H., Orlov, Y., Kandinov, B., et al: Freezing of gait in
patients with advanced parkinson’s disease. Journal of Neural Transmission 108,
53–61 (2001)
13. Nutt, J., Bloem, B., Giladi, N., Hallett, M., Horak, F., Nieuwboer, A.: Freezing
of gait: moving forward on a mysterious clinical phenomenon. Journal of the
Neurological Sciences 10, 734–744 (2011)
14. Paul, S., Allen, N., Sherrington, C., Canning, C., Fung, V., Close, J., et al: Risk
factors for frequent falls in people with parkinson’s disease. Journal of Parkinson’s
Disease 4, 699–703 (2014)
20SKL2018 2018-11-12
15. Paul, S., Sherrington, C., Canning, C., Fung, V., Close, J., Lord, S.: The relative
contribution of physical and cognitive fall risk factors in people with parkinson’s
disease: a large prospective cohort study. Neurorehabilitation and Neural Repair
28, 282–290 (2013)
16. Pelykh, O., Klein, A., Botzel, K., Kosutzka, Z., Ilmberger, J.: Dynamic of postural
control in parkinson patients with and without symtoms of freezing of gait. Gait
& Postural 42, 246–250 (2015)
17. Tan, D., McGinley, J., Danoudis, M., Lansek, R., Morris, M.: Freezing of gait
and activity limitations in people with parkinson’s disease. Archives of Physical
Medicine and Rehabilitation 92, 1159–1165 (2011)
21SKL2018 2018-11-12
Relationship between degrees of freedom and adaptability or
flexibility in human postural standing
Kentaro Kodama 1, Kazuhiro Yasuda2, and Hideo Yamagiwa 3
1 Kanagawa University, 3-27-1, Rokkakubashi, Kanagawa-ku, Yokohama-shi, Kanagawa, Japan,
kkodama@kanagawa-u.ac.jp
2 Waseda University, 3-4-1 Okubo, Shinjuku-ku, Tokyo, Japan,
kazuhiro-yasuda@aoni.waseda.jp
3 Tokyo Metropolitan Tobu Medical Center, 3-3-25, Shinsuna, Koto-ku, Tokyo, Japan,
somatolearning@gmail.com
Abstract. This study aimed to investigate the direct relationship between the joint de-
grees of freedom (DoF) of human movement system and its postural dynamics in terms
of adaptability/flexibility. In our pilot experiment we fixed the join DoF (knee and an-
kle) to constrain the functional DoFs (one for knee, two for ankle). Young healthy par-
ticipants were required to maintain single-leg standing task with their dominant leg
fixed. The center of pressure (COP) trajectory data were measured and analyzed by
linear and nonlinear methods to assess static and dynamic property of their postural
dynamics. As a result of comparing across conditions (normal no-fixation, ankle and
knee fixation condition), static measure (COP trajectory length) did not significantly
differ across conditions. However, dynamic measures (the fractal scaling exponent and
sample entropy) significantly differed. The ankle joint fixation affected the scaling be-
havior (weakening the under-diffusive postural control process), and sample entropy
decline (losing efficiency of postural control) in the ML direction. These results seemed
to agree with the notion of the loss of complexity framework.
Keywords: loss of complexity, freezing degrees of freedom, single-leg standing, frac-
tal analysis, entropy analysis
1 Introduction
1.1 Adaptability/flexibility as an
embodied skill
Adaptability and flexibility can be considered unique abilities of human beings or living
organisms in contrast to traditional robots or artificial intelligence (AI). These abilities enable
living systems to adapt flexibly to their environment which can vary dynamically. In the AI
research field, such a dynamic ability to respond to dynamic situations and behave flexibly
is considered an essential feature of intelligence (Suwa, 2013). It is also related to another
important concept embodiment. The living body consists of perception and action systems
that have dynamic real-time interactions with their environment (Gibson, 1966). Authors
have called such an embodied skill dynamic embodied adaptability and it is supposed to be
a characteristic property of living systems, which differ from traditional robots or AI
(Kodama, Kikuchi, & Yamagiwa, 2017). Although these artificial systems are good at re-
peating the same movement or process in the same way, living systems are not; however,
they perform the same task in a variety of the different ways. Such variability is an important
-1-
22SKL2018 2018-11-12
feature of human skilled performance particularly in terms of adaptable/flexible behavior
(Bernstein, 1967; Kudo & Ohtsuki, 2008).
For example, Nonaka (2013) investigated skilled coordinated behavior of an exceptional
tetraplegic individual who has practiced Japanese calligraphy with a mouth-held brush
(Nonaka, 2013). The author showed evidence that joint configuration variances at different
phases of writing were structured so as to maintain some important task variables across
different realizations of the writing task; moreover compensatory coupling between joint var-
iables contributed to the observed structure of joint configuration variance (Nonaka, 2013).
In another study, he and his colleague compared flexible bead-making behavior of bead
craftsmen with different skill levels (Nonaka & Bril, 2014). As a result, they found that the
highly skilled craftsman had rich flexibility and exquisite context sensitivity as well as the
largest interstroke variability in the coordination of movement (Nonaka & Bril, 2012, 2014).
Ito and her colleagues examined the role of postural control in a skilled task that requires
perceptual-motor coordination of expert Kendama players (Ito, Mishima, & Sasaki, 2011).
They revealed the importance of flexibility of knee movement to support dynamical coordi-
nation between body movement and the moving ball and the stability of the strong coupling
of the head and the ball (Ito et al., 2011). Then how can adaptability/flexibility be realized
and how can variability of observed data be explained?
1.2 Degree of freedom and complex systems
In human movement science and skill science research fields, it is said that the functional
degrees of freedom (DoF) can provide the human movement system with the foundation of
adaptive/flexible or skilled behavior. The human body has many multifarious DoFs, from the
microscopic cell level to macroscopic joint level (Bernstein, 1967; Turvey, 1990). The DoF
problem suggested that the large number of controllable DoFs poses a computational burden
to the central nervous system, if we assume a computational model (Turvey, 1990). This
indicates the difficulty of the unidirectional top-down motor control model using computer
metaphor. Bernstein, who proposed the DoF problem, supposed that each component (DoF)
is coordinated and coupled with other components to organize a functional unit (synergy)
rather than being controlled separately (Bernstein, 1967). Bernstein attempted to solve the
DoF problem with the idea of synergy. Such coupled components are not organized in non-
directional or random ways, but in sensitive and flexible way to achieve a specific task in a
specific situation/environment (Bernstein, 1996).
Although the DoF problem is actually a problem from the viewpoint of the computational
model (top-down motor control model), it is also possible to consider redundant DoFs as a
benefit to enable movement systems to behave adaptably/flexibly. The human body has an
intrinsic fluctuation derived from a physiological mechanism and is exposed to external per-
turbation from its environment or own body movement. However, if the system has redun-
dant DoFs and an ability to freeze and release them quickly, it might realize stable behavior
in an adaptive/flexible way against intrinsic fluctuation or external perturbation (Kodama &
Aoyama, 2017).
After Bernstein’s proposal of the DoF problem and the idea of synergy, the self-organiza-
tion theory (Haken, 1978; Nicolis & Prigogine, 1977) was applied to human movement stud-
ies to understand emergent properties of a human movement system. It is called the dynam-
ical systems approach (DSA) and has been widely applied to human movement science areas.
Compared to the traditional approach to motor behavior assuming internal computation, DSA
focuses more on interactions between the body (including brain), environment, and task
(Davids, Glazier, Araújo, & Bartlett, 2003). While the traditional top-down motor control
model supposes a dominant central system (i.e., brain) and focuses on its component, DSA
focuses on the interaction among system’s component (Van Orden, Holden, & Turvey,
-2-
23SKL2018 2018-11-12
2003). Complex systems consist of a large number of interacting components (DoF); the
emergent behavior of the system is self-organized and can be difficult to anticipate from
dynamics of the individual components (Boccara, 2003). Their emergent behavior does not
result from the existence of a central controller like brain (Boccara, 2003).
1.3 Loss of complexity hypothesis
The perspective of the self-organizing theory provides new insight and a useful framework
for not only human movement science and skill science, but also the clinical and therapeutic
research fields. The loss of complexity hypothesis is a broad theoretical perspective applied
widely to physiological and behavioral processes (Lipsitz & Goldberger, 1992). According
to the hypothesis, the age- and/or disease-related changing process can be defined by a pro-
gressive loss of complexity within the dynamics of physiologic outputs (e.g., physiological
and behavioral data) (Manor & Lipsitz, 2013). In other words, loss of complexity leads to an
impaired ability to adapt to stressors or perturbation (Lipsitz & Goldberger, 1992). It is sup-
posed to be due to a loss or impairment of functional components, and/or altered nonlinear
coupling between these components (Lipsitz & Goldberger, 1992). Thus, the hypothesis as-
sumes that a system’s adaptive/flexible function relates to its complexity and is observed in
the dynamics of the system’s output behavior (e.g., physiological and behavioral times series
data). Moreover, these dynamics are characterized by the presence of fractal scaling or the
amount of regularity/predictability in the dynamics (Lipsitz & Goldberger, 1992; Stergiou,
2016).
For postural balance studies, the loss of complexity hypothesis has been applied and the
center of pressure (COP) fluctuation is supposed to relate to the adaptive/flexible function of
the postural system. For example, the postural dynamics of healthy young and healthy elderly
people have high complexity than that of elderly people who have a history of falls (Costa et
al., 2007). Parkinson’s disease patients also show lower flexibility in terms of deterministic
structure of the COP dynamics than healthy participants (Schmit et al., 2006). Sensory im-
pairments contributed to a decreased COP complexity, which reflected a reduced adaptive
capacity of the postural control system (Manor et al., 2010).
Those postural balance studies applied nonlinear analysis methods like fractal analysis and
entropy analysis to COP time series data. Fractal analysis is a time series analysis that obtains
a dynamic measure. It can evaluate the temporal correlation of a time series (Brown &
Liebovitch, 2010). Such a property is called a fractal property or 1/f noise and indicates that
fluctuations in the time series extend across many time scales (Eke, Herman, Kocsis, &
Kozak, 2002). Such relative independence of the underlying processes at different time scales
suggests that 1/f noise renders the system more stable and more adaptive to internal and ex-
ternal perturbations (Delignières, Torre, & Lemoine, 2005). Thus, fractal property is consid-
ered a dynamic measure and is associated with health/pathology (Lipsitz & Goldberger,
1992) and flexibility/adaptability (Hausdorff, 2009). To assess the complexity of the system,
dynamic measure based the idea of entropy derived from information theory has been also
applied to biological and physiological data. Entropy refers to the rate of information gener-
ation by a system. While repeating systems generate less new information, systems with var-
ying complexly generate new (non-redundant) information when the system visits new states.
Generally, high entropy means relatively irregular and complex variability. In contrast, low
entropy means regular and predictable behavior. According to the loss of complexity hypoth-
esis, healthy systems are characterized by an irregular and complex variability, whereas dis-
ease or aging is associated with regularity/predictability and less complexity (Goldberger et
al., 2002; Pincus, 1991).
It is supposed that the loss of complexity relates to a decline in the capability to reorganize
the interactions between its components (its functional DoF) to adjust the degree of
-3-
24SKL2018 2018-11-12
unpredictability of behavioral fluctuations to meet task demands (Sleimen-malkoun,
Temprado, & Hong, 2014). Aging and/or disease are involved in change in coupling between
components (DoFs) and the decrease in interaction between them. In other words, systems
with less interaction between their components and few functional DoFs tend to behave reg-
ularly and their dynamics lose dimensionality or complexity (Sleimen-malkoun et al., 2014).
However, most previous studies have investigated the relationship between DoF and system
dynamics by comparing particular populations such as elderly/impaired people with healthy
young people. In these cases, it is difficult to reveal the direct relationship between the DoF
and system dynamics because other factors derived from aging and/or disease cannot be ig-
nored.
1.4 Our research aims
As an exploratory investigation, our pilot study manipulated the DoF of a human move-
ment system (i.e., joint) as an independent variable, and compared different DoF conditions
within subjects. We fixed and constrained the ankle joint (two DoFs) and knee joint (one
DoF) of the dominant leg and required young healthy participants to perform single-leg
standing task by their dominant legs; this was compared to the no-fixation normal condition.
The COP trajectory data were measured and analyzed by linear and nonlinear methods to
assess a static and dynamic properties of the postural dynamics. Then, the direct relationship
between the DoF and COP dynamics was investigated. Such an investigation may lead to
deeper understanding of their relationship and provide an experimental evidence of the loss
of complexity hypothesis.
2 Method
2.1 Participants
Six healthy male participants (average = 23.50 (SD=4.68) years, all right-handed) were
recruited to join the experiment. The experimental procedures were approved by the research
ethics committee of Kanagawa University, where the experiment was conducted. Each par-
ticipant provided informed consent for participation in this study.
2.2
Joint fixation equipment (REAQER ankle supporter, REAQER knee supporter, Fig.1)
were used to fix the ankle and knee joints. The center of pressure (COP) trajectories were
measured using a force plate (Leptrino CFP600YA302US, sample rate = 200 Hz). To process
and analyze COP data, MATLAB (R2017b, MathWorks) and RStudio (Version 1.1.423)
were used to process and analyze the COP data.
2.3 Procedure
In the current pilot experiment, three conditions were compared, namely, the normal con-
dition (no joint fixation), ankle condition (ankle joint fixation), and knee condition (knee
joint fixation) as shown in Fig.1. Under the joint fixation conditions, each joint of the domi-
nant leg (i.e., right leg) of each participant was fixed using the equipment. Each participant
was asked to maintain single-leg standing with their dominant leg for 35-s. After conducting
the normal condition task first as a baseline condition, the ankle and knee condition tasks
-4-
25SKL2018 2018-11-12
were counterbalanced between the participants. Under each condition, they were required to
repeat a 35-s trial four times with 30-s interval between trials, and with 3-min rest between
conditions.
Fig. 1. Experimental conditions and joint fixation equipment (Left: Normal condition, Middle: An-
kle condition, Right: Knee condition).
2.4 Data Analysis
After measuring the COP trajectory data, we removed the initial 5-s data and analyzed the
remaining 30-s of time series data of the COP in the mediolateral (ML) and anteroposterior
(AP) directions. Before performing the following time series analyses, all COP data were
smoothed by a 10-Hz low-pass filter (4th order Butterworth filter).
To assess postural stability, the COP trajectory length was calculated and regarded as a
static measure (Horak, 1989; Shumway-Cook & Woollacott, 2013). This measure defines
shorter trajectory length as less movement (less postural sway) and it means more stable
posture. In this sense, we interpret this as a static measure.
By contrast, to evaluate dynamic postural stability, we also applied nonlinear time series
analyses, detrended fluctuation analysis (DFA; Peng et al., 1994) and sample entropy
(SampEn; Richman, R., & Moorman, 2000). DFA is a fractal analysis for nonlinear time
series data, and has been used to assess a system’s adaptability/flexibility (Hausdorff, 2009)
in terms of temporal correlation in time series data (Brown & Liebovitch, 2010). DFA cal-
culates the scaling exponent α as the slope of the log-log plot of fluctuation vs. time scale. A
linear relationship on a log-log plot indicates the presence of scaling. The DFA scaling ex-
ponent α is interpreted as an estimation of the Hurst exponent H, and is related to H as fol-
lows (Delignières, Torre, & Bernard, 2011): if 0 < α < 1, then H=α; if 1 < α < 2, then H=α-
1. H can be interpreted for the time series as follows: if 0 < H < 0.5, the time series is anti-
persistent/under-diffusive; if H = 0.5, it is uncorrelated (white noise); if 0.5 < H < 1, it is
persistent/over-diffusive; if H = 1, it is considered 1/f noise (Marmelat, Torre, & Delignières,
2012). Sample entropy analysis is a method with which to quantify the complexity or irreg-
ularity of a time series (Richman et al., 2000). Sample entropy (SampEn) indexes the (ir)reg-
ularity of a time series and is used to analyze the dynamics of complex systems. While a
smaller sample entropy means greater regularity, a larger sample entropy indicates relatively
irregular or complex dynamics. For a given embedding dimension m, tolerance r, and number
of data points N, SampEn is the negative logarithm of the probability that if two sets of sim-
ultaneous data points of length m have distance < r then two sets of simultaneous data points
of length m+1 also have distanceYou can also read