CHAPTER 3: PASSENGER RAIL - Kentucky Transportation Cabinet
←
→
Page content transcription
If your browser does not render page correctly, please read the page content below
Kentucky Statewide Rail Plan 2015
CHAPTER 3: PASSENGER RAIL
This chapter highlights past and present Amtrak operations, bus connections to Amtrak,
tourist/excursion rail lines, and passenger rail‐related studies.
3.1 AMTRAK
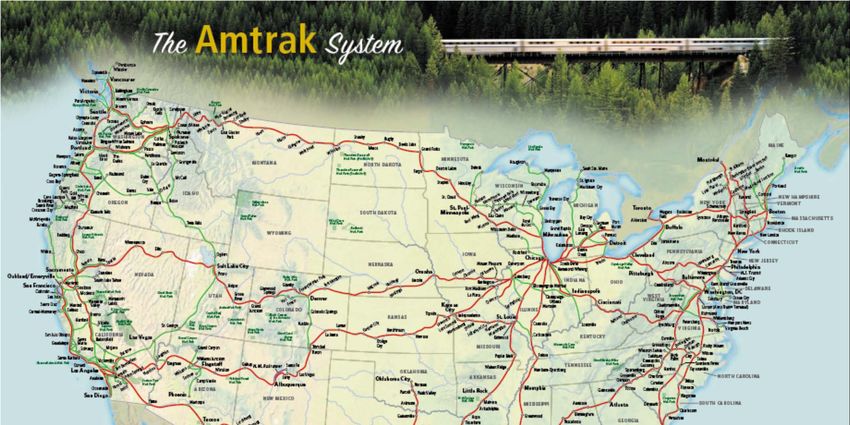
Amtrak provides passenger rail services connecting over 500 communities in 46 states, the
District of Columbia, and three Canadian provinces. Figure 3‐1 shows Amtrak’s national system.
In addition to its intercity service, Amtrak is the nation’s largest provider of contract‐commuter
rail service for state and regional authorities. Originally created in 1970 as a for‐profit
government corporation to relieve the freight railroads of the burden of unprofitable passenger
operations, Amtrak was granted a monopoly to provide intercity rail transportation. It officially
began service on May 1, 1971 with 185 trains serving 314 destinations. Amtrak received $1.2
billion in federal funds for operating and capital support for fiscal year (FY) 2013.17
In 1971, Amtrak’s nationwide monthly ridership was over 1.2 million passengers or over 14.8
million annually. In 2013, its monthly ridership had grown to more than 2.6 million passengers
or nearly 31.6 million annually. By comparison, in 2013, the Kentucky total of just over 11,000
passengers annually represented 0.04 percent of the total annual nationwide ridership.18
As discussed earlier, railroad infrastructure capacity is managed carefully to eliminate conflicts
in the movement of passenger and freight operations through track control arrangements.
These arrangements provide guidance on railroad operations for each section of track, and the
window of time those operations are expected to take place. Seventy‐two percent of Amtrak
train operation occurs on freight railroad infrastructure. According to 49 U.S.C. 24308 (c), 1973,
passenger trains operated by Amtrak receive priority over freight trains. However, the
operational track control decisions are made by non‐Amtrak dispatchers and other non‐Amtrak
employees. Amtrak’s ability to meet performance expectations and maintain on‐time
schedules depends on the prioritization of Amtrak trains on freight railroads. Note that in late
2014, the freight railroads challenged Amtrak’s priority and the case was heard before the U.S.
Supreme Court. The outcome is not yet known at the time of publication of this plan.
Figure 3‐2 depicts the two passenger rail routes and four passenger rail stations located in
Kentucky. Amtrak ridership for FY 2005 through FY 2013 at stations in Kentucky and the nearby
cities of Cincinnati, Ohio and Indianapolis, Indiana is summarized in Table 3‐1. As seen from the
Kentucky station statistics, ridership has increased overall in Kentucky from FY 2005 to FY 2013
by 54 percent.
17
Amtrak, http://www.amtrak.com/, 2014
18
Ibid.
Page 3‐1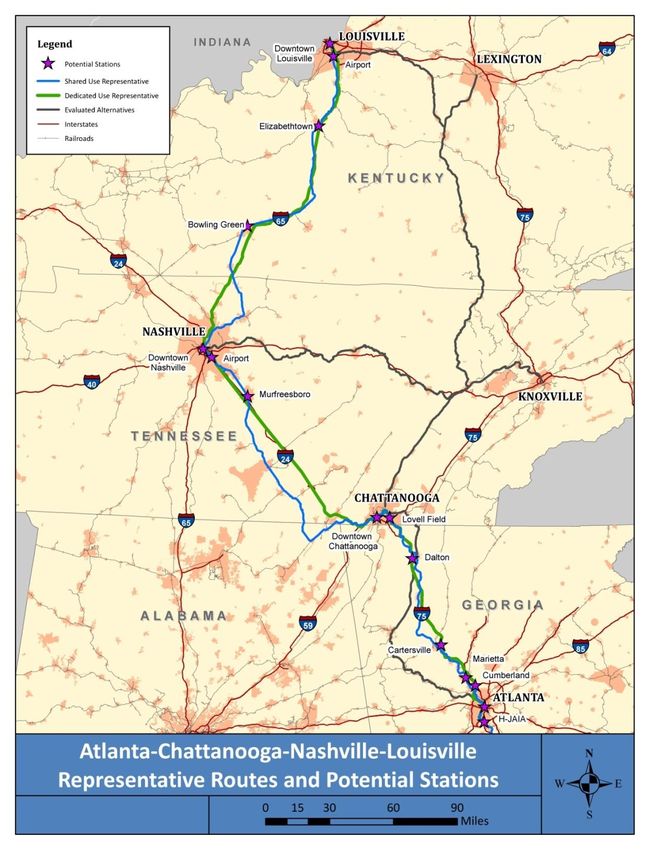
Kentucky Statewide Rail Plan                                                                                                               2015

                                                                                                      Figure 3‐1: Amtrak National System

                          Source: http://www.amtrak.com/ccurl/948/674/System0211_101web,0.pdf, 2014

                                                                                                                                                  Page 3‐2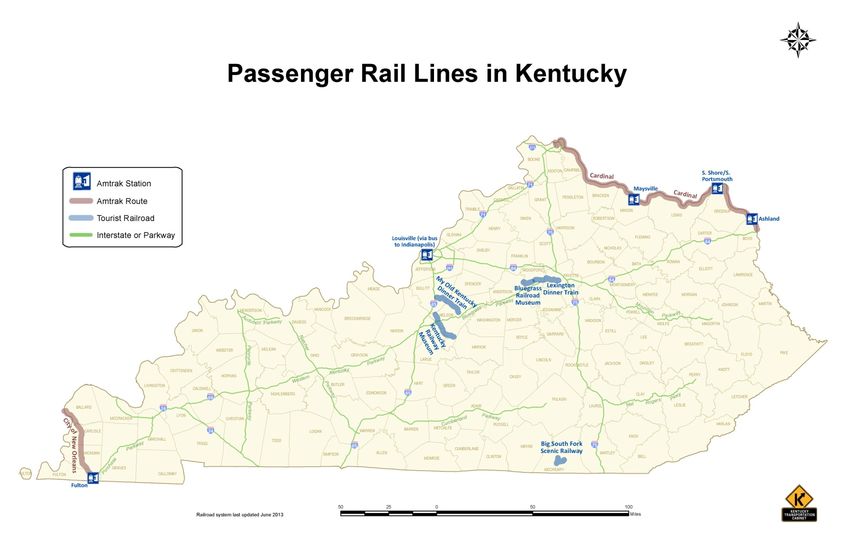
Kentucky Statewide Rail Plan                                                                2015

                                             Figure 3‐2: Passenger Rail Lines in Kentucky

                        Source: KYTC, 2014

                                                                                                   Page 3‐3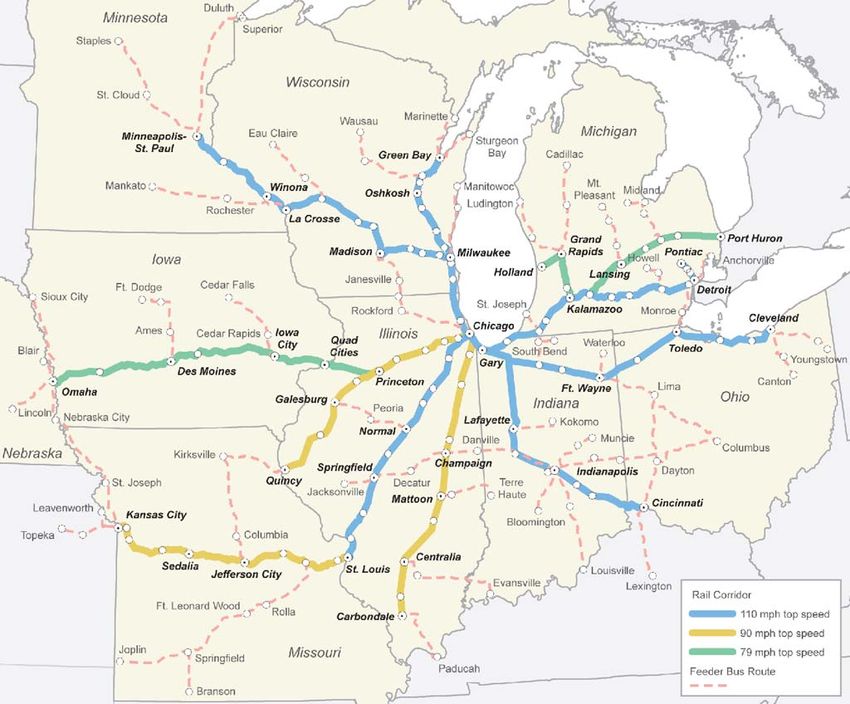
Kentucky Statewide Rail Plan                                                                                     2015

                        Table 3‐1: Amtrak Annual Total Ridership for Selected Years and Cities
                 City            2005      2006      2007       2008      2009      2010      2011      2012         2013
          Kentucky Stations
                Ashland         2,374      2,880     2,829     2,909     2,925      2,771     2,820     2,999        3,007
                 Fulton         2,304      2,288     2,743     3,683     3,445      3,578     3,548     4,038        4,588
                Maysville       1,733      1,604     1,772     1,707     1,855      1,933     1,817     2,507        2,411
             S. Portsmouth       734        873       715       811       771       1,019      856      1,037        1,010
            Kentucky Total      7,145      7,645     8,059     9,110     8,996      9,301     9,041    10,581       11,016
          Regional Stations
             Cincinnati, OH     12,407    14,043    12,753     14,654    14,377    13,852*   15,056*   15,846*      15,213*
             Indianapolis, IN   23,404    22,798    28,363     33,035    31,651    31,343    33,344    33,714       35,300
             Regional Total     35,811    36,841    41,116     47,689    46,028    45,195    48,400    49,560       50,513
          * Denotes that ridership data is from U.S. House of Representatives KY District 4 Fact Sheet, 2010‐2013
          Source: www.amtrak.com – About Amtrak – Facts & Services – State Fact Sheets, 2005‐2013

        3.1.1 Amtrak Routes in Kentucky
        Amtrak trains stop at four stations in Kentucky. The Cardinal stops in the Kentucky cities of
        Maysville, South Portsmouth, and Ashland. The Cardinal runs three trains per week between
        Chicago, Illinois and Washington, D.C., offering both sleeper and diner cars. The City of New
        Orleans provides service between Chicago and New Orleans, Louisiana, with a stop in Kentucky
        in the city of Fulton. The City of New Orleans offers daily service with sleeper and diner cars.
        Between 1999 and 2003, Amtrak operated the former Kentucky Cardinal, which connected
        Louisville and Chicago, through Jeffersonville and Indianapolis, Indiana. The service was
        discontinued in 2003, due to delays crossing the Ohio River, low track speeds, and low
        ridership. Riders in Louisville may now take a connecting bus to Indianapolis to meet the
        Cardinal.

        3.1.2 Bus Services Connecting Passengers to Amtrak Routes
        Thruway Motorcoach Service, operated by Greyhound, provides bus connections from Amtrak
        stations to other communities not currently served by Amtrak. Guaranteed connections to an
        Amtrak train station, through‐fares, and common ticketing are provided in most cases. A
        Thruway bus connection is provided at Louisville, connecting Louisville and Indianapolis,
        Indiana, and continuing on to Chicago, Illinois. The Thruway connection out of Cincinnati
        provides a link to Columbus, Ohio and Pittsburgh, Pennsylvania. Bus connections are also
        available to Amtrak passengers at Ashland and Fulton.

                                                                                                                    Page 3‐4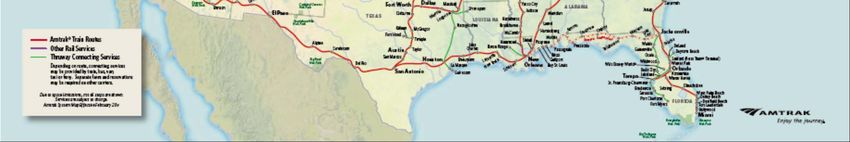
Kentucky Statewide Rail Plan                                                                                2015

        3.2 TOURIST/EXCURSION RAIL LINES
        Five tourist/excursion trains operate in Kentucky, as described below with locations noted in
        Figure 3‐2.

        3.2.1 Big South Fork Scenic Railway
        Located in Stearns, the Big South Fork Scenic Railway is an excursion railroad that takes
        passengers on a 14‐mile roundtrip tour to the National Park Service’s Blue Heron Coal Mining
        Camp representation within the Big South Fork National River Recreation Area. It operates on a
        line that is owned by the McCreary County Heritage Foundation in McCreary County and
        features tunnels, walking paths, an abandoned mine, a snack bar, and a gift shop. The train is in
        operation from April through December.19 The line operates over one mile of Kentucky and
        Tennessee Railroad’s yard track to connect its station to its rail line.

        3.2.2 Bluegrass Scenic Railroad and Museum
        Located near downtown Versailles, the Bluegrass Scenic Railroad and Museum offers an 11‐
        mile/90‐minute roundtrip tour within the Bluegrass Region of Kentucky, from Versailles toward
        the Kentucky River, along the only railroad line in Kentucky not used to transport freight. This
        tour uses the former mainline of the now defunct Louisville Southern Railroad. In addition to
        the tour, the museum exhibits include a display car.20

        3.2.3 Kentucky Railway Museum
        Located in New Haven, the Kentucky Railway Museum operates over 22 roundtrip miles of track
        that were formerly part of the Lebanon Branch of the Louisville & Nashville Railroad (a CSXT
        predecessor) through Nelson and LaRue counties. The main depot is located in New Haven
        with a passenger boarding area in Boston. In addition to a scenic tour, the museum offers a
        collection of artifacts such as locomotives and cars, train memorabilia, and a gift shop.21

        3.2.4 My Old Kentucky Dinner Train
        Located in Bardstown, My Old Kentucky Dinner Train began operation in 1988. Originally
        constructed by the Bardstown and Louisville Railroad in 1860, the branch was purchased from
        CSXT in 1987 by the R.J. Corman Railroad Group. The train travels through Bernheim Forest,
        and the Jim Beam distillery property, to Limestone Springs and back to Bardstown. The trip is a
        37‐mile roundtrip excursion taking approximately two and a half hours. My Old Kentucky
        Dinner Train offers special children's excursions for ages three through 12 and breakfast
        excursions that are each approximately one and a half hours. My Old Kentucky Dinner Train
        primarily runs on the R.J. Corman Railroad Group’s Bardstown Line in Nelson County.22

        19
           Big South Fork Scenic Railway, http://bsfsry.com/, 2014
        20
           Bluegrass Scenic Railroad and Museum, http://www.bgrm.org/, 2014
        21
           Kentucky Railway Museum, http://www.kyrail.org/, 2014
        22
           My Old Kentucky Dinner Train and R.J. Corman’s Lexington Dinner Train, http://www.kydinnertrain.com/, 2014

                                                                                                             Page 3‐5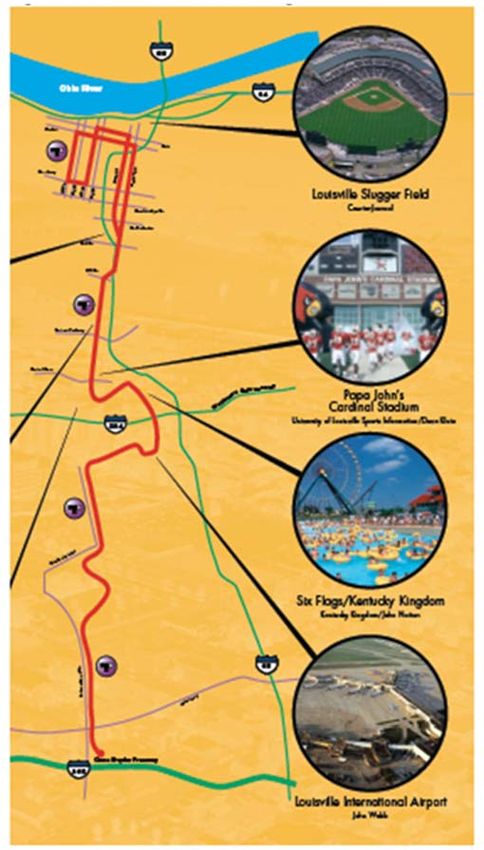
Kentucky Statewide Rail Plan                                                                                  2015

        3.2.5 R.J. Corman Lexington Dinner Train
        The R.J. Corman Railroad Group’s Lexington Dinner Train, which began in 2013, travels
        approximately 30 miles roundtrip from R.J. Corman’s Lexington Station past the Keeneland
        Race Course, the Village of Pisgah, to the city of Versailles. The train ride is approximately two
        hours for lunch trips and two and a half hours for dinner excursions. Children's excursions for
        ages three through 12 and breakfast excursions are each approximately one and a half hours.
        The R.J. Corman Lexington Dinner Train runs on the R.J. Corman Railroad Group’s Central
        Kentucky Line in Fayette and Woodford counties.23

        3.3 STUDIES REGARDING PASSENGER RAIL IN KENTUCKY
        Several studies exploring the potential expansion and feasibility of passenger rail in Kentucky
        have been completed by various entities. The most relevant studies are described below.

        3.3.1 Ohio‐Kentucky‐Indiana Light Rail Project (1998‐2001) 24
        In March 1998, the Ohio‐Kentucky‐Indiana Regional Council of Governments (OKI), the MPO of
        the Cincinnati ‐ Northern Kentucky urbanized area, completed the I‐71 Major Investment Study
        (MIS). The MIS included the selection of a locally preferred alternative that recommended the
        design and construction of a 43‐mile light rail transit (LRT) line. LRT is an electrified train
        system that can run at street level in mixed traffic or on its own exclusive track and is powered
        by overhead electric lines.

        The 43‐mile LRT line included a 19‐mile minimum operating segment (MOS‐1) from 12th Street
        in Covington, Kentucky north to downtown Cincinnati, and terminated in Blue Ash, Ohio. The
        MOS‐1 included 24 proposed stations. In accordance with federal regulations regarding the
        metropolitan planning process, the project was included in the OKI Long Range
        Transportation Plan (LRTP) and Transportation Improvement Program (TIP). Using $5.8
        million in Federal Transit Administration (FTA) Section 5307 flexible funds, the Southwest
        Ohio Regional Transit Authority (SORTA) purchased several portions of active and abandoned
        railroad right of way for the proposed LRT project.

        In December 1998, FTA approved the initiation of preliminary engineering and the
        preparation of a Draft Environmental Impact Statement (DEIS) for MOS‐1. The DEIS was
        completed in 2001.25 Section 3030(b) (66) of the federal transportation bill, Transportation
        Equity Act for the 21st Century (TEA‐21), authorized the Cincinnati/Northern Kentucky
        Northeast Corridor for final design and construction. Through FY 2001, the U.S. Congress had
        appropriated $9.75 million in FTA Section 5309 New Starts funds for the proposed project.

        23
           Ibíd.
        24
           http://www.fta.dot.gov/printer_friendly/12304_2923.html, 2014
        25
           Ohio‐Kentucky‐Indiana Regional Council of Governments, http://www.oki.org/allstudies/i‐71‐corridor‐deis/,
        2014

                                                                                                               Page 3‐6
Kentucky Statewide Rail Plan 2015
However, the FTA gave the project an overall rating of Not Recommended based on the
project’s poor cost‐effectiveness, absence of transit‐supportive land use policies in the
corridor, and the lack of local financial commitment to build and operate the proposed LRT
system. With no other source for ongoing funding, the project was abandoned.26
3.3.2 Louisville Transportation Tomorrow Light Rail Project (1998‐2006)27
The Transit Authority of River City (TARC), Louisville, Kentucky’s urban transit service provider,
examined the feasibility of LRT in the Louisville and southern Indiana region through the
development of the Transportation Tomorrow (T2)
MIS.
Figure 3‐3: TARC T2 Proposed Light
Three subsequent phases of T2 examined the Rail Route
system’s benefits or sought to develop design
documents and provide environmental reports.
Phase I took place from 1994 to 1996 with the MIS
concluding that a LRT system in Louisville was
generally feasible. Phase II from 1997 to 1998
examined the benefits that a LRT system would bring
to Louisville. These benefits included improved
mobility, development and redevelopment of certain
neighborhoods, reduced air pollution, and the easing
of congestion on I‐65. Alternatives to a LRT system
included doing nothing, enhancing bus service,
improving roadways, and adding bus‐ways and high
occupancy vehicle lanes.
Phase III took place from 1998 to 2000. It reaffirmed
LRT as the preferred mode and chose a general route
for the system. The study concluded with a proposed
route as shown in Figure 3‐3, preliminary cost
estimates for capital and operating expenses,
planning level design, and estimated ridership. T2
was entered into the FTA’s New Starts Program. In
accordance with federal regulations regarding the
Source:
metropolitan planning process, the project was https://www.ridetarc.org/uploadedFiles/Ab
included in the Kentuckiana Regional Planning and out_TARC/Long_Range_Plan/Long%20Rang
e%20Plan.pdf, 2014
26
Federal Transit Administration, http://www.fta.dot.gov/12304_3149.html, 2014
27
http://insiderlouisville.com/news/making‐case‐louisville‐streetcar‐learned‐public‐transit‐trip‐portland‐ore/,
2014
Page 3‐7Kentucky Statewide Rail Plan 2015
Development Agency’s (KIPDA’s) Long Range Transportation Plan (LRTP) and Transportation
Improvement Program (TIP). The project then progressed into the preliminary engineering
phase after both the FTA issued a Recommended rating for New Starts and the DEIS was
completed, but not released for public review. From 2004 to 2006, the FTA indicated that the
project’s movement into the final design phase was not possible without a secured local
funding match. According to TARC, the project was withdrawn from the New Starts Program
due to the inability to secure local funding.28
3.3.3 Examination of I‐75, I‐64, and I‐71 High Speed Rail Corridors (1999)29
A review of high‐speed rail services, proposals, and a preliminary assessment of the potential
for high‐speed rail transportation between three Kentucky cities: Lexington, Louisville, and
Covington, was performed for the KYTC in 1999. Connections to Frankfort, Kentucky and
Cincinnati, Ohio, were also evaluated in the study.
Annual ridership was estimated to be 94,000 passengers, which included rail passengers
connecting to airline service at the Cincinnati/Northern Kentucky International Airport in
Covington and a Cincinnati connection with the Midwest Regional Rail Initiative (MWRRI).
Capital costs were estimated to be $5.48 billion, with annual operations and maintenance costs
of approximately $40 million. Annual revenues were expected to range from $5.5 to $7.7
million based on a fare of $34.50 to and from the cities of Cincinnati, Lexington, and Louisville.
The fare for the Frankfort to Lexington trip was priced at $6.50.
It was concluded that the proposed service faced a number of challenges, of which the most
significant was that fares would only return 15 percent of the operating costs – meaning that in
order to cover these costs, the fares would have to be raised to $190 per leg or $245 for a
roundtrip. In addition, it was determined that adjacent and parallel highways would offer
faster travel times and speeds, making it difficult to attract sufficient ridership to support
operating costs.
3.3.4 Midwest Regional Rail Initiative Executive Report (2004)30
The Midwest Regional Rail Initiative (MWRRI) was formed in 1996 by several states
including Illinois, Indiana, Kansas, Michigan, Minnesota, Missouri, Nebraska,
North Dakota, and Wisconsin, in an effort to improve and expand passenger rail service
in the Midwest. Its objectives are to increase operating speeds, train frequencies, system
connectivity over the existing network, and service reliability. The consortium has also
developed the proposed Midwest Regional Rail System (MWRRS) to improve the level and
28
Transit Authority of River City, http://www.ridetarc.org/faq/#Light_Rail, 2014
29
http://transportation.ky.gov/Railroads/Documents/Examination%20of%20I‐75,%20I‐64%20and%20I‐
71%20High%20Speed%20Rail.PDF, 2014
30
http://www.michigan.gov/documents/mdot/MDOT‐MWRRSServiceDevelopmentPlan_Exec_330322_7.pdf, 2014
Page 3‐8Kentucky Statewide Rail Plan 2015
quality of existing regional passenger rail service, and thereby improving mobility as well as
stimulating economic development.
Various studies have been produced by MWRRI in 1998, 2000, 2004, and most recently in
2007.31 Participants included the states of Indiana, Illinois, Michigan, Minnesota, Missouri,
Nebraska, North Dakota, and Wisconsin. Amtrak and the FRA also participated. Kentucky is
not currently participating in the MWRRI because no funding is presently available to
support MWRRS development. The KYTC has reserved the right to reconsider its position if
funding were to become available. Connections to Kentucky are proposed by bus.
The proposed MWRRS network is comprised of nine corridors consisting of 3,000 route
miles, as shown in Figure 3‐4. The majority of the system is owned by freight railroads with
the remainder owned by Amtrak and Metra (Chicago, Illinois’ commuter rail operator).
The proposed passenger rail system would have a station located in Cincinnati, Ohio, with
feeder bus service connecting to the Kentucky cities of Lexington, Paducah, and in Illinois, the
city of Carbondale.
The initial implementation of the proposed MWRRS service was part of a 10‐year phased
program, as called for in the 2004 MWRRI Executive Report.32
31
http://miprc.org/Portals/0/pdfs/railmidwest1.pdf, 2014
32
http://miprc.org/Portals/0/pdfs/Feb2000mwrrireport.pdf, 2014
Page 3‐9Kentucky Statewide Rail Plan 2015
Figure 3‐4: Proposed MWRRS System Map
Source: http://www.dot.state.mn.us/passengerrail/pdfs/mwrrioverallmap.pdf, 2014
According to the MWRRI Executive Report, the capital costs of MWRRS include two
components: rolling stock and infrastructure. Total capital investments are projected to be
$7.7 billion, with rolling stock costs expected to be approximately $1.1 billion and infrastructure
costs estimated at $6.6 billion. Infrastructure costs include the implementation of a positive
train control (PTC) signaling system, improvement of highway‐rail at‐grade crossings, and
construction or renovation of passenger stations.
3.3.5 Atlanta to Chattanooga to Nashville to Louisville High Speed Rail Study (2012)33
This study was undertaken by the Georgia Department of Transportation (GDOT) to evaluate
the need for, and effectiveness of, several potential rail corridors connecting Atlanta, Georgia
with other cities in the region. Three corridors were examined:
33
http://www.dot.ga.gov/travelingingeorgia/rail/Documents/HighSpeedRail/Final%20Report.pdf, 2014
Page 3‐10Kentucky Statewide Rail Plan 2015
Atlanta‐Birmingham;
Atlanta‐Macon‐Jacksonville; and,
Atlanta‐Chattanooga‐Nashville‐Louisville (Atlanta‐Louisville corridor).
The feasibility of both Emerging High‐Speed Rail (90‐110 mph) service and Express High‐Speed
Rail (180‐220 mph) service, as designated by the FRA, was examined in each corridor. The
former can be operated on track shared with freight railroads, while the latter requires
dedicated track and right of way.
In addition, a maglev alternative (more than 220 mph) was evaluated in the Atlanta‐Louisville
corridor. Maglev, a term derived from magnetic levitation, is a method of propulsion that uses
magnetic levitation to propel trains with magnets rather than with wheels, axles, and bearings.
With maglev, a train or car is levitated a short distance above a guideway, using magnets to
create both lift and thrust. High‐speed maglev trains promise dramatic improvements for
travel.34
A representative route was identified for each corridor and service type. These were not
intended to be the preferred or recommended alternatives, but served as representative
examples to evaluate high‐speed rail performance in the corridors. Each route could have
several alignments which would be analyzed in more detail as part of the federally required
environmental review, if the route is selected for future analysis.
With respect to Kentucky, the Atlanta‐Louisville corridor would extend from Hartsfield‐Jackson
Atlanta International Airport to downtown Louisville, as shown in Figure 3‐5.
34
http://namti.org/magnetic‐levitation‐transport‐explained/, 2014
Page 3‐11Kentucky Statewide Rail Plan 2015
Figure 3‐5: Proposed High Speed Rail Route from Atlanta to Louisville
Source: Atlanta to Chattanooga to Nashville to Louisville High Speed Rail Study, Georgia Department of
Transportation (GDOT), 2012
The Emerging High‐Speed Rail service, a shared use route, is proposed to follow a CSXT line.
The Express High‐Speed Rail Route, a dedicated use route would follow I‐75 from Atlanta,
Georgia to Chattanooga, Tennessee; I‐24 from Chattanooga to Nashville, Tennessee; and I‐65
Page 3‐12Kentucky Statewide Rail Plan 2015
from Nashville to Louisville, Kentucky. With the exception of Marietta, Georgia, which would
only have a station under the Emerging High Speed Rail scenario, both scenarios would have
stations at these locations:
Hartsfield‐Jackson Atlanta Downtown Chattanooga, Tennessee;
International Airport, Atlanta, Murfreesboro, Tennessee;
Georgia; Nashville International Airport,
Atlanta Multi‐Modal Passenger Tennessee;
Terminal, Atlanta, Georgia; Downtown Nashville, Tennessee;
Cumberland/Galleria, Georgia; Bowling Green, Kentucky;
Marietta, Georgia; Elizabethtown, Kentucky;
Cartersville, Georgia; Louisville International Airport,
Dalton, Georgia; Kentucky; and,
Lovell Airport Field, Tennessee; Downtown Louisville, Kentucky.
The analysis showed that the trip time between Atlanta and Louisville in the shared use
scenario would be approximately 6 hours and 55 minutes with an average speed of 72 mph.
Comparatively, the trip would take approximately the same time as driving along the nearest
interstate highway.35 Conventional high speed trains operating on a passenger‐only track
would average 122 mph for an approximate trip time of 3 hours and 32 minutes between the
two cities, substantially faster than driving. Finally, the maglev service would operate at an
average speed of 143 mph, completing the trip in approximately 3 hours and 2 minutes.
Estimated capital costs, operations and maintenance costs, as well as ridership and revenue,
are depicted in Table 3‐2 for the years 2021 to 2040.
Table 3‐2: Estimated Costs & Operational Statistics for Atlanta to Louisville High Speed Rail
Scenarios, 2021‐2040
Emerging High Speed Express High Speed Maglev
Ridership 101.9 million 110.6 million 116.1 million
Capital Costs $11.5 billion $32.6 billion $43 billion
O&M Costs $2.8 billion $5.8 billion $4.5 billion
Revenue $4.2 billion $6.4 billion $6.8 billion
Avg. Fare $41.22 $57.87 $58.57
Source: Atlanta to Chattanooga to Nashville to Louisville High Speed Rail Study, Georgia Department of
Transportation (GDOT), 2012
35
http://www.dot.ga.gov/travelingingeorgia/rail/Documents/HighSpeedRail/Final%20Report.pdf, 2014
Page 3‐13Kentucky Statewide Rail Plan 2015
The Emerging High‐Speed Rail, Express High‐Speed Rail, and maglev alternatives performed well
under the operating ratio analysis, resulting in anticipated ridership versus estimated revenue
ratios well above the necessary benefit‐cost ratio for all three scenarios. When revenues
exceed operating costs, operating subsidies are not required. The excess funds could be
reinvested in the rail service or used to pay existing debt. The operating revenue surplus could
encourage investment form the private sector, reducing public financing required.
Taking into account the operating ratios and benefit‐cost ratios, the study recommended that
the results be used to set priorities for future state planning and corridor development
activities. In particular, this study found that high‐speed passenger rail service is feasible in the
Atlanta‐Chattanooga‐Nashville‐Louisville Corridor.36
The study concluded that high‐speed rail service in the Atlanta‐Chattanooga‐Nashville‐Louisville
Corridor presents an opportunity to provide needed transportation solutions and promote
economic development. While high‐speed rail is not the only transportation solution, this study
showed that high‐speed passenger rail would give consumers improved mobility and
transportation mode choices, with connectivity to major cities such as Atlanta, Chattanooga,
Nashville, and Louisville through commercial centers and national destinations.
36
Ibid.
Page 3‐14You can also read