CHAPTER 6.2: AGRICULTURE AND THE FOOD SUPPLY CHAIN - GTAC
←
→
Page content transcription
If your browser does not render page correctly, please read the page content below
CHAPTER 6.2:
                 AGRICULTURE AND THE FOOD SUPPLY CHAIN

ABSTRACT
Food production and the distribution and retailing of food were deemed essential services when the
national state of disaster was announced. At face value, this suggested that the direct impact of the
various Covid-19 regulations on the agricultural sector and the availability of food would be limited.
Nevertheless, specific subsectors in the primary agricultural sector (e.g., wine, mohair, wool, flowers,
leather, and tobacco) and the food service sector were severely affected by the regulations. Early on
during the lockdown, the informal food supply chain and the livelihood of small-scale fishers were also
disrupted – the initial ban on informal traders and food vendors and the restrictions on small-scale
fishers during alert levels 5 and 4 affected the supply of food for many vulnerable people and
exacerbated food insecurity. Another factor that affected specific subsectors of the food supply chain
was the critical lack of coordination and communication between the relevant national departments.
Despite these specific circumstances and diverse impacts on the agricultural and food supply chains,
the Department of Agriculture, Land Reform and Rural Development announced a blanket relief
programme for all micro-scale farmers and for farmers in the Proactive Land Acquisition Strategy
programme. Almost R500 million was allocated to 14 300 farmers without a proper assessment of the
impact of the regulations on the sector. Finally, note that any conclusions in this chapter on the
strengths and limitations of the Covid-19 response are still preliminary and will be refined based on
stakeholder consultations and feedback from readers.

DISCLAIMER
 This Country Report on the measures implemented by the South African government to combat the impact
 of the Covid-19 pandemic in South Africa (including individual research reports that may be enclosed as
 annexures) were prepared by various professional experts in their personal capacity. The opinions expressed
 in these reports are those of the respective authors and do not necessarily reflect the view of their affiliated
 institutions or the official policy or position of the South African government.

Chapter 6.2. Agriculture                      DRAFT 25/05/2021                                                      i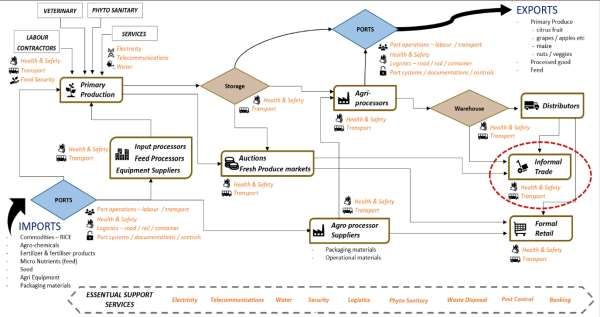
ACKNOWLEDGEMENTS
This research paper was prepared by:

 Name                        Designation and affiliation
 Prof. Lucia Anelich         Anelich Consulting, Adjunct Professor, Central University of Technology,
 (convenor)                  Bloemfontein
 Prof. Johann Kirsten        Director, Bureau for Economic Research, University of Stellenbosch

 Prof. Ferdi Meyer           Director, Bureau for Food and Agricultural Policy

 Dr Tracy Davids             Bureau for Food and Agricultural Policy

 Ms Marion Delport           Bureau for Food and Agricultural Policy

 Dr Tinashe Kapuya           Bureau for Food and Agricultural Policy

 Dr Hester Vermeulen         Bureau for Food and Agricultural Policy

 Mr Wandile Sihlobo          Agricultural Business Chamber

 Prof. Nicola Theron         Senior Managing Director, FTI Consulting

 Prof. Ursula Scharler       School of Life Sciences, University of KwaZulu-Natal

How to cite this report:
Kirsten, J., Anelich, L., Meyer, F., Davids, T. Delport, M., Kapuya, T., Vermeulen, H., Sihlobo, W.,
Theron, N. & Scharler, U., 2021. Agriculture and the food supply chain. South Africa Covid-19
Country Report [Interim draft]. DPME (Department of Planning, Monitoring and Evaluation), GTAC
(Government Technical Advisory Centre) & NRF (National Research Foundation), Pretoria: May.

Chapter 6.2. Agriculture                   DRAFT 25/05/2021                                             ii
ABBREVIATIONS AND ACRONYMS
BFAP           Bureau for Food and Agricultural Policy
DALRRD         Department of Agriculture, Land Reform and Rural Development
DEFF           Department of Environment, Forestry and Fisheries
GDP            gross domestic product
NIDS-CRAM      National Income Dynamics Study – Coronavirus Rapid Mobile Survey
TERS           Temporary Employee/Employer Scheme

Chapter 6.2. Agriculture                   DRAFT 25/05/2021                       iii
CONTENTS
Introduction ...................................................................................................................................... 1

Food supply chains ............................................................................................................................ 6
Direct and indirect impact on the agro-food industry ........................................................................ 6
     Alert level 5: 26 March to 30 April 2020 (R398, 25 March and R419, 26 March 2020) .................. 6
     Alert level 4: 1 May to 31 May 2020 (R480, 29 April 2020) ........................................................... 6
     Alert level 3: 1 June to 17 August 2020 (R608, 28 May 2020) ....................................................... 7
Overall impact on agro-food supply chains ........................................................................................ 7

Disruption of ports ............................................................................................................................ 8

Production and trade......................................................................................................................... 8

Impact on food prices and affordability ........................................................................................... 10

Agricultural employment and incomes ............................................................................................ 11

Overall impact of Covid-19 on agriculture ........................................................................................ 12

Impact on the wine industry ............................................................................................................ 15

Impact on vulnerable sectors ........................................................................................................... 19
Informal traders .............................................................................................................................. 19
Subsistence and small-scale fishers.................................................................................................. 20

Covid-19 containment measures ..................................................................................................... 21

Conclusions, challenges and lessons learnt ...................................................................................... 23

Recommendations for improvement ............................................................................................... 25

References ...................................................................................................................................... 27

Annex 6.2.1: Research design and methods ..................................................................................... 31

Annex 6.2.2: Durban subsistence fishing community ....................................................................... 32

Chapter 6.2. Agriculture                                    DRAFT 25/05/2021                                                                      iv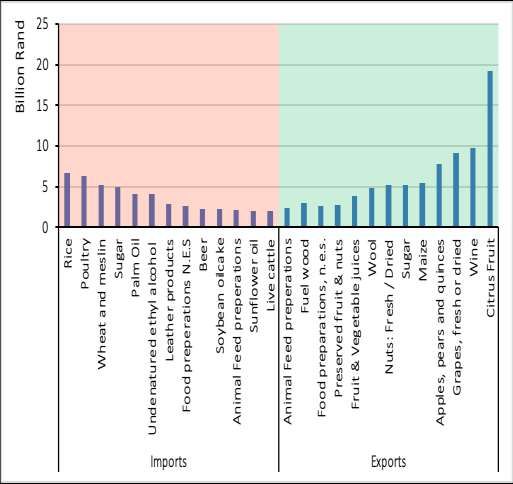
LIST OF FIGURES
Figure 6.2.1: Agriculture and food supply chain ................................................................................. 1
Figure 6.2.2: South Africa’s food chain node ...................................................................................... 3
Figure 6.2.3: Major agriculture and food imports and exports, 2019 .................................................. 9
Figure 6.2.4: Food inflation by month, 2020 .................................................................................... 11
Figure 6.2.5: Trends in agricultural jobs, 2008 to 2020 ..................................................................... 12
Figure 6.2.6: Timeline of regulatory measures specific to the wine industry ..................................... 16
Figure 6.2.7: Annualised impact of alcohol ban on GDP at factor cost .............................................. 17
Figure 6.2.8: Annualised impact of alcohol ban on employment ...................................................... 17
Figure 6.2.9: Annualised impact on tax revenue (excluding excise tax) ............................................. 17
Figure 6.2.10: Annualised impact on excise tax revenue .................................................................. 18
Figure 6.2.11: Annualised impact on sales volumes ......................................................................... 18
Figure 6.2.12: Annualised impact on sales revenue .......................................................................... 18

LIST OF TABLES
Table 6.2.1: Qualitative assessment of the losses per industry ......................................................... 13
Table 6.2.2: Successful applicants and approved relief amounts per province .................................. 22
Table 6.2.3: List of organisations interviewed .................................................................................. 31

LIST OF BOXES
Box 6.2.1: Covid-19 initiatives of the food supply industry ............................................................... 23
Box 6.2.2: Design considerations for a relief programme ................................................................. 24

Chapter 6.2. Agriculture                              DRAFT 25/05/2021                                                             v
INTRODUCTION
When the South African government announced stringent lockdown measures on 26 March 2020,
food production and the distribution and retailing of food were proclaimed essential services. At face
value, this suggested that the direct impact of the Covid-19 regulations on the agricultural sector and
the availability of food would be limited.

However, crises of any nature send shockwaves through food systems (Cullen, 2020; Schmidhuberm
et al., 2020). Examples of such crises include climate-related disasters, outbreaks of war, human
displacement and more recently, the financial crisis in 2009 and the current Covid-19 pandemic. These
food shocks are manifested in different ways but, importantly, they affect the health and well-being
of a population. The agricultural and food supply chain is a complex web of many interactions,
including seed producers, farmers, agricultural support, food processing plants, ingredient and other
service suppliers, transportation and shipping for food exports and imports, retailers, consumers,
restaurants and more (CFS, 2015; FAO, 2019; Cullen, 2020). It is imperative during crises that countries
keep food supply chains going (Cullen, 2020). To ensure the functioning of the food supply chain in
South Africa during the Covid-19 pandemic, other essential support services needed to be available.
In Figure 6.2.1, the Bureau for Food and Agricultural Policy (BFAP) shows the complex nature of the
food system. It demonstrates how the regulations in many ways ignored the various support services
playing an important role in the food supply chain and, hence, in the food security of the nation.

Figure 6.2.1: Agriculture and food supply chain

Source: BFAP, 2020c

The initial lockdown regulations under the Disaster Management Act omitted a broad spectrum of the
informal food retail sector (e.g., spaza shops, ‘bakkie’ traders, hawkers, informal traders, and micro-
caterers) from the exemption list. This group of informal sector players is an essential part of the food
system and contributes significantly to the economy, while providing accessible and affordable food

Chapter 6.2. Agriculture                     DRAFT 25/05/2021                                          1
to poor and vulnerable groups. Likewise, thousands of ‘subsistence’ fishers were unable to fish and
faced both a loss of income and food insecurity during alert levels 5 and 4. As discussed below, this
group has been formally assimilated into the Department of Environment, Forestry and Fisheries’
(DEFF) framework as small-scale fishers. However, in the assimilation process, some could not obtain
permits as small-scale fishers, either because of administrative hurdles or because they did not meet
the department’s requirements. They were forced to fish on recreational fishing permits. But whereas
commercial and small-scale fishing was declared an essential service, recreational fishing was not
allowed until alert level 3. This created significant difficulties for subsistence fishers, some of whom
had to fish illegally to survive (which brought them into conflict with law enforcement). Annex 6.2.2
provides a case study of fishers in KwaZulu-Natal – the South Durban Community Environmental
Alliance requested that 12 000 members of the KwaZulu-Natal Subsistence Fisher Forum, who were
not recognised as small-scale fishers, be allowed to fish to alleviate their food insecurity.
Lockdown regulations also led to significant uncertainty around the definition of essential services. A
sizeable backlog developed at the office of the Registrar of Fertilisers, Farm Feeds and Agricultural
Remedies of the Department of Agriculture, Land Reform and Rural Development (DALRRD) because
of understaffing, as many employees who worked from home lacked the appropriate infrastructure.
This backlog disrupted supplies of farm inputs. In other cases, critical support services for the food
supply chain could not operate, leading to logistical problems in the food supply chain. BFAP’s End-to-
End Agro-Food Chain Tracker highlights several of these issues (BFAP, 2020c).
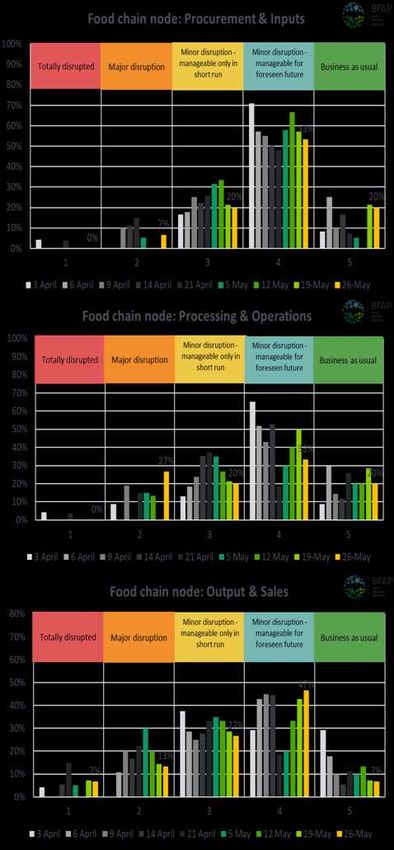
Figure 6.2.2 illustrates the survey results for disruptions experienced at various nodes in the food chain
during the lockdown (BFAP, 2020b). The main disruptions reported include the following:
• Sales were under pressure because of the closure of quick-service and other restaurants, as well
as lower overall demand resulting from lower economic activity (Chapter 6.3). Sales did improve
after quick-service restaurants were opened under alert level 3. However, interviews with the
Restaurant Association of South Africa and the Restaurant Collective (which covers sit-down
restaurants) suggested that they had not been consulted by government and felt ‘abandoned’
(Anelich, 2020b). Both organisations held that government failed to understand the importance
of the sector to the economy. A lack of coordination and communication between departments
was also indicated. Unlike South Africa, many countries permitted takeaway foods to be sold from
the beginning of their lockdown periods. Allowing businesses to provide takeaway food, especially
during the initial lockdown, would have significantly improved outcomes in the industry.
• Production operations were often disrupted because staff tested positive for Covid-19. For
example, Tiger Brands, Fry Group Foods (both plants in KwaZulu-Natal) and Coca-Cola (plant in
Gauteng) had to shut down because of Covid-19 outbreaks (Pillay & Comins, 2020).
• Congestion at Cape Town Harbour affected food exports, especially of citrus and pome fruit. Some
shipping companies had imposed congestion fees, and some ships opted not to dock in Cape Town
because of the delays. To avoid the congestion, fruit exporters trucked products to Port Elizabeth
at extra cost. For food imported into South Africa, reports suggested that consignments that
Chapter 6.2. Agriculture DRAFT 25/05/2021 2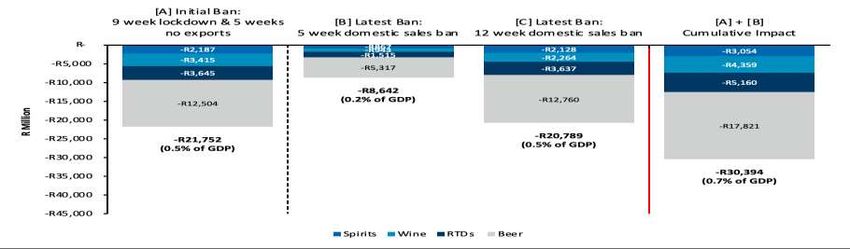
would normally be released within 72 hours now experienced delays of 3–4 weeks. This resulted
    in significant additional costs to the importers because of port overstays and demurrage.

Figure 6.2.2: South Africa’s food chain node

Source: BFAP, 2020c

Chapter 6.2. Agriculture                 DRAFT 25/05/2021                                       3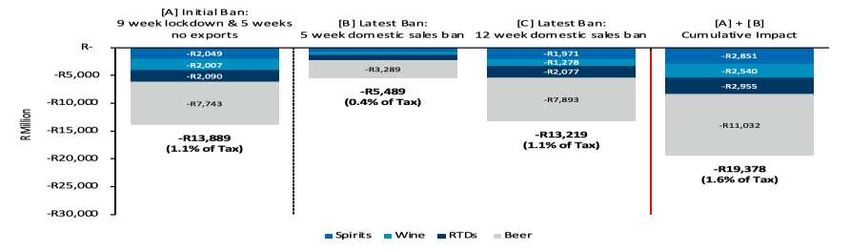
•   Significant congestion was also reported at the Beitbridge border post between South Africa and
    Zimbabwe (Chapter 6.4). Early on in alert level 5, Zimbabwe’s maize supplies were running low,
    and maize imports spiked right when the lockdown measures were announced. Participants in the
    BFAP End-to-End Agro-Food Chain Tracker reported delays of 14–28 days at various regional
    border posts in April 2020.
•   Imports of critical mechanical spares and agricultural inputs (including ingredients) were also
    problematic, as these consignments were delayed at the ports.

The lockdown regulations prohibited the domestic sale and export of alcohol, which severely affected
the wine industry. Government did not consult with this sector and made no attempt to understand
the effect of its decisions on the supply chain. For example, grapes and barley for wine and beer-
making, respectively, had to be harvested and processed into the respective products, which could
then be stored for long periods. Dispensations had to be sought for every step of the process; this
arduous procedure could have been avoided had there been adequate consultation upfront. The ban
on exports resulted in South Africa losing important trading partners, some of which sought wine from
other wine-producing countries to fill the gap. Securing an export market takes many months of
negotiations, and once lost, they are very difficult to regain.

Within the first lockdown period, non-food agricultural activities such as wool, mohair, floriculture,
ostrich feathers and animal skins were all deemed non-essential and were prohibited from operating.

As noted, the regulations also closed the food-away-from-home market, an important element in the
food supply chain. This included quick-service restaurants, restaurants, hotels, guesthouses, coffee
shops and catering businesses, along with entrepreneurs selling hot meals to passers-by and taxi
drivers. Together these establishments demand a considerable volume of food products from the
wholesale, fresh produce markets and food processing sections of the supply chain. Their closure
brought temporary drops in farm prices, specifically red meat, vegetables, and fruit (Stats SA, 2020a).

The quick-service restaurant sector employed an estimated 330 385 people before the pandemic,
virtually all of whom were negatively affected by the hard lockdown. Many of these employees were
contracted on a no-work-no-pay basis or relied on gratuities and tips from clients. Thus, most workers
in this industry did not earn an income during alert levels 5 and 4. When restaurants began to open
under strict health regulations and social distancing measures, many employers were unable to retain
jobs. Some downsized, but others had to close. Many casual workers lost their jobs, which in turn
affected their ability to buy food. Hopefully, they were assisted through social grants (Chapter 5.3),
food vouchers and food parcels to help them afford a basic basket of food (Louw et al., 2020).

Statistics South Africa (Stats SA, 2020b) conducted a survey of tax-registered private and public
enterprises that provide food and beverages for immediate consumption (i.e., restaurants and coffee
shops, takeaway and fast-food outlets and catering services). Published in December 2020, the
survey’s key findings are as follows:

Chapter 6.2. Agriculture                   DRAFT 25/05/2021                                          4
•   Measured in real terms (constant 2015 prices), total income generated by the food and beverages
    industry decreased by 42,5% in September 2020 year-on-year. The largest decreases were in bar
    sales (-65,6%) and food sales (-41,2%). The main contributors to this decrease were restaurants
    and coffee shops (-61,9% and contributing -32,3 percentage points) and catering services (-54,0%
    and -8,2 percentage points).
•   Total income decreased by 45,8% in the third quarter of 2020 as against the third quarter of 2019.
    The main contributors to this decrease were restaurants and coffee shops (-65,3% and -33,5
    percentage points); and catering services (-60,6% and -9,3 percentage points).

All industry associations interviewed were very supportive of the initial lockdown period (alert level
5), particularly the first three weeks (Anelich, 2020a). However, trust was eroded quickly because poor
coordination and communication between government departments resulted in draconian measures,
confusion in the application of regulations, and unnecessary economic effects on many parts of the
agriculture and food supply chain. Although elements of the regulations were deemed necessary to
contain the pandemic, some were considered unnecessary and even harmful to businesses and
livelihoods. Some agricultural enterprises correctly wondered why the sale of flowers, wool auctions,
wine exports, and the like were banned in April. It was, therefore, a great relief that alert level 4
regulations allowed all agricultural activities to operate, except the domestic sale of alcohol.

Given the harmful impact of the regulations on livelihoods and economic activity, it is appreciated that
government designed some relief programmes. However, the relief programme for the agricultural
sector announced by DALRRD in May 2020 (DALRRD, 2020a) in essence assisted only small-scale
farmers and farmers in the Proactive Land Acquisition Strategy programme, without paying specific
attention to the industry-wide impact of the regulations.

These impacts are explored in more detail in the rest of this chapter, which is structured as follows:
the first section discusses the direct and indirect impact of the regulations on food supply chains. This
is followed by an assessment of the impacts on ports, production and trade, and agricultural
employment. Next, a discussion of Covid-19 containment measures looks at both government and
industry. Finally, conclusions and recommendations are provided. Annex 6.2.1 sets out the research
methodology, and Annex 6.2.2 provides a case study of a vulnerable group. Case studies of three broad
commodity value chains are provided in Meyer et al. (2021).

Note that any conclusions in this chapter on strengths and limitations in the Covid-19 response are
still preliminary and will be refined based on stakeholder consultations and feedback from readers.
Also, this report focuses on the first and second waves of the pandemic. Agriculture and the food
supply chain during the further progression of the pandemic will be discussed in the second edition of
the Country Report.

Chapter 6.2. Agriculture                  DRAFT 25/05/2021                                             5
FOOD SUPPLY CHAINS DIRECT AND INDIRECT IMPACT ON THE AGRO-FOOD INDUSTRY The economic impact during this crisis period can essentially be separated into three layers: 1. The pandemic per se: negligible impact, mainly restricted to short-term supply disruptions 2. The panic that translates into low business and consumer confidence: large impact 3. The lockdown regulations: yet larger and most serious impact. The panic altered consumer shopping habits, with people relying more on online channels and large retail stores. This, combined with restrictions on going to village markets, for example, reduced the revenues of many firms, small farmers, and informal traders. In the lockdown, the sales of certain products originating from many firms were also banned. The details of the regulations in each alert level for the various agricultural and food industries are discussed below. Alert level 5: 26 March to 30 April 2020 (R398, 25 March and R419, 26 March 2020) Alert level 5 had the strictest lockdown regulations. The list of essential services and products was fairly short and even excluded certain industries within the agricultural sector. Only food-related agriculture (including animal food), livestock, the transport of live animals, and auctions and related agricultural services were deemed essential and were permitted to operate. Harvest activities and processing of non-essential agricultural products were also allowed. Several agricultural industries were commercially constrained because their products could not be traded; these include: • Floriculture • Wool • Mohair • Wine and other alcoholic beverages • Tobacco • Ostrich feathers • Leather industry. The feedback effect from the closure of all enterprises providing meals away from home (restaurants, fast-food outlets, and supermarkets) contributed to a drop in demand and a related reduction in farm prices for red meat, vegetables, and fruit. Alert level 4: 1 May to 31 May 2020 (R480, 29 April 2020) Under alert level 4, all agricultural and fishing activities (e.g., preparation, cultivation, harvesting, storage, transport of live animals, and auctions) were declared essential services. Exports of all agricultural and agro-processed goods, including wines, were allowed. However, serious bottlenecks in the ports (because of backlogs and unclear regulations) caused significant delays in the exports of citrus and pome fruits. Some of these delays had substantial financial implications for producers. Chapter 6.2. Agriculture DRAFT 25/05/2021 6
All agricultural producers could now do business. The only exception was that the local sale of alcohol
was still prohibited; this negatively affected wine estates, cellars, and grape producers. Furthermore,
sales in the restaurant and quick-service restaurant industry remained very low, because only home
deliveries were allowed.

Alert level 3: 1 June to 17 August 2020 (R608, 28 May 2020)
Under alert level 3, the economy was largely open, except for bars, taverns, restaurants, personal
services, and large gatherings and events. The hotel and accommodation industry remained closed,
but quick-service restaurants could operate (Chapter 6.3). This continued to have a negative impact
on domestic sales of meat, processed foods, and wine. Domestic sales of wine (and sales by the
broader liquor industry) were permitted for home consumption only. Business hours were limited to
09:00 to 17:00 on Mondays to Thursdays. Local sales, however, continued to be hampered by the
ongoing closure of restaurant, accommodation, and entertainment businesses.

The on-farm impact for most food-producing farms was marginal, with a slight drop in farm prices and
volumes in the case of meats and some vegetables. However, farmers still had a substantive revenue
stream, and they could continue to pay accounts and worker salaries. In line with BFAP’s baseline 2020
projection of a 13% year-on-year rise in the real gross domestic product (GDP) of agriculture, Statistics
South Africa confirmed growth of 13,1% in 2020 (Stats SA, 2021). This suggests that agriculture at the
aggregate level was better off, driven by a bumper summer crop and record citrus exports at good
prices (due to both a weaker currency and strong world prices). In industries where trade was more
restricted, however, many individual producers came under severe pressure.

OVERALL IMPACT ON AGRO-FOOD SUPPLY CHAINS
Although the pandemic reduced incomes in most parts of the world, the agricultural sector is one of
the few that have not been as badly affected. South Africa’s agricultural and food exports increased
from US$10,6 billion in 2019 to more than US$10,8 billion in 2020 (ITC, 2021). This expansion was
driven by an increase in grains and horticultural output, favourable world prices (particularly for citrus
products, which are high in vitamin C and seen as beneficial to the immune system), and the
weakening domestic currency. It built on better coordination and collaboration between the public
and private sectors (e.g., agriculture, agribusiness, logistics, and government), which worked together
to ensure the functioning of the sector throughout the lockdown.

As noted, agriculture’s contribution to the real GDP grew by 13,1% in 2020; this made it the strongest-
performing sector by some distance, with government the only other positive contributor to the GDP
(at 0,7%). In the second quarter of 2020 (April–June), which was hardest hit by lockdown restrictions,
the agricultural industry was the only sector to exhibit positive real growth.

This is not to say that there were no challenges, but merely that the challenges were addressed and
managed effectively. There are two key reasons why agriculture remained robust despite the wider
effects of the pandemic:

Chapter 6.2. Agriculture                   DRAFT 25/05/2021                                             7
•   The sector was largely operational even during the strict level 5 lockdown, except for a few
    subsectors such as wine, tobacco, wool, and floriculture. These subsectors reopened under alert
    levels 4 and 3, except for the tobacco industry, whose sales remained prohibited until alert level
    2, while harvest and fieldwork were permitted (Chapter 6.5).
•   The lockdown started when South Africa had already reached the tail-end of the summer grain
    production season. The late start to the summer grain harvest season saw some of the summer
    crop harvesting activities occurring in May and June, during the less stringent level 3 lockdown.
    This meant that food production and harvesting activities were largely uninterrupted. South Africa
    delivered its second-largest maize harvest in 2019/20 season, along with the highest barley output
    on record. There was also a record citrus harvest, because of investment in orchard expansion in
    recent years and better weather conditions. Moreover, the output of wine grapes recovered
    because of improved rainfall after a few very dry seasons. This did, however, present a challenge
    to industry when sales were initially banned for 9 weeks (26 March to 1 June 2020) and for another
    5 weeks in a subsequent ban (12 July to 17 August 2020) for a total of 14 weeks in 2020. (Wine
    exports resumed on 1 May 2020, after which the ban only applied to the domestic market.) A third
    ban was introduced on 28 December 2020 and only lifted on 1 February 2021.

DISRUPTION OF PORTS
The BFAP End-to-End Agro-Food Chain Tracker (BFAP, 2020c) and the mini report by Anelich (2020a).
noted challenges at the ports, which led to delays in shipments of raw materials to processing plants
and of final products to local, regional, and international markets (see also Chapter 2). This was of
great concern, as the agricultural sector is export orientated. More so, the 2019/20 production season
proved to be bountiful, with higher exported volumes of field crops and horticultural produce than in
the previous year. Fortunately, as the lockdown progressed, ongoing cooperation between industry
players and government improved conditions at the ports. However, some analysts still hold
reservations about the impact of the regulations and persistent port challenges on trade. Another
concern was the logistical challenges at the receiving ports of target markets, which had imposed
lockdown restrictions of their own, and the general uncertainty about global trade. With longer
offloading times, industries also faced intermittent container shortages. Both Cape Town and Durban
harbours were affected by the delays, as noted. Furthermore, in the interviews, several organisations
that rely on harbours for business purposes reported long-standing problems around capacity and
failing infrastructure at ports. Covid-19 exacerbated these deficiencies, and significant funding is
required to upgrade facilities for future trade.

PRODUCTION AND TRADE
Although the overall impact of Covid-19 on the agricultural sector may not have been that significant,
the sector was challenged in many respects. The impact of the pandemic has been nuanced, as the
broader sector (which remained operational) showed normal to high levels of growth, while parts that
were shut down or banned were badly affected, with low levels of growth or even contraction.

Chapter 6.2. Agriculture                   DRAFT 25/05/2021                                         8
For example, the ban on alcohol sales resulted in 14 weeks of zero trade and zero revenue in 2020 (this equates to 17% of sales in a normal year), with a further 5 weeks of zero trade in 2021. The larger players managed to recover from the effects of the ban when trading began on 1 June 2020. Some smaller operations did not survive, while others significantly reduced operations because of cash flow constraints. Many report that they will take years to recover. About 80 wineries, with almost 350 producers and 18 000 workers, reportedly went out of business. These problems were exacerbated by the second ban on alcohol sales imposed on 13 July 2020, which was only lifted five weeks later in mid-August. The wine industry lost R200 million per week in export revenue during the four weeks of the export ban and R300 million in local sales per week. This created significant cash flow challenges, and at the time of writing, it remained unclear whether the resumption of exports and domestic sales would compensate for the negative impact on cash flow. Indirect costs, such as lost international reputations, lost listings and shelf space, and damage to relationships built over 30 years, are incalculable, particularly to an industry that exports half of its production. Wine stocks have reached an all-time high and will take many years to work out, especially as spending power will remain weak. Beyond the negative impacts on the wine industry, South African agriculture maintained an overall trade surplus, which grew by 32% year-on-year in the second quarter of 2020 to US$1,1 billion (Trade Map, 2020). Agricultural exports remained high, with minimal year-on-year changes, at US$2,4 billion. Agricultural imports declined significantly to US$1,3 billion because of slower domestic demand and large domestic crops. Figure 6.2.3 shows the structure of agricultural trade in 2019. Figure 6.2.3: Major agriculture and food imports and exports, 2019 Source: BFAP, 2020a, based on compiled data from ITC Trade Map, 2020 The growth in agricultural exports was underpinned by citrus, maize, apples, sugar cane, pears, avocados, grapes, and macadamia nuts. These products, along with an expected recovery in wine exports, will continue to support agricultural exports. Citrus features prominently in second- and third- Chapter 6.2. Agriculture DRAFT 25/05/2021 9
quarter exports; for the year as a whole, it reached a record of 146 million cartons, up 15% year-on-
year, according to data from the Citrus Growers Association of Southern Africa. Similarly, projections
from BFAP and estimates from the Supply and Demand Estimates Committee point to maize exports
reaching 2,5–2,7 million tonnes in the 2020/21 marketing season, up 89% year-on-year, following the
bumper domestic harvest.

Africa and Asia were the largest markets for South Africa’s agricultural exports in the second quarter
of 2020, respectively accounting for 33% and 29% in value terms. Europe was the third-largest market,
taking up 28%, and the balance of 10% by value was spread across the rest of the world. The main
imports were wheat, palm oil, rice, poultry meat, sunflower oil, and sugar.

IMPACT ON FOOD PRICES AND AFFORDABILITY
Overall, food inflation in 2020 posed a more significant threat to dietary diversity (i.e., consumers
being less able to afford fruit and animal-source foods) than to basic adequate energy intake. Inflation
on basic starch-rich staple foods was less severe, averaging about 3,8% year-on-year average. From
January to April/May 2020, year-on-year consumer price index inflation on food and non-alcoholic
beverages1 increased from 3,7% to 4,4%; it then fell to 3,9% in August/September. During the last
quarter of 2020, food inflation reached the highest levels of the calendar year, increasing to 6,0% in
December 2020. This was driven largely by higher international prices for food-related commodities.
In May to December 2020, inflation was particularly high for the following food categories: fruit (11,1%
year-on-year average), oils and fats (7,5%), and milk, eggs, and cheese (5,3%). In the fourth quarter of
2020, the prices of sugar and sugar-rich foods increased by 7,3% year-on-year average and that of
meat by 5,3%.

The BFAP Thrifty Healthy Food Basket measures the cost of basic healthy eating for low-income
households in South Africa. The methodology takes into consideration national nutrition guidelines,
the typical food intake patterns of lower-income households, official food retail prices from Statistics
South Africa, and typical household demographics. Consisting of a nutritionally balanced combination
of 26 food items from all the food groups, the BFAP Thrifty Healthy Food Basket is designed to feed a
reference family of four (comprising an adult male, an adult female, an older child, and a younger
child) for a month. From January to December 2020, the cost of the BFAP Thrifty Healthy Food Basket
increased by R271 from R2 562 to R2 833 per month, with a maximum value of R2 857 in May 2020.
Thus, for a four-member household with a dual minimum-wage income, benefiting from both child
grants and a school feeding programme, the share of household income allocated to basic healthy
eating would have increased from 29% to 31% from January to December 2020. This suggests that
about half the South African population would have been unable to afford a basic healthy diet.

The BFAP Thrifty Healthy Food Basket comprises a relatively smaller staple component and relatively
more items from food groups contributing to dietary diversity. The consumer price index, in contrast,

1
    Official Statistics South Africa consumer price index data for ‘all urban areas’

Chapter 6.2. Agriculture                         DRAFT 25/05/2021                                    10
has a relatively larger staple component, which reflects ‘typical’ food intake patterns. From April to December 2020, year-on-year inflation on the BFAP Thrifty Healthy Food Basket was consistently higher than consumer price index food inflation (Figure 6.2.4). This was due mainly to the combination of lower inflation on staple foods and higher inflation on foods contributing to dietary diversity (e.g., fruit and animal-source foods). Figure 6.2.4: Food inflation by month, 2020 Source: BFAP calculations, Statistics South Africa consumer price index data Since food affordability is affected by both the cost of obtaining food and household income, the negative impact of the Covid-19 pandemic on household income and poverty should also be considered. According to the second wave of the Statistics South Africa survey on the impact of the pandemic on employment and income (Stats SA, 2020c), about a third of people reported lower income because of Covid-19. They might have lost their jobs, had to close a business, or had their salaries and wages cut. The most recent National Income Dynamics Study – Coronavirus Rapid Mobile Survey (NIDS-CRAM) reported household hunger (i.e., any household member(s) going hungry in the last seven days) as 23% in May/June 2020, improving to 16% in July/August 2020, but deteriorating again to 18% in November/December 2020 (Spaull et al., 2021). In comparison, before Covid-19, only 5% of households skipped meals for ‘5 days in the past 30 days’ in 2018 (Stats SA, 2019). AGRICULTURAL EMPLOYMENT AND INCOMES High production estimates typically imply higher employment in the farming sector. However, the social distancing regulations introduced in March 2020 limited the extent to which farmers and agribusiness could potentially increase employment, especially of seasonal labour. Growth in employment in 2020 did not occur to the same degree and in the same way as it might have done in Chapter 6.2. Agriculture DRAFT 25/05/2021 11
the absence of the pandemic. Figure 6.2.5 shows job trends in South Africa’s primary agricultural
sector, reflecting a substantial decline (66 000 jobs) in the second quarter of 2020. Most of these job
losses were seasonal labour, which is not unusual in the months before the main summer season.
However, in the rest of the year, the recovery in employment was limited. This may be because
interviews were conducted telephonically, which may have excluded some agricultural workers.
Despite the job losses, the sector is resilient – output is higher and is projected to remain strong in
2021. This suggests that the sector will continue to require labour in the coming season, particularly
once the harvesting season for winter fruits gathers momentum. Seasonal labour will, however, still
be affected by the social distancing and other health regulations.
Figure 6.2.5: Trends in agricultural jobs, 2008 to 2020
950
Number of Jobs (‘000)
900
850
800
750
700
650
600
Jan-Mar 2014
Jan-Mar 2008
Jan-Mar 2009
Jan-Mar 2010
Jan-Mar 2011
Jan-Mar 2012
Jan-Mar 2013
Jan-Mar 2015
Jan-Mar 2016
Jan-Mar 2017
Jan-Mar 2018
Jan-Mar 2019
Jan-Mar 2020
Jul-Sep 2013
Jul-Sep 2014
Jul-Sep 2008
Jul-Sep 2009
Jul-Sep 2010
Jul-Sep 2011
Jul-Sep 2012
Jul-Sep 2015
Jul-Sep 2016
Jul-Sep 2017
Jul-Sep 2018
Jul-Sep 2019
Jul-Sep 2020
Source: Stats SA, 2020d
OVERALL IMPACT OF COVID-19 ON AGRICULTURE
The main point from the analysis is that the impact of the pandemic on the agricultural sector was not
uniform. Only a few sectors experienced considerable damage because of the regulations. For that
reason, it would be logical for government to assess each sector (as was done with the three case
studies in Meyer et al., 2021) to help design specific relief programmes to address the damage caused
by the pandemic. This needed to be done per sector and not by farm size, farmer typology, or the
gender of the farmer. South Africa’s precarious fiscal position requires a sensible, direct approach to
minimise the impact of Covid-19 without undermining budget stability. To this end, Table 6.2.1
provides a qualitative assessment of the losses per industry caused by the regulations in the different
lockdown periods.
Chapter 6.2. Agriculture DRAFT 25/05/2021 12Table 6.2.1: Qualitative assessment of the losses per industry
Minimal Medium Severe
Key No impact Low impact High impact
impact impact impact
Industry Level 5 Level 4 All alert levels
26 March – 30 April 2020 1 May to 31 May 2020 1 June 2020 – 31 March 2021
Maize Intermittent disruptions in Improved seaport operations No impact
the supply of raw materials meant greater capacity to
and products. support movement of grain
Ports were not operating in and out of the country.
efficiently, as they were However, inland border
understaffed, with some posts still had bottlenecks
terminals closed. This and challenges – especially
worsened congestion. Beitbridge and the Lebombo
Labour movement was border posts.
constrained by curfews and Shortage of packaging
interprovincial travel material was reported, as
restrictions. Workers had to consumers switched to
produce proof that they were bigger packages because
essential, but some seasonal they shopped less
workers were unable to frequently, and packaging
comply. material manufacturing was
Manufacturers of packaging not at full capacity.
materials were closed,
leading to a shortage of
packaging materials.
Soybeans No impact No impact No impact
Wheat No impact No impact No impact
Sunflower No impact No impact No impact
Canola No impact No impact No impact
Barley Despite restrictions on Barley planting increase by Owing to restrictions on
alcohol sales, local 10 000ha from 2019 levels beer sales and less malting
contracting for barley (20% decline year-on-year
production continued. for the 2019/20 marketing
However, malting restrictions year until end-September
reduced processing volumes, 2020), barley stock levels
leading to stock build-up. are at a record high.
Grain No impact No impact No impact
sorghum
Oats No impact No impact No impact
Potatoes Potato market prices in April Impact (prices and volumes Impact from weaker
2020 R10/packet lower than not back to normal levels) demand and restaurant
the same month in 2018 and closures
2019
Tomatoes Reduced demand and lower Reduced demand and lower Reduced demand and lower
prices prices prices
Other Reduced demand and lower Reduced demand and lower Reduced demand and lower
vegetables prices prices prices
Citrus Minimal impact because of Minimal impact because of Minimal impact because of
logistical bottlenecks at ports logistical bottlenecks at logistical bottlenecks at
but support from the weak ports but support from the ports but support from
Chapter 6.2. Agriculture DRAFT 25/05/2021 13Industry Level 5 Level 4 All alert levels
26 March – 30 April 2020 1 May to 31 May 2020 1 June 2020 – 31 March 2021
exchange rate & high world weak exchange rate & high weak exchange rate & high
prices world prices world prices
Deciduous No impact No impact Some impact from port
fruit delays due to container
shortages
Table grapes No impact – bulk of season No impact Some impact from port
concluded by the time delays due to container
lockdown was introduced shortages
Wine grapes Some wineries/cellars unable Minimal impact Lower prices because of
to pay producers for February sales restrictions on wine
and March deliveries
Wine cellars Full impact – all sales and Wine cellars and wine Reduced demand owing to
and estates exports prohibited. Dramatic cooperatives continue to no tourism or restaurant
impact on stock levels, cash experience cash flow strain sales; sales restrictions
flow and profitability. Local because of the ban on local imposed in December 2020.
wines lose market share sales.
abroad. No other wine
exporting country banned
exports.
Nuts No impact Minimal impact because of Minimal impact because of
logistical bottlenecks at logistical bottlenecks at
ports but support from the ports but support from the
weak exchange rate weak exchange rate
Mangoes No impact No impact
Avocadoes Minimal impact because of Minimal impact because of Minimal impact because of
logistical bottlenecks at ports logistical bottlenecks at logistical bottlenecks at
but support from the weak ports but support from the ports but support from the
exchange rate weak exchange rate weak exchange rate
Litchis No impact No impact
Bananas No impact No impact
Beef cattle Closure of food service sector
Reduced demand and lower
cut demand. Producer prices
producer prices
low, but retail prices firm
Dairy Reduced demand and lower Reduced demand and prices
prices because of bans on because of bans on quick-
quick-service restaurants service restaurants
Lamb and Reduced demand and lower Minimal impact: Prices at No impact
mutton prices pre-Covid-19 levels
Wool Auctions and all fibre No impact No impact
activities suspended. Cash
flow impact for farmers with
wool in value chain/auctions
Mohair Auctions and all fibre No impact No impact
activities suspended. Cash
flow impact for farmers with
mohair in value
chain/auctions
Chapter 6.2. Agriculture DRAFT 25/05/2021 14Industry Level 5 Level 4 All alert levels
26 March – 30 April 2020 1 May to 31 May 2020 1 June 2020 – 31 March 2021
Animal No trading and transport– No impact No impact
skins/leather cash flow impact on abattoirs
and beef and lamb farmers
Broilers Closure of restaurant sector
reduced demand – estimated
20% of consumption through Sit-in restaurants still not
food service sector. allowed; food only served on
Some imported vaccines a takeaway basis; this
difficult to obtain because continued to subdue
lack of flights, which also demand
affected vitamin prepacks for
animal feed sector
Eggs Drop in volumes and prices Drop in volumes and prices
because of bans on because of bans on
takeaways and restaurants. takeaways, restaurants
Temporary shortage of
packing material, as recycling
facilities were not operational
Pigs Reduced demand and lower Reduced demand and lower
prices prices
Ostrich meat Minimal impact Minimal impact Minimal impact
Goats Reduced demand and lower Reduced demand and prices Reduced demand and lower
prices in informal markets in informal markets prices in informal markets
Live game Major cancellations from Sharp decline in hunting and Overall hunting activity and
international hunters thus economic activity linked agri-tourism still low
Lucerne No impact No impact No impact
Sugar cane No impact No impact No impact
Cotton Harvesting and ginning halted Some delays in exports, as No impact
for alert level 5; some delays cotton is a non-food
in exports, as cotton is a non- product.
food product.
Flowers Trade prohibited – No impact No impact
destruction of large volumes
of produce; cash flow impact
Nurseries Trade prohibited – cash flow No impact No impact
impact
Source: Authors’ analysis
IMPACT ON THE WINE INDUSTRY
The qualitative analysis above highlights the devastating impact of the various regulations on the wine
industry (Figure 6.2.6). This impact is explored below, in two ways: (a) performance in 2020 is
compared with that of 2019; and (b) a modelling exercise was used to calculate the impact in terms
of various economic metrics relative to a baseline projection for 2020. The baseline projection was
informed by the actual crop harvested and the reality of the general economic environment under
Covid-19 restrictions. However, because it assumes that trade carried on unrestricted, both
Chapter 6.2. Agriculture DRAFT 25/05/2021 15domestically and in the export market, it presents a benchmark against which the impact of the
restrictions per se could be evaluated.
Figure 6.2.6: Timeline of regulatory measures specific to the wine industry
Source: SAWIS, 2021
To assess the effect of the ban on alcohol sales in 2020, the modelling exercise calculated the total
impact – the sum of the direct, indirect, and induced impact of the alcohol value chain on the South
African economy – expressed on an annualised basis. It used the following scenarios:
• Scenario A: the absolute impact of a 9-week sales ban, including a 5-week ban on exports
• Scenario B: the absolute impact of a 9-week domestic sales ban
• Scenario C: the absolute impact of a 12-week domestic sales ban
• Scenario A + Scenario B: the cumulative impact of the initial 9-week sales ban, including a 5-week
ban on exports, and a further 9-week domestic sales ban.
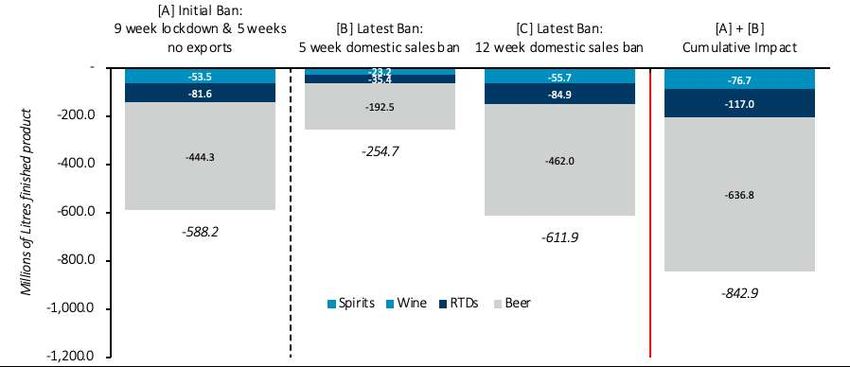
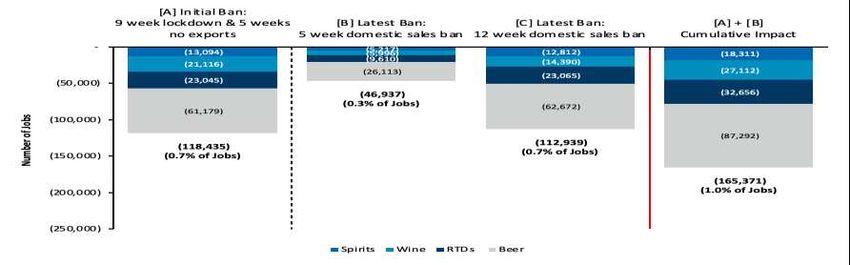
The modelling exercise estimated the cumulative impact of the 14-week ban on alcohol sales and a 5-
week ban on imports as a R30,4 billion loss in GDP on an annualised basis, equivalent to 0,7% of GDP
(Figure 6.2.7). The cumulative loss to employment of the first and second alcohol bans was 165 137
jobs, equivalent to 1% of employment (Figure 6.2.8). The annualised loss in tax revenue (excluding
excise tax) of the ban on alcohol sales is R19,4 billion. This is equivalent to 1,6% of national tax revenue
(excluding excise tax) (Figure 6.2.9). The total loss in excise taxes is R5,8 billion, equivalent to 14,1%
of national excise tax revenue (Figure 6.2.10). The total loss in sales volumes is 1 billion litres (Figure
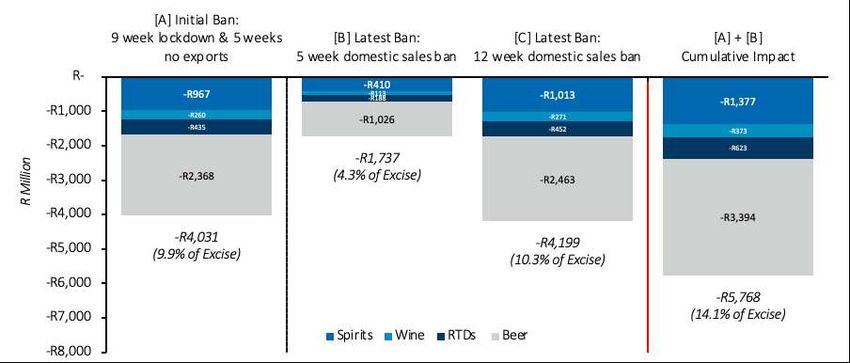
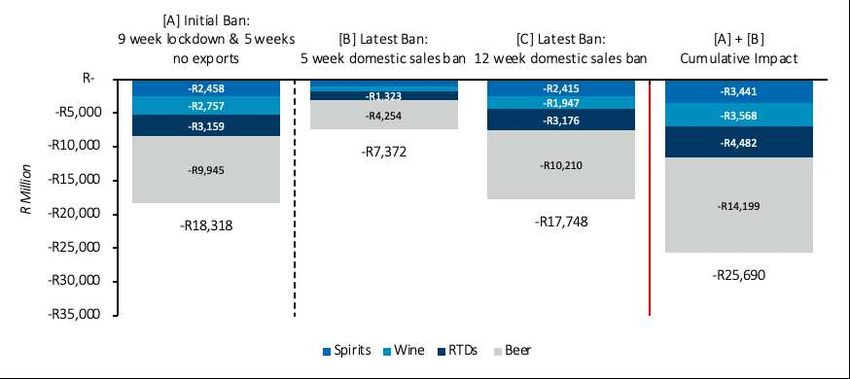
6.2.11). The total loss in sales revenue is R25,7 billion (Figure 6.2.12).
Chapter 6.2. Agriculture DRAFT 25/05/2021 16Figure 6.2.7: Annualised impact of alcohol ban on GDP at factor cost Figure 6.2.8: Annualised impact of alcohol ban on employment Figure 6.2.9: Annualised impact on tax revenue (excluding excise tax) Chapter 6.2. Agriculture DRAFT 25/05/2021 17
Figure 6.2.10: Annualised impact on excise tax revenue

 Figure 6.2.11: Annualised impact on sales volumes

 Figure 6.2.12: Annualised impact on sales revenue

Chapter 6.2. Agriculture                DRAFT 25/05/2021   18
Industry statistics for 2020 confirm the sombre picture painted by the modelling exercise. After several
years of decline, wine production increased by 6,7% year-on-year in 2020, mostly because of better
weather conditions. In contrast, domestic sales of still and sparkling wine declined by 20% year-on-
year (SAWIS, 2021), which reflects both the various sales restrictions (Figure 6.2.6) and weak
consumer spending power. Although export volumes remained stable year-on-year, it must be noted
that 2019 volumes had already been more than 25% lower than in 2018; therefore, 2020 volumes are
well below average. The value of exports was supported by the weaker exchange rate, which yielded
higher rand-based prices.

When the first restrictions on wine sales were imposed in April 2020, wine prices fell sharply, by 20%
month-on-month. This was followed by a steady recovery, as wine is not perishable and could simply
be stored for later resale. However, the combination of weak sales and higher production caused
storage capacity to fill up rapidly. By October 2020, stocks had reached an all-time high. Consequently,
in the last quarter of 2020, prices were around 10% below the levels recorded in the first quarter.
Industry estimates suggest that by end-December 2020, stock levels were almost 43% above the levels
recorded at the end of 2019. Thus, even if sales were unaffected for the rest of 2021, prices might well
come under further pressure. BFAP (2020a) suggests that the high level of stocks will take several
years to clear. Modelling exercises estimate that this, combined with weak consumer spending, would
result in a 6% year-on-year decline in bulk wine prices in 2021, even before accounting for the
domestic sales ban until the end of January. When this ban is accounted for, a 10% year-on-year
decline in bulk wine prices is expected in 2021, even if sales were unaffected for the rest of the year.

IMPACT ON VULNERABLE SECTORS
INFORMAL TRADERS
Informal traders play an essential part of the food system and contribute significantly to the economy,
while providing accessible and affordable food to poor and vulnerable groups. It is estimated that
informal traders contribute 8–10% to South Africa’s GDP. In 2018, the informal sector comprised at
least 40% of the food market, the rest being formal retailers. In the same year, the informal sector
was valued at R404 billion, whilst the entire market was worth R1,02 trillion (Bhana, 2018). About 50%
of sales from the Johannesburg Fresh Produce Market go to the informal market. These traders also
sell various sources of protein, such as pork and chicken, and about 10% of all broilers reared in the
country are sold as live fowls. About 60% of all bread is sold through the informal sector. Informal
traders are difficult to regulate, which explains why they were initially omitted in the regulations.
However, in recognition of the importance of the informal food trade, this regulation was quickly
amendment (by 6 April 2020), and informal traders were allowed to trade.

The systemic risk, however, is that informal traders typically operate from traditional high-density
areas and/or townships. These areas are difficult to monitor, and lockdown protocols could be
routinely violated. Given the lack of data on the informal food system, the extent to which the Covid-
19 pandemic and the lockdown affected livelihoods and rural economies is not yet clear. However,

Chapter 6.2. Agriculture                  DRAFT 25/05/2021                                            19
several organisations interviewed for this chapter (Table 6.2.3 in Annex 6.2.1) commented on the
effects of the initial days of lockdown on the sector. These included:
•   Consumers paid higher prices for goods they would normally purchase for much less through the
    informal sector.
•   Consumers needed at times to travel (at extra cost) to a formal retailer instead of conveniently
    obtaining food closer to home through the informal sector.
•   Workers were unable to purchase hot meals from street vendors.
•   As their products were not being sold by the informal sector, fresh produce markets, pork and
    chicken producers, and the like experienced a knock-on effect.
•   Hundreds of households that rely on this form of trade as their sole source of income could no
    longer earn income; this reduced their purchasing power and undermined their food security.

SUBSISTENCE AND SMALL-SCALE FISHERS
The DEFF has recognised three groups of fishers since the amendment of the Marine Living Resources
Act in 2014: commercial, small-scale, and recreational fishers (RSA, 2014). After the declaration of a
national state of disaster, the minister of environment, forestry and fisheries approached the National
Coronavirus Command Council to declare commercial fishing and small-scale fishing as essential
services (Sunde & Erwin 2020), given that ‘the fisheries sector is crucial for domestic food security’
(DEFF, 2020a). To ease on the movement of people during this time, the DEFF granted a three-month
exemption on the renewal of existing fishing permits (DEFF, 2020a). Later, permits that had lapsed
during alert levels 4 or 3 were extended until the end of level 3 (DEFF, 2020e). Therefore, both
commercial and small-scale fishers could continue operating under their existing fishing permits.
Small-scale fishers working in cooperatives needed to carry permit conditions circulated by the DEFF,
along with a Letter of Grant from the cooperative that confirmed its status as a recognised cooperative
with fishing rights (Sunde & Erwin 2020).

The DEFF announced some exceptions to accommodate fishers. For instance, commercial and small-
scale fishers of the Western and Northern Cape were given permission to take advantage of the snoek
run in the Northern Cape, provided their fishing permits were valid, and the municipalities permitted
the langana (fish buyer/seller) (DEFF, 2020b). Further, for small-scale fishers in the Western Cape who
could not sell abalone and West Coast rock lobster to their traditional markets (e.g., China) in January
and February 2020, the fishing season was extended to July 2020; under alert level 4, ways were
sought to export catch (DEFF, 2020b). The DEFF and private industries countrywide also planned to
distribute over 10 000 food parcels and interim relief to small-scale fishers in need (DEFF, 2020b).

When the amendments to the Marine Living Resources Act were adopted by Parliament in 2014, the
term ‘subsistence’ fisher disappeared from the legislation (Sunde & Erwin, 2020). The DEFF held that
in terms of the Act, subsistence fishers counted among small-scale fishers (DEFF, 2020f). The inclusion
of former subsistence (now small-scale) fishers in the new regulations necessitated a process to
register them as a group recognised by the DEFF; the DEFF had facilitated this process for the last few

Chapter 6.2. Agriculture                    DRAFT 25/05/2021                                           20
You can also read