Characterisation of initial fire weather conditions for large spring wildfires in Alberta, Canada
←
→
Page content transcription
If your browser does not render page correctly, please read the page content below
CSIRO PUBLISHING

International Journal of Wildland Fire 2021, 30, 823–835
https://doi.org/10.1071/WF21045

     Characterisation of initial fire weather conditions for large
     spring wildfires in Alberta, Canada

     Cordy Tymstra A,C, Piyush Jain B and Mike D. Flannigan A
     A
       Department of Renewable Resources, University of Alberta, 751 General Services Building,
       Edmonton, AB, T6G 2H1, Canada.
     B
       Natural Resources Canada, Canadian Forest Service, Northern Forestry Centre, 5320 122 Street,
       NW, Edmonton, AB, T6H 3S5, Canada.
     C
       Corresponding author. Email: cordy.tymstra@ualberta.ca

     Abstract. We evaluated surface and 500-hPa synoptic weather patterns, and fire weather indices from the Canadian
     Forest Fire Danger Rating System for 80 large wildfires during 1990–2019 in Alberta that started in May and grew to over
     1000 ha. Spread days were identified during the first 4 days of wildfire activity. We observed two distinct synoptic weather
     patterns on these days. Pre-frontal and frontal passage activity was the predominant feature associated with 48% of the
     calendar spread days. Strong south–south-east winds from a surface high centred east of Alberta (west of Hudson Bay) and
     supported by an upper ridge, and a surface low located south-west of the ridge occurred on 26% of the calendar spread days.
     Surface analysis indicates the spring wildfire season in Alberta is driven by very high to extreme Initial Spread Index, a
     rating of the expected wildfire rate of spread based on Fine Fuel Moisture Code and wind. Very high to extreme values of
     Buildup Index, a rating of the amount of fuel available for consumption, are not a prerequisite for large wildfires in May.
     For Alberta, this means large wildfires in May can occur after only a few days of dry, windy weather.

     Keywords: wildfire spread, spring boreal wildfires, synoptic weather patterns, fire danger.

     Received 8 April 2021, accepted 27 August 2021, published online 16 September 2021

Introduction                                                         resources may not yet be fully available, and low fuel moisture
Very large wildfires are a common feature of the boreal fire         levels contribute to extreme wildfire behaviour. In Alberta,
regime in Canada (Tymstra 2015; Hanes et al. 2019). However,         spring is the critical season (Tymstra et al. 2019) when nearly
since 1959, Canada has experienced an increase in the number of      all of the associated structural losses occur from wildfires. There
lightning wildfires (Coogan et al. 2019), area burned (Hanes         is therefore great interest in understanding the environmental
et al. 2019) and the number of wildfire disasters causing eva-       conditions contributing to wildfires that start in spring, subse-
cuations and structural losses (Tymstra et al. 2020). Recent         quently grow large and become challenging to manage.
disastrous wildfire seasons in western Canada occurred in 2011           Various multivariate approaches have been used to investi-
(Alberta), 2014 (Northwest Territories), 2015 (Alberta and           gate biophysical factors associated with wildfires (occurrence
Saskatchewan), 2016 (Alberta), 2017 and 2018 (British                and area burned) in, for example, France (Ganteaume and
Columbia), and 2019 (Alberta). Projected higher temperatures,        Jappiot 2013), Spain (Verdú et al. 2012; Viedma et al. 2015),
more lightning and weather extremes (Flannigan et al. 2009;          Portugal (Parente et al. 2016), the United States (Parks et al.
Coogan et al. 2019) will contribute to increasing wildfire           2018) and Canada (Cumming 2001; Krawchuk et al. 2006).
intensities in the future, and diminishing returns on investment         In their investigation of the relationship of various meteoro-
from suppression efforts (Wotton et al. 2017). During the 2005–      logical variables to area burned in Canada, Flannigan and
2014 period, extreme wildfire risk increased an estimated 150%       Harrington (1988) found the strongest predictor of the variance
to 600% in western Canada as a result of the combined impact of      in area burned was the duration of dry periods. Earlier studies
anthropogenic and natural forcing compared with natural vari-        recognised the importance of wind, Byram (1954) suggesting
ability alone (Kirchmeier-Young et al. 2017).                        certain wind profiles are associated with blow-up wildfires, and
    Climate change impacts also include changes in spring            Schaefer (1957) linking jet streams and wildfires.
phenology resulting in earlier spring wildfire seasons                   Schroeder et al. (1964) identified critical synoptic weather
(Beaubien and Hamann 2011; Pickell et al. 2017). Spring              types associated with periods of extreme fire behaviour, and
wildfires across Canada are particularly a challenge during the      Brotak and Reifsnyder (1977) extended similar weather analy-
period between snowmelt and green-up when suppression                ses to investigate 60 major wildfires in the eastern United States.

Journal compilation Ó IAWF 2021 Open Access CC BY-NC-ND                                               www.publish.csiro.au/journals/ijwf
824     Int. J. Wildland Fire                                                                                                            C. Tymstra et al.

         1008                                                                                                                                 1012

                                                                                             L 1000                                       1008

                L                                                                                                                      1004
             1004                                                                                                                     1000

                                      L
                                                                                                                                  1000
                                                                    Cold                                                       1004
                  1004                                            Arctic air                                                  1008
                 1000                                                      H                                                1012

                    L                                                          1028                                        1012
                                                                               1024
         1008                                                                   1020

        1012
                                                         RH 15-                 RH 30%    Modified dry
                                          cool, moist     25%
                                                                                           Arctic air
                                           pacific air
         1016                                                                                 H
                                                                                                                   1012
                                                                                           1016
                                                 L

                                                                                           1012

      Fig. 1. Surface weather analysis 23 May 1968, 1300 Mountain Standard Time (MST) (2000 Greenwich Mean Time (GMT)). Note the location
      of the high-pressure area west of Hudson Bay that resulted in a strong, dry, south-east anti-cyclonic flow over central Alberta, and the low-
      pressure area west of the province with a cyclonic flow supporting the south-east flow. Modified from Kiil and Grigel (1969).

Frontal passages were a common factor for 45 of these wildfires.                  strong and dry south–south-east winds over central Alberta
Skinner et al. (2002) found an association between large areas                    (Fig. 1).
burned in western Canada with 500-hPa ridging, and the mean                           The study area is depicted in Fig. 2. Only those wildfires
500-hPa height difference between 458N and 658N latitude. In                      within the boreal forest in Alberta during the 1990–2019 period
Alberta, frontal passages are often associated with the break-                    were included in the present study. This period was selected
down of these 500-hPa ridges and the subsequent arrival of                        because detailed wildfire report and weather data in the Fire
lightning-caused wildfires (Nimchuk 1983).                                        Information and Resource Environment System (FIRES), which
   More recent studies have applied statistical approaches for                    is managed by Alberta’s Wildfire Management Branch (WMB),
synoptic weather typing using interpolated geospatial gridded                     begins in 1990. The WMB is responsible for managing wildfires
data from meteorological observations or modelled reanalysis                      on provincial forested lands. Wildfires in the national parks are
products and then correlating these with fire danger metrics.                     managed separately and were excluded because of the absence
Examples include the use of composite map analysis using                          of detailed daily wildfire data similar to that available in Alberta.
National Centers for Environmental Protection/National Center                     Wildfire report data from FIRES are available publicly (https://
for Atmospheric Research (NCEP/NCAR) reanalysis outputs of                        wildfire.alberta.ca/resources/), and weather data are available
days with highest area burned (Pereira et al. 2005), correlation                  via a request to the WMB. The next section describes the data
analysis of NCEP/NCAR reanalysis outputs and the Haines Index                     and analysis methods used to characterise the fire weather
and Palmer Drought Index (Trouet et al. 2009), fuzzy c-means                      conditions of large spring wildfires in May. This is followed
cluster analysis classification of fire days into synoptic weather                by the results and discussion sections. Our discussion focuses on
groups (Duane and Brotons 2018); k-means cluster analysis                         the operational implications for wildfire behaviour analysts
classification of weather type (Ruffault et al. 2017); and Self-                  working on incident management teams. The conclusion sum-
Organised Map classification of synoptic weather patterns asso-                   marises the key results, limitations and research gaps, and
ciated with critical fire weather conditions (Crimmins 2006;                      opportunities for enhanced wildfire preparedness in the spring.
Lagerquist et al. 2017; Zhong et al. 2020).
   We similarly investigate the association between meteoro-                      Study area
logical variables and synoptic conditions but focus on May                        Alberta is the sixth largest province of Canada, landlocked by
wildfire activity in Alberta, Canada. Our attention to the month                  British Columbia to the west, Saskatchewan to the east,
of May is motivated not only by recent disastrous spring seasons                  Northwest Territories to the north, and the state of Montana,
but also past events such as the ‘Seven Days in May’ wildfire                     USA (not included on Fig. 2) to the south. There are five eco-
outbreak in 1968 (McLean and Coulcher 1968) when a persis-                        zones in Alberta: Prairies, Montane Cordillera, Boreal Plains,
tent blocking pattern aloft allowed a surface high to sustain                     Taiga Plains and Taiga Shield (Wiken 1986). The Boreal Plains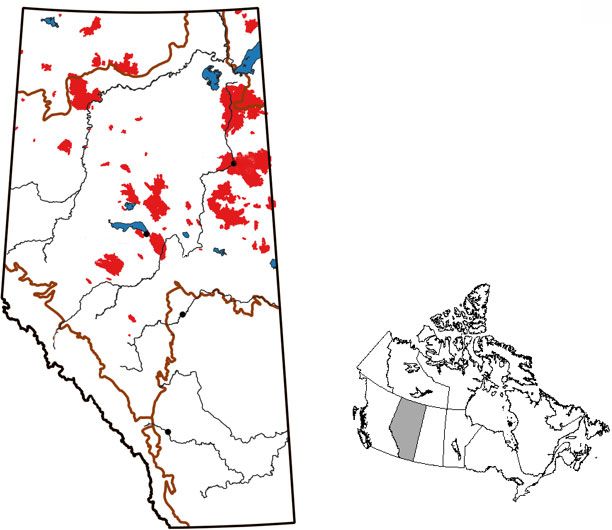
Large spring wildfires in Alberta, Canada                                                                                   Int. J. Wildland Fire   825

                      Taiga plains                                TS
                                          1995

                                  2019

                                         Boreal plains
                                                        2011

                                           Fort McMurray           2016

                                                        1995
                                                 2019

                                                                 2002
                               Slave Lake
                                                 2001
                                         1998
                  M

                                                        Edmonton
                    on
                      ta
                         n
                         e
                         Co
                             rd

                                                               Prairies
                              ille
                                  ra

                                                   Calgary

             Fig. 2. Location of the Province of Alberta and wildfires greater than 1000 ha in size on provincial forested lands that started
             during the month of May. Wildfires greater than 100 000 ha are labelled by year. The five ecozones in Alberta are delineated and
             labelled. TS, Taiga Shield Ecozone. Wildfire perimeter data provided by the Wildfire Management Branch.

Ecozone covers most of Alberta’s forested landscape and                        Alberta WMB in Edmonton, Alberta. If a wildfire in Alberta
extends east into Saskatchewan and Manitoba. It is a landscape                 grows larger than 2.0 ha before initial attack begins, it is con-
dominated by coniferous forests interspersed with peatlands                    sidered an initial attack (IA) escape. If a wildfire cannot be con-
(bogs, fens and swamps).                                                       tained at 1000 hours on the following day when it was assessed, it
    Alberta’s geographic location and topographic features                     is reported as a containment or Being Held (BH) escape. Of the
influence weather patterns, which impacts the wildfire season.                 selected 80 wildfires, 57 escaped both IA and BH, and 4 escaped
The Rocky Mountains and foothills traversing north-west from                   IA but were successfully contained (BH success). Despite initial
the Canada–United States border (498N) to near Grande Prairie                  attack resources arriving on 19 wildfires before they exceeded
(558N) support the formation of clouds and precipitation during                2 ha in size, BH success was attained on only one wildfire.
easterly upslope wind flows, and warming and drying during                         Most wildfires are assessed the day they are reported, which
westerly downslope wind flows. North of Grande Cache, moist                    typically is the day they started. We focus on the first 4 days,
Pacific air masses have fairly easy entry into central and                     which includes the wildfire start date. For the three wildfires
northern Alberta. Air masses originating from the Arctic also                  starting earlier but discovered and reported later, and the three
move unimpeded as they travel south and south-east into the                    wildfires with start dates reported as unknown, we used the
Prairie Provinces (Alberta, Saskatchewan and Manitoba).                        discovered date as Day 1. Podur and Wotton (2011) used an
                                                                               Initial Spread Index (ISI) classification threshold of $8.7 to
                                                                               differentiate wildfire spread days from non-spread days. ISI is a
Methods                                                                        numerical rating of a wildfire’s spread potential (Van Wagner
For the 1990–2019 period, we selected all May wildfire starts in               1987). To derive spread day distributions for input into burn
Alberta with a reported extinguished size exceeding 1000 ha (see               probability modelling, Parisien et al. (2013) applied a calculated
Fig. 2). Point attribute and perimeter data were obtained from the             rate of spread threshold of $1 m min1 to identify spread days.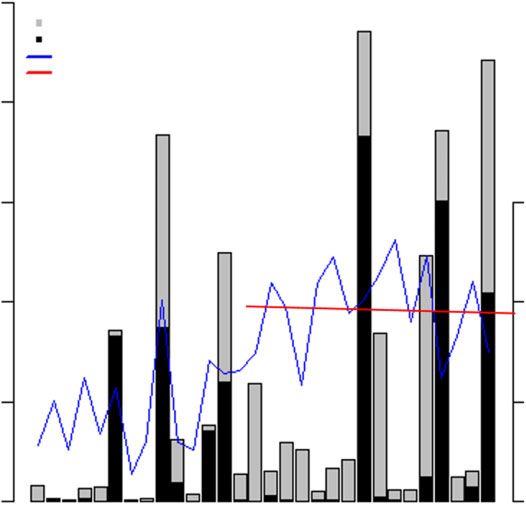
826      Int. J. Wildland Fire                                                                                                               C. Tymstra et al.

                           Table 1. Hazard rating classes for fire weather index codes and indices used in Alberta
FFMC, Fine Fuel Moisture Code; DMC, Duff Moisture Code; DC, Drought Code; ISI, Initial Spread Index; BUI, Buildup Index; FWI, Fire Weather Index

Hazard Rating                  FFMC                     DMC                     DC                       ISI                   BUI                     FWI

Low                              0–76                   0–21                   0–79                     0–1.5                 0–24                     0–4.5
Moderate                         77–84                  22–27                 80–189                     2–4                  25–40                  4.5–10.5
High                             85–88                  28–40                 190–299                    5–8                  41–60                  10.5–18.5
Very High                        89–91                  41–60                 300–424                   9–15                  61–89                  18.5–29.5
Extreme                           92þ                    61þ                   425þ                     16þ                    90þ                    29.5þ

Table 2. Synoptic-scale weather patterns and associated pre-frontal, frontal passage and gust occurrences for the 149 spread day events associated
                                                                 with one or more wildfires
For example, a total of 26 spread day events occurred with weather pattern 1a (trough at the surface and a ridge at 500 hPa), 4 days had pre-frontal activity
    (3 with reported gusts), 8 days had frontal passage (7 with reported gusts), and 11 days had gusts but with no pre-frontal or frontal passage activity

Synoptic-scale weather pattern           Surface þ upper (500 hPa) weather pattern                             Number of spread day events
                                                                                          Total      Pre-frontal/gusts       Frontal passage/gusts      Gusts

Trough/low þ ridge/high                  1a: Trough þ ridge                                 26              4/3                       8/7                 11
                                         1b: Trough þ high                                  1                0                        1/1                 0
                                         1c: Low þ ridge                                    32              2/1                       17/8                9
                                         1d: Low þ high                                     2                0                         0                  0
Trough/low þ trough/low                  2a: Trough þ trough                                5                0                        4/1                 0
                                         2b: Trough þ low                                   3                0                        1/1                 1
                                         2c: Low þ trough                                   1                0                        1/1                 0
                                         2d: Low þ low                                      1                0                         0                  0
Trough/low þ other                       3a: Trough þ col                                   5                0                         0                  3
                                         3b: Trough þ zonal                                 1                0                         0                  1
                                         Flow                                               1                0                         0                  1
                                         3c: Low þ other
Ridge/high þ ridge/high                  4a: Ridge þ ridge                                  12              1/1                       2/2                 6
                                         4b: Ridge þ high                                   0                0                         0                  0
                                         4c: High þ ridge                                   40              5/2                       6/3                 18
                                         4d: High þ high                                    2                0                         0                  2
Ridge/high þ trough/low                  5a: Ridge þ trough                                 0                0                         0                  0
                                         5b: Ridge þ low                                    0                0                         0                  0
                                         5c: High þ trough                                  4                0                        2/2                 1
                                         5d: High þ low                                     2                0                        2/0                 0
Ridge/high þ other                       6a: Ridge þ col                                    1                0                        1/0                 0
                                         6b: High þ zonal flow                              4                0                         0                  3
                                         6c: High þ col                                     2                0                        1/1                 0
Other þ ridge                            7a: Col þ ridge                                    3                0                        1/1                 0
Other þ other                            8a: Col þ col                                      1                0                         0                  1

We chose a mixed approach to identify a spread day event.                            (trough) pressure occurring at the surface or aloft. We identified air
A spread day occurred on Day 1 if the reported wildfire size                         masses that were more concentric in shape as lows or highs. The
exceeded 200 ha or the noon ISI was 9 or greater. Spread days                        weather pattern ‘other’ includes col (neutral) and zonal flow.
occurred on Days 2 to 4 if either they doubled in size from the                          For the 1990–2004 period, we accessed surface maps from
previous day or the ISI $ 9 threshold was reached. The ISI                           the National Oceanic and Atmospheric Administration (NOAA)
threshold of 9 is the start of the Very High ISI category used in                    National Centers for Environmental Prediction (NCEP) surface
Alberta (Table 1). Days with a reported BH or UC (under                              analysis archive (National Oceanic and Atmospheric Adminis-
control) status were not considered as spread days.                                  tration 2021a), and 500-hPa maps from the NOAA Central
   We analysed surface (3-h intervals) and 500-hPa synoptic                          Library weather and climate collections (National Oceanic and
weather patterns (2 per day) for the first 4 days for all 80                        Atmospheric Administration 2021b). To address gaps in the
wildfires. For those days when a spread event occurred, we                           surface maps during the 1990–2004 period, we also accessed
manually characterised the weather patterns into 24 surface and                      daily surface weather maps from the NOAA central library
upper weather pattern combinations (see Table 2). Ridges and                         weather and climate collections (National Oceanic and Atmo-
troughs were identified as elongated areas of high (ridge) or low                    spheric Administration 2021c).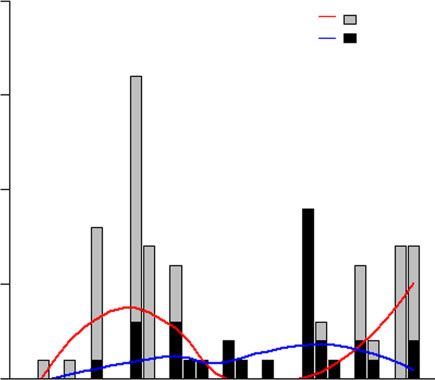
Large spring wildfires in Alberta, Canada                                                                        Int. J. Wildland Fire             827

    For the 2005–2019 period, we accessed surface maps from                                       8838 May willdfires
                                                                                                     1990–2019
the NOAA NCEP surface analysis archives (National Oceanic
and Atmospheric Administration 2021c), and 500-hPa maps
                                                                                                80 willdfires >1000 ha
from the NOAA NCEP daily weather map archives (National                                           extinguished size
Oceanic and Atmospheric Administration 2021d).
    We used the McElhinny et al. (2020) global high-resolution
(0.258  0.258) dataset of Fire Weather Index (FWI) System               (a) 50 Lightning-                               (b)      30 Human-
fuel moisture codes and fire behaviour indices that were                   caused wildfires                                     caused wildfires
calculated using surface meteorology data from the ERA5
reanalysis (Mesinger et al. 2006) for the 1979–2018 period.              (c) 29 Spread                                   (d )  25 Spread
For our study, we extended this dataset to include 2019. The                  event groups                                    event groups
Province of Alberta including an edge buffer was clipped from              (temporal/spatial)                              (temporal/spatial)
the global dataset between –120.1258 and –109.8758 longitude
and 48.8758 and 60.1258 latitude. FWI System outputs were                (e) 123 Spread                                  (f )     89 Spread
calculated using the ERA5 deterministic meteorology outputs                  events on 79                                        events on 70
                                                                            calendar days                                       calendar days
of temperature (8C), dewpoint temperature (8C) used to derive
relative humidity (%), wind speed (km h1), and 24-h accumu-
lated precipitation (mm). The standard overwinter Drought
Code adjustment was used to derive starting values as                                           (g) Combined 92
described by McElhinny et al. (2020).                                                              individual calendar
    The FWI system was developed adhering to the World                                             spread day events
Meteorological Organization reporting standards (Lawson and
Armitage 2008). For forecasting purposes, the recommended            Fig. 3. Calendar day spread event flowchart. The 80 large wildfires are
                                                                     first categorised by cause (boxes a and b) and then grouped into spatial-
hourly surface wind speed for use in the FWI system is the
                                                                     temporal spread event groups (boxes c and d). The total number of spread
average 10-m wind speed over the last 10 min before the hour. In     events are shown in boxes (e) and (f). The combined number of individual
Alberta, this average wind speed is calculated using a sampling      calendar days with one or more spread events is shown in box (g).
frequency of 4 Hz. Maximum (peak) observed wind speeds
within the last hour were obtained from the nearest weather
station. Peak wind speeds continuing longer than 1 min can           event groups facilitated the qualitative analysis of the synoptic
significantly impact fire behaviour (Crosby and Chandler 2004),      weather types associated with the wildfire spread events.
but they are not an input in the calculation of Fine Fuel Moisture       The 54 groups yielded a total of 212 spread events (boxes e
Code (FFMC) and ISI. FFMC is a numerical rating of the               and f in Fig. 3). Many of the spread events within a group had
moisture content of fine fuels and their ease of ignition and        multiple wildfires occurring on the same day. For example,
flammability (Van Wagner 1987). If gusts are reported, fire          spread event group 3 (see Table S1, Supplementary material)
behaviour analysts typically increase the input wind speed to        included 5 wildfires with 15 spread events occurring on 5
calibrate their forecast to match what is observed.                  separate calendar days. The 212 spread events occurred on 92
    If gusts were reported at a weather station, we converted the    individual (unique) calendar day spread events (box g in Fig. 3).
10-min average wind speed to a probable maximum 1-min                    We not only investigated the occurrence of synoptic weather
average wind speed and recalculated the FFMC and ISI values          patterns similar to those during the 1968 wildfire outbreak during
using the adjusted wind speed. The wind speeds were adjusted         the identified spread event days but also during non-wildfire days.
using a piecewise linear function to approximate the converted       If synoptic weather patterns 4a and 4c (Table 2) with south–south-
metric values of the tabular data published by Crosby and            east winds exceeding 18.5 km h1 (10 knots or a full barb wind
Chandler (2004).                                                     speed symbol on weather maps) occurred, it was considered as a
                                                                     potential critical spread day similar to the 1968 wildfire event.
      For WS10 o19; WS1 ¼ ð1:505954  WS10 Þ  1:11                  The town of Slave Lake was used as a central reference location to
                                                                     cross-validate the wind flow assessed from the surface weather
          For WS10  19; WS1 ¼ ðWS10 þ 8Þ  1:11                     maps using historical hourly weather data for the Slave Lake
                                                                     airport obtained from the Government of Canada historical
where WS1, adjusted wind speed; and WS10, 10-min average             weather archive (Government of Canada 2021).
wind speed (km h1).                                                     Data analysis, including graphics and reported statistical tests,
    Spread events were spatially and temporally group into 29        was completed using the R software environment (R Core Team
lightning-caused and 25 human-caused spread event groups             2020), Python programming language (Python Software Foun-
(Fig. 3 boxes c and d). A 100-km radius centred on the ignition      dation (2021), and Cartopy Python Package (Met Office 2021).
points of lightning-caused wildfires, and a 50-km radius centred
on the human-caused wildfire ignition points were used to            Results
maximise the grouping of wildfires based on similar start dates
and location. The larger radius for lightning-caused wildfires       Wildfire cause, area burned and synoptic weather patterns
allowed for the inclusion of wildfires with the same start dates     Table 2 summarises the synoptic-scale weather patterns and
and orientation with a cold front passage. The use of spread day     associated pre-frontal, frontal passage and gust occurrences for
828 Int. J. Wildland Fire C. Tymstra et al.
(a) (b)
(c ) (d )
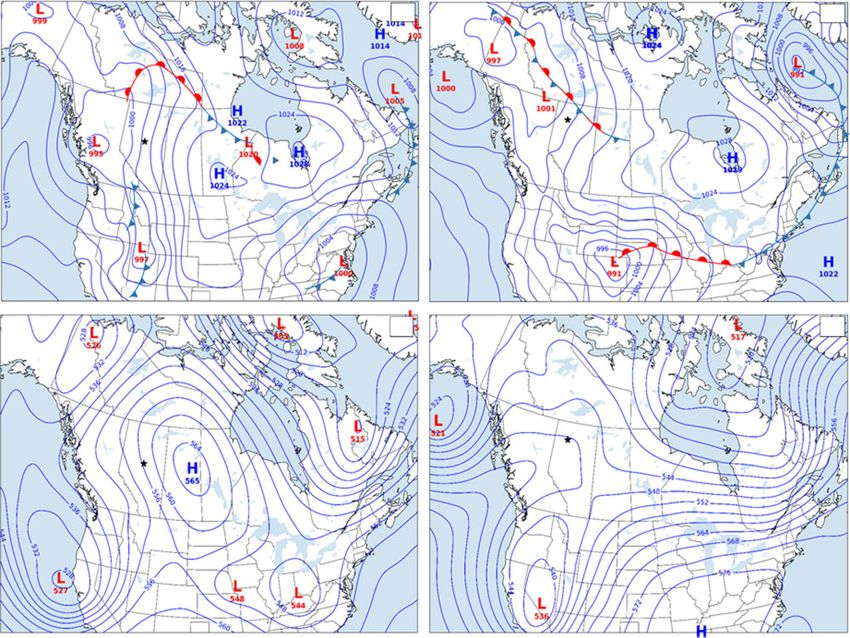
Fig. 4. Surface and 500-hPa analysis on 15 May 2011 (a, surface map; c, 500-hPa map), and 26 May 2012 (b, surface map; d, 500-hPa map). Surface
maps are 1800 Mountain Daylight Time (MDT) and 500-hPa maps are 0600 MDT. The black star represents the town of Slave Lake (maps a and c), and
Wildfire HF070–2012 (maps b and d). Wildfire SWF-065–2011 burned through Slave Lake on 15 May. Surface and 500-hPa maps are based on ERA5
model output. Fronts are delineated on the surface maps.
the 149 spread day events (79 lightning and 70 human-caused) flow over central and eastern Alberta. These surface patterns are
during the 1990–2019 period. The two most frequent weather supported by a 500-hPa ridge blocking moist Pacific air masses
patterns when wildfire spread days occurred are Pattern 1: sur- from entering Alberta. Little to no lightning occurs with synop-
face trough or low with an upper ridge or high (41%), and Pattern tic weather patterns 4a and 4c because of the characteristic stable
4: surface ridge or high with an upper ridge or high (36%), as atmospheric conditions. Human-caused wildfires are dominant
shown in Table 2. In comparison, of the spread days associated during these weather patterns.
with a surface ridge or high with an upper ridge or high, 67% A continental polar air mass centred west and south-west of
were due to lightning-caused wildfires. This is due to the higher Hudson Bay with south–south-east winds over central and
occurrence of frontal activity, which causes warm air ahead of eastern Alberta occurred on 10% of all days in May for the
the advancing cold front to rise and develop cumulus or 12 years during the 1990–2019 period when no large wildfires
cumulonimbus clouds and thunderstorms. In comparison, of the started in May (Fig. 5). The occurrence of this synoptic weather
spread days associated with a surface ridge or high, with an pattern increased to 19% during the other 18 years when large
upper ridge or high, 67% were due to human-caused wildfires. wildfires did start in May. During the 92 individual calendar
The 149 spread day events fall on 92 individual calendar days spread days, a Hudson Bay continental polar air mass with a
(i.e. with one or more wildfires). surface low positioned in or near south-west Alberta occurred on
Simplified surface and 500-hPa synoptic weather maps were ,26% of those days.
created for illustrative purposes using ERA5 model output. Representative examples of synoptic weather patterns 1a and
Representative examples of synoptic weather patterns 4a and 1c (Table 2) are shown in Fig. 6. These patterns are associated
4c (Table 2) are shown in Fig. 4. The merging of a cyclonic flow with cold front passages. On 2 May 2016, an upper ridge was
with an anti-cyclonic flow results in a south–south-east wind centred over Alberta. At the surface, a north–south-oriented coldLarge spring wildfires in Alberta, Canada Int. J. Wildland Fire 829
20
lightning
lightning-caused associated spread events is shown in Fig. 8.
human Human-caused wildfires have a higher frequency of 4 spread
days compared with lightning-caused wildfires, which have a
higher frequency of 2–3 spread days. There is, however, no
Number of wildfires > 1000 ha
15
significant difference in their distributions (K-S test not signifi-
cant at a ¼ 0.05).
Fire danger analysis
10 Table 3 summarises the median (e x), maximum (max) and
bootstrap 95% confidence interval (CI) for FFMC, ISI and
Buildup Index (BUI) by cause and period for the spread day
events. BUI is a numerical rating of the amount of fuel available
5 for consumption that provides an indication of the difficulty to
contain a wildfire. The distributions of FFMC, ISI and BUI for
all categories in Table 3 except Period 1 (1990–2004) and Period
2 (2005–2019) for human-caused wildfire spread day events
0 failed the Shapiro–Wilk normality test (a ¼ 0.05). Median
1990
1992
1994
1996
1998
2000
2002
2004
2006
2008
2010
2012
2014
2016
2018 values were therefore calculated and a bootstrap with replace-
ment used to estimate their 95% CI. If the confidence intervals
Year for the compared medians did not overlap, we concluded there
was a significant statistical difference between the medians of
Fig. 5. Annual number of lightning- and human-caused wildfires starting the two distributions (Table 3).
in May and exceeding 1000 ha in extinguished size for the 1990–2019
The median FFMC for all spread day events for the 1990–
period. The red and blue lines are locally weighted smoothing outputs.
2019 period is very high (91), as shown in Table 1. The
median ISI is also very high (16.8). The median BUI is in the
front positioned along the west coast of British Columbia began high category (48). Therefore, while the spread events are
tracking eastward on 3 May. The blocking upper ridge moved characterised by very high and extreme FFMC and ISI values,
east on 4 May, allowing the cold front entry into Alberta very high to extreme BUI is not a prerequisite for large spring
(Fig. 6a). At 1800 MDT, the cold front was positioned just west wildfires in Alberta. For example, in 2011, BUI values for the
of the Fort McMurray Urban Service Area. Strong south-west daily spread events ranged from 8 to 134. Snow patches were
winds ahead of the cold front pushed the 2016 Horse River still evident the day before Wildfire SWF-065–2011 burned
Wildfire into Fort McMurray. A similar synoptic weather through the town of Slave Lake. On 14 May, the nearby S2
pattern occurred on 17 May 2008 when a cold front passed over automatic weather station reported a BUI of 20 (low
wildfire PWF019–2008 (Fig. 6). category).
Pre-frontal and/or frontal passage activity occurred on 44 FFMC has narrower categorical ranges (e.g. Very High 89–
(48%) of 92 calendar spread days. In Alberta, these events are 91) compared with ISI and BUI, and is the only FWI not open-
often associated with the breakdown of a 500-hPa ridge and ended. FFMC ranges from 0 to 99 and has a maximum probable
increased threat of atmospheric conditions (strong winds and value of 96 (de Groot 1987). The maximum value observed for
atmospheric instability) conducive to extreme wildfire behav- all 212 spread day events was 96.4. FFMC values $94 were only
iour (Nimchuk 1983). observed in the second period (2005–2019).
In Alberta, wildfire starts in May accounted for 55% of the As well, these extreme FFMC values only occurred when the
total extinguished area of all wildfires during the wildfire season relative humidity (RH) was very low or extreme (n ¼ 24, x
(1 March–30 October) for the 1990–2019 period (Fig. 7). For the RH ¼ 21%). Significant increases in the mean median FFMC for
80 wildfires that exceeded 1000 ha in size, ,25% of their total lightning-, human- and all-caused wildfires occurred from
extinguished area occurred during the initial 4 days of wildfire Period 1 to Period 2. Median ISI increased from Period 1 to
growth. Period 2 for lightning-caused wildfires. Human-caused wild-
Humans and undetermined causes account for 91% of all fires had a higher median ISI (16.7) compared with lightning-
May wildfire starts (n ¼ 8838) that exceed 0.1 ha in extinguished caused wildfires for the entire period (1990–2019).
size. For wildfires greater than 1000 ha during the first decade Table 4 summarises the median (e x), maximum and bootstrap
(1990–1999), lightning was the dominant cause (88%). In the median CIs for FFMC, ISI and BUI by cause and period for the
second decade (2000–2009), human activity was the dominant non-spread day events (n ¼ 108) during the first 4 days. The
cause (75%). An approximate 50–50% was observed in the last median FFMC for all non-spread day events for the 1990–2019
decade, with 94% of the lightning-caused wildfires occurring in period is high (87). The difference compared with the very high
the last 5 years (2015–2019) (Fig. 5). The higher occurrence of FFMC (91) for the spread day events is statistically significant.
large lightning-caused wildfires (Fig. 3) is because these wild- The median ISI for the non-spread day events is moderate (4.4)
fires are often remote and hence less accessible. compared with the very high median ISI for the spread day
Approximately 58% and 42% of the spread events (n ¼ 212) events (13.7).
are associated with lightning- and human-caused wildfires The median BUI values for spread (47.5) and non-spread (45)
respectively. The frequency of 1-, 2-, 3- and 4-day human- and day events are not statistically different. However, the median830 Int. J. Wildland Fire C. Tymstra et al.
(a) (b)
(c ) (d )
Fig. 6. Surface and 500 hPa analysis on 4 May 2016 (a, surface map; c, 500-hPa map), and 17 May 2008 (b, surface map; d, 500-hPa map). Surface maps
are 1200 MDT (map a) and 1800 MDT (map b), and 500-hPa maps are 0600 MDT. The black star represents the Fort McMurray Urban Service Area
(maps a and c), and Wildfire PWF019–2008 (maps b and d). Surface and 500-hPa maps are based on ERA5 model output. Fronts are delineated on the
surface maps.
BUI value is statistically different between Periods 1 and 2 for Fort McMurray on 4 May, the forest was just starting to green
all causes and lightning-caused alone. up. Wildfire management staff also observed the same phenol-
ogy when Wildfire SWF-065–2011 entered the town of Slave
Discussion Lake on 15 May 2011.
May wildfire starts resulted in structural losses from wildfires in Air masses originating in northern Canada are dry in the
2001 (60 structures including 10 homes), 2011 (456 homes and spring because water bodies are frozen and there is little to no
23 non-residential building), 2016 (2400 homes and commercial plant photosynthesis, and hence minimal transpiration feeding
structures) and 2019 (16 homes). Spring is a potentially dan- moisture into the atmosphere. Photosynthetic capacity is inhib-
gerous wildfire season, in part because the live foliar moisture ited when temperatures drop below –78C (Sevanto et al. 2006).
content is at a minimum just before the emergence of new When fine fuels such as surface litter, leaves, mosses, needles
coniferous tree needles when non-structural carbohydrates and twigs (,1 cm diameter) reach moisture content levels of
stored in the roots are translocated to support needle growth #12% (FFMC $ 89), the ISI becomes very responsive to small
(Jolly et al. 2014). This seasonal change in foliar density and changes in the wind speed (Lawson and Armitage 2008).
hence relative foliar moisture content occurs before the surge in During our exploratory analysis of the weather data, we
photosynthetic spring recovery. noted the occurrence of days when our estimated ISI value
Referred to as the ‘spring dip’, this short phenomenon occurs using ERA5 weather outputs was less than 9 but significant
after snow melt, and before green-up. Hirsch (1996) showed wildfire growth was reported. Gusts occurred on these days.
dates of the minimum foliar moisture content (,85%) across Incorporating gusts to support wildfire preparedness and sup-
Canada as calculated by the Canadian Forest Fire Danger Rating pression planning is particularly challenging. Wildfire model-
System (CFFDRS). When Wildfire MWF-009–2016 ran into ling typically inputs the 10-min average wind speed of the lastLarge spring wildfires in Alberta, Canada Int. J. Wildland Fire 831
1000
Total annual area burned
Area burned from May wildfire starts
Number of May wildfire starts
Linear trend May wildfire starts
2004–2019
800
Area burned (x1000 ha)
Number of wildfires
600 600
400 400
200 200
0 0
1990
1992
1994
1996
1998
2000
2002
2004
2006
2008
2010
2012
2014
2016
2018
Year
Fig. 7. Area burned from May wildfire starts compared with total annual area burned and number
of May wildfires starts with a linear trend line for the 2004–2019 period (reporting procedure
changed in 2004, resulting in an increase in reported wildfires).
0.35 Since ISI responds non-linearly to wind speed, short periods
(e.g. 1-min average of samples taken every 0.25 s) of high wind
0.30
speed have more impact on wildfire behaviour than longer
averaged periods (e.g. standard 10-min average of 0.25 s
samples). Short periods of gusts can potentially generate fire-
0.25
brands and initiate crowning (Scott 2012).
We consider the approach described by Crosby and Chandler
0.20 (2004) and its use by wildfire behaviour analysts to predict
Density
wildfire behaviour (Scott 2012) as reasonable in the absence of
0.15 empirical data on the behaviour of gusts, and in particular, the
frequency and timing of these gusts. In Alberta, the reported gust
0.10
is the peak gust during the hour. Periods of gusts associated with
a frontal passage are typically of short duration whereas periods
of gusts associated with a pressure gradient force can be
0.05
sustained during the day and night.
We observed an underestimation of mean wind speeds of
0.00 0.8 m s1 (1 km h1) in the ERA5 reanalysis. This may have
1 2 3 4 1 2 3 4
caused a negative bias in ISI values and explains why the ISI $ 9
Lightning-caused Human-caused
threshold was not reached for some days. Jourdier (2020) and
Fig. 8. Distribution of 1-, 2-, 3- and 4-day spread events for human- and Tetzner et al. (2019) also reported an underestimation of ERA5
lightning-caused wildfires starting in May and exceeding 1000 ha in size. wind speeds.
Overall, a relatively small percentage of days in the spring are
wildfire spread event days in Alberta. Of the 92 calendar days
10 min before the hour. If the gust wind speed is used, the when spread events from one or more wildfires occurred, approxi-
modelled wildfire growth will likely be overpredicted. Like- mately one-quarter experienced strong south–south-east winds
wise, if the 10-min average wind speed is used and turbulence associated with continental polar air masses. However, cold fronts
and gusts occur, the modelled output will likely be under- are the predominant feature with approximately half of the calen-
predicted (Scott 2012). dar spread days having pre-frontal or frontal passage activity.832 Int. J. Wildland Fire C. Tymstra et al.
x), maximum (max) and bootstrap confidence intervals (CI) for FFMC, ISI and BUI by cause and period for the spread day events
Table 3. Median (e
The median FFMC, ISI and BUI denoted by paired superscript indicate significant differences between the medians
Spread day events n FFMC ISI BUI
e
x Max e
x Max e
x Max
0.95 CI 0.95 CI 0.95 CI
All (1990–2019) 212 91 96.4 13.7 68.4 47.5 132
90.0–91.0 12.5–15.2 43.5–51.5
All lightning-caused wildfires (1990–2019) 127 91 95 12.2d 30.3 49 132
90.0–91.0 11.0–13.5 42.0–53.0
All human-caused (1990–2019) 85 92 96.4 16.7d 68.4 46 102
90.7–92 14.6–22.0 38.0–46.0
Period 1 (1990–2004) All 104 90a 93 13.2 68.4 41f 92
88.1–90.0 11.2–15.1 35.0–45.0
Period 2 (2005–2019) All 108 92.3a 96.4 14.1 53.7 53f 132
91.9–93.0 12.5–15.8 48.0–58.5
Period 1 (1990–2004) lightning-caused 85 90b 93 12.7e 30.3 38g 83
89.0–90.0 10.8–14.3 33.0–42.0
Period 2 (2005–2019) lightning-caused 42 92b 95 17.8e 29 84g 132
90.7–92.0 14.3–25.95 67.0–92.0
Period 1 (1990–2004) human-caused 19 90c 93 16.6 68.4 53 92
87.0–90.0 9.6–25.7 35.0–58.0
Period 2 (2005–2019) human-caused 66 92c 96.4 17.8 53.7 46 102
90.7–92.0 14.4–25.6 29.0–49.0
x), maximum (max) and bootstrap and confidence intervals (CI) for FFMC, ISI and BUI by cause and period for the non-spread
Table 4. Median (e
day events
The median BUI denoted by paired superscript indicates significant differences between the medians
Non-spread day events n FFMC ISI BUI
e
x Max e
x Max e
x Max
0.95 CI 0.95 CI 0.95 CI
All (1990–2019) 108 87 93 4.4 26.1 45 134
82.6–87.0 3.7–5.0 41.0–50.5
All lightning-caused wildfires (1990–2019) 77 86 93 4.4 18.2 43 134
82.0–87.0 3.2–5.0 35.0–46.0
All human-caused (1990 –2019) 31 87 93 4.8 26.1 50 89
77.0–87.5 2.4–5.8 41.0–59.0
Period 1 (1990–2004) All 60 85 93 4.4 18.2 38.5a 89
79.5–87.0 3.0–5.0 34.0–43.0
Period 2 (2005–2019) All 48 87 93 4.6 26.1 57a 134
81.0–88.0 2.7–5.5 47.5–68.0
Period 1 (1990–2004) lightning-caused 47 83 93 4.4 18.2 35b 74
78.0–87.0 3.1–5.1 30.9–38.0
Period 2 (2005–2019) lightning-caused 30 87 93 4.3 8.6 68.5b 134
81.0–89.0 2.1–5.5 52.0–80.0
Period 1 (1990–2004) human-caused 13 87 90 4.4 8.2 66 89
77.0–87.5 1.7–5.1 39.0–69.0
Period 2 (2005–2019) human-caused 18 87.5 93 5.0 26.1 47.5 82
78.0–89.0 1.8–6.5 37.0–56.0
While the synoptic weather patterns associated with strong winds persisted all day and night, which desiccated vegetation
south–south-east winds were less frequent than the cold front and contributed to the extreme wildfire behaviour (McLean and
synoptic weather pattern, they resulted in unique challenges, Coulcher 1968). Fire behaviour analysts need to understand and
including night-time burning and the inability to conduct aerial account for the cumulative impact of sustained strong, dry winds
suppression operations due to the very high to extreme winds. because live fuel moisture other than conifer foliar moisture is
During the 18–25 May period in 1968, strong, dry south-easterly not directly accounted for in the FWI. As well, the daily FWILarge spring wildfires in Alberta, Canada Int. J. Wildland Fire 833
outputs use a standard daylength and diurnal curves for temper- Spring wildfires with very high BUI values require more
ature, relative humidity and wind speed. These curves assume suppression effort to contain them because larger-diameter dead
there is a night-time recovery period. and downed fuels and deeper organic fuels are available for
Strong, desiccating winds can also dry fuels before a wildfire combustion. High average BUI values were observed in 2019, and
starts. In 2011, 3 days of dry south-east winds occurred on 7–9 very high BUI values in 2015 and 2018 during May. Very high to
May, and again, but more strongly on 11–13 May, before the extreme BUI, however, is not a prerequisite for extreme wildfire
wildfire outbreak on 14 May when Wildfire SWF-65–2011 ran behaviour. The common drivers for extreme wildfire behaviour in
into the town of Slave Lake. In 2015, strong, dry south-east the spring are very high to extreme FFMC and ISI. Because spring
winds occurred 11–19 May 2015 before the wildfire outbreak wildfires in Alberta are wind-driven, extreme wildfire behaviour
started on 22 May. can occur quickly and become very challenging to manage.
In the CFFDRS, the Drought Code (DC) provides an indica- We observed a significant increase in ISI from Period 1 to
tion of the moisture content of deep organic layers, and the Period 2 for lightning wildfires, due in part to higher FFMC
difficulty of extinguishing a wildfire. DC is an input to BUI. Our values in Period 2. BUI also increased from Period 1 to Period 2
analysis suggests drought is not a prerequisite for extreme for lightning wildfires, suggesting a drier boreal forest in the
wildfire behaviour during the spring season in Alberta. Very future will result in more lightning starts. The increasing trend in
high (61–89) or extreme BUI ($90) occurred on 30% (64) of the large lightning-caused wildfires in Alberta’s boreal forest during
212 spread day events. Our results indicate that spring wildfires the 2015–2019 period may be linked to climate change. Our
in Alberta are primarily ISI driven. results provide a foundation for future work to help understand
Although outside the scope of our study, a more thorough climate change impacts on wildfire activity. This includes
investigation of our dataset is required to assess whether changes in spring oceanic–atmospheric patterns (El Niño South-
atmospheric stability and occurrence of low-level jets were ern Oscillation and Pacific Decadal Oscillation) that impact
contributing factors to extreme wildfire behaviour. The position temperature, lightning occurrence and lightning wildfire arrivals.
of the polar jet stream relative to the location of wildfires is also Research is also required on wind extremes and the variabil-
an area of further study since the jet stream influences synoptic ity in wind speeds associated with gusts. New approaches to
weather patterns. adjust wind speeds when gusts are forecast are needed to support
wildfire operations. Prediction of wind events was identified as a
key research area (Flat Top Complex Wildfire Review Commit-
Conclusion tee 2012).
The small percentage of wildfire spread days in the spring is Understanding the relationship between weather patterns at
associated with critical synoptic weather patterns. The pre- the surface and aloft, and the observed wildfire behaviour is
dominant surface weather feature contributing to extreme critical for preparedness and the ability to make 5-day and
wildfire behaviour on these spread days is the cold front passage longer forecasts of the wildfire environment. Wildfire behaviour
(48%). Strong south–south-east winds resulting from a surface analysts need a better understanding of the synoptic weather
high or ridge positioned west of Hudson Bay occurred on 26% of patterns responsible for extreme wildfire behaviour. This, how-
the wildfire spread days. ever, requires stronger linkages and integration between fire
Human-caused wildfires in the spring cause the greatest weather forecasters and fire behaviour analysts.
structural losses. Wildfire management agencies have a suite of Our results suggest wildfires will continue to escape sup-
prevention tools to help reduce the risk of these wildfires. Fire pression efforts to contain them as they become larger and more
bans and restrictions, forest area closures and off-highway vehi- intense owing to climate variability and change. Albertans
cle restrictions can be effective, but they need to be strategically therefore need to prepare and learn to live and work in a
applied and removed quickly. In Canada, a program called landscape with more wildfire.
FireSmart promotes a shared responsibility to build wildfire-
resilient communities. The seven disciplines of this program Data availability
(education, vegetation management, emergency planning, legis-
Alberta historical wildfire report data are available publicly at
lation, development, interagency cooperation and cross-training)
https://wildfire.alberta.ca/resources/default.aspx. Weather and
contribute to both mitigation and prevention of wildfire. Unfor-
Canadian FWI System indices from the Alberta Forestry Divi-
tunately, FireSmart practices across Canada are underutilised to
sion weather station network are available via request to the
help mitigate structure losses from spring wildfires.
WMB in Edmonton, Alberta at WF.AWCC-Weather@gov.ab.
Canada’s Changing Climate Report (Government of Canada
ca. The ERA5 high-resolution reanalysis of the Canadian FWI
2019) states warming in Canada will on average continue at
System indices are available at https://doi.org/10.5281/
more than twice the average global warming rate. Managing
zenodo.3626193 (McElhinny et al. 2020). Archived North
spring wildfires to protect multiple and competing values at risk
America surface and 500-hPa synoptic weather maps are
is becoming more challenging because of climate change
available from the NOAA.
impacts including extended wildfire seasons (Jolly et al. 2015;
Jain et al. 2017), increased extreme fire weather (Flannigan et al.
Conflicts of interest
2016; Wang et al. 2016), increased area burned (Flannigan et al.
2005; Hanes et al. 2019), increased wildfire occurrence (Wotton Mike Flannigan is an Associate Editor of International Journal
et al. 2010) and reduced suppression capability (Podur and of Wildland Fire but was blinded from the peer-review process
Wotton 2010; Wotton et al. 2017). for this paper.834 Int. J. Wildland Fire C. Tymstra et al.
Declaration of funding Government of Canada (2019) Canada’s changing climate report. Environ-
ment and Climate Change Canada Report. (Eds E Bush, DS Lemmen)
This research did not receive any specific funding.
(Ottawa, ON, Canada) Available at https://changingclimate.ca/CCCR
2019
Acknowledgements Government of Canada (2021) Historical data. Environment and Climate
Change (Ottawa, ON, Canada) Available at https://climate.weather.gc.
We thank Alberta Agriculture and Forestry Wildfire Management Branch
for providing wildfire report and weather data. We also thank the two ca/historical_data/search_historic_data_e.html
anonymous reviewers for their constructive comments. Hanes CC, Wang X, Jain P, Parisien M-A, Little JM, Flannigan MD (2019)
Fire-regime changes in Canada over the last half century. Canadian
Journal of Forest Research 49, 256–269. doi:10.1139/CJFR-2018-0293
References Hirsch K (1996) Canadian Forest Fire Behaviour Prediction (FBP) System:
Beaubien E, Hamann A (2011) Spring flowering response to climate change user’s guide. Natural Resources Canada, Canadian Forest Service
between 1936 and 2006 in Alberta, Canada. Bioscience 61, 514–524. Special Report 7. (Edmonton, AB, Canada)
doi:10.1525/BIO.2011.61.7.6 Jain P, Wang X, Flannigan MD (2017) Trend analysis of fire season length
Brotak EA, Reifsnyder WE (1977) An investigation of the synoptic and extreme fire weather in North America between 1979 and 2015.
situations associated with major wildland fires. Journal of Applied International Journal of Wildland Fire 26, 1009–1020. doi:10.1071/
Meteorology 16, 867–870. doi:10.1175/1520-0450(1977)016,0867: WF17008
AIOTSS.2.0.CO;2 Jolly WM, Hadlow AM, Huguet K (2014) De-coupling seasonal changes in
Byram GM (1954) Atmospheric conditions related to blowup fires. USDA water content and dry matter to predict live conifer foliar moisture
Forest Service, Southeastern Forest Experiment Station, Paper No. 35. content. International Journal of Wildland Fire 23, 480–489.
(Asheville, NC, USA). doi:10.1071/WF13127
Coogan SCP, Robinne F-N, Jain P, Flannigan MD (2019) Scientists’ Jolly WM, Cochrane MA, Freeborn PH, Holden ZA, Brown TJ, William-
warning on wildfire – a Canadian perspective. Canadian Journal of son GJ, Bowman DMJS (2015) Climate-induced variations in global
Forest Research 49, 1015–1023. doi:10.1139/CJFR-2019-0094 wildfire danger from 1979 to 2013. Nature Communications 6, 7537.
Crimmins M (2006) Synoptic climatology of extreme fire weather condi- doi:10.1038/NCOMMS8537
tions across the southwest United States. International Journal of Jourdier B (2020) Evaluation of ERA5, MERRA-2, COSMO-REA6,
Climatology 26, 1001–1016. doi:10.1002/JOC.1300 NEWA and AROME to simulate wind power production over France.
Crosby JS, Chandler CC (2004) Get the most from your windspeed Advances in Science and Research 17, 63–77. doi:10.5194/ASR-17-63-
observation. Fire Management Today 64, 53–55. 2020
Cumming SG (2001) Forest type and wildfire in the Alberta boreal mixed- Kiil AD, Grigel JE (1969) The May 1968 conflagrations in central Alberta: A
wood: What do fires burn? Ecological Applications 11, 97–110. review of fire weather, fuels and fire behavior. Forestry Branch, Forest
doi:10.1890/1051-0761(2001)011[0097:FTAWIT]2.0.CO;2 Research Laboratory Information Report A-X-24. (Edmonton, AB,
de Groot WJ (1987) Interpreting the Canadian Forest Fire Weather Index Canada)
(FWI) System. In ‘Proceedings: Fourth Central Regional Fire Weather Kirchmeier-Young MC, Zwiers FW, Gillett NP, Cannon AJ (2017)
Committee Scientific and Technical Seminar’, 2 April 1987, Winnipeg, Attributing extreme fire risk in western Canada to human emissions.
Manitoba. (Ed KG Hirsch) pp. 3–14. Canadian Forestry Service, Climatic Change 144, 365–379. doi:10.1007/S10584-017-2030-0
Northern Forestry Centre. (Edmonton, AB, Canada) Krawchuk MA, Cumming SG, Flannigan MD, Wein RW (2006) Biotic and
Duane A, Brotons L (2018) Synoptic weather conditions and changing fire abiotic regulation of lightning fire initiation in the mixedwood boreal
regimes in a Mediterranean environment. Agricultural and Forest forest. Ecology 87, 458–468. doi:10.1890/05-1021
Meteorology 253–254, 190–202. doi:10.1016/J.AGRFORMET.2018. Lagerquist R, Flannigan MD, Wang X, Marshall GA (2017) Automated
02.014 prediction of extreme fire weather from synoptic patterns in Northern
Flannigan MD, Harrington JB (1988) A study of the relation of meteoro- Alberta, Canada. Canadian Journal of Forest Research 47, 1175–1183.
logical variables to monthly provincial area burned by wildfire in doi:10.1139/CJFR-2017-0063
Canada (1953–80). Journal of Applied Meteorology 27, 441–452. Lawson BD, Armitage OB (2008) Weather guide for the Canadian Forest
doi:10.1175/1520-0450(1988)027,0441:ASOTRO.2.0.CO;2 Fire Danger Rating System. Natural Resources Canada, Canadian Forest
Flannigan MD, Logan KA, Amiro BD, Skinner WR, Stocks BJ (2005) Service, Northern Forestry Centre Report. (Edmonton, AB, Canada).
Future area burned in Canada. Climatic Change 72, 1–16. doi:10.1007/ McElhinny M, Beckers JF, Hanes C, Flannigan M, Jain P (2020) A high-
S10584-005-5935-Y resolution reanalysis of global fire weather from 1979 to 2018 – over-
Flannigan M, Stocks B, Turetsky M, Wotton W (2009) Impacts of climate wintering the Drought Code. Earth System Science Data 12, 1823–1833.
change on fire activity and fire management in the circumboreal forest. doi:10.5194/ESSD-12-1823-2020
Global Change Biology 15, 549–560. doi:10.1111/J.1365-2486.2008. McLean J, Coulcher B (1968) Seven days in May: Meteorological factors
01660.X associated with Alberta forest fires of May 18–25, 1968. Alberta Energy
Flannigan MD, Wotton BM, Marshall GA, de Groot WJ, Johnston J, Jurko and Natural Resources, Forest Service Report. (Edmonton, AB, Canada)
N (2016) Fuel moisture sensitivity to temperature and precipitation: Mesinger F, Dimego G, Kalnay E, Mitchell K, Shafran P, Ebisuzaki W,
climate change implications. Climatic Change 134, 59–71. doi:10.1007/ Jović D, Woollen J, Rogers E, Berbery E, Ek M, Fan Y, Grumbine R,
S10584-015-1521-0 Higgins W, Li H, Lin Y, Manikin G, Parrish D, Wei S (2006) North
Flat Top Complex Wildfire Review Committee (2012) 2011 Flat Top American regional reanalysis. Bulletin of the American Meteorological
Complex Wildfire Review in Alberta. Final report submitted to the Society 87, 343–360. doi:10.1175/BAMS-87-3-343
Minister of Environment and Sustainable Resource Development, May Met Office (2021) Cartopy: A cartographic python library with a matplotlib
2012. Available at https://open.alberta.ca/publications/9781460102732 interface (v0.18.0). Available at https://scitools.org.uk/cartopy (Exter,
[Verified 8 February 2013] Devon, UK)
Ganteaume A, Jappiot M (2013) What causes large fires in Southern France. National Oceanic and Atmospheric Administration (2021a) Surface analysis
Forest Ecology and Management 294, 76–85. doi:10.1016/J.FORECO. archive. Available at https://www.wpc.ncep.noaa.gov/archives/web_-
2012.06.055 pages/sfc/sfc-zoom.html. [Verified 30 June 2021]Large spring wildfires in Alberta, Canada Int. J. Wildland Fire 835
National Oceanic and Atmospheric Administration (2021b) Central library Scott JH (2012) Introduction to Wildfire Behavior Modeling. National Inter-
weather and climate collections. Available at https://library.noaa.gov/ agency Fuels, Fire, and Vegetation Technology Transfer, USDA Forest
Collections/Digital-Collections/US-Daily-Weather-Maps. [Verified 30 Service, Rocky Mountain Research Station. (Fort Collins, CO, USA).
June 30 2021] Sevanto S, Suni T, Pumpanen J, Gronholm T, Kolari P, Nikinmaa E, Hari
National Oceanic and Atmospheric Administration (2021c) Surface analysis P, Vesala T (2006) Wintertime photosynthesis and water uptake in a
archive. Available at https://www.wpc.ncep.noaa.gov/archives/web_- boreal forest. Tree Physiology 26, 749–757. doi:10.1093/TREEPHYS/
pages/sfc/sfc_archive.php. [Verified 30 June 2021] 26.6.749
National Oceanic and Atmospheric Administration (2021d) Daily weather Skinner WR, Flannigan MD, Stocks BJ, Martell DL, Wotton BM, Todd
map. Available at https://www.wpc.ncep.noaa.gov/dailywxmap/index. JB, Mason JA, Logan KA, Bosch EM (2002) A 500 Mb synoptic
html. [Verified 30 June 2021] wildland fire climatology from large Canadian forest fires, 1959–1996.
Nimchuk N (1983) Wildfire behavior associated with upper ridge break- Theoretical and Applied Climatology 71, 157–169. doi:10.1007/
down. Alberta Energy and Natural Resources, Forest Service Report No. S007040200002
T/50. (Edmonton, AB, Canada) Tetzner D, Thomas E, Allen C (2019) A validation of ERA5 reanalysis data
Parente J, Pereira MG, Tonini M (2016) Space–time clustering analysis of in the southern Antarctic Peninsula – Ellsworth Land Region, and its
wildfires: The influence of dataset characteristics, fire prevention policy implications for ice core studies. Geosciences 9, 289. doi:10.3390/
decisions, weather and climate. The Science of the Total Environment GEOSCIENCES9070289
559, 151–165. doi:10.1016/J.SCITOTENV.2016.03.129 Trouet V, Taylor AH, Carleton AM, Skinner CN (2009) Interannual
Parisien M-A, Walker GR, Little JM, Simpson BN, Wang X, Perrakis variations in fire weather, fire extent, and synoptic-scale circulation
DDB (2013) Considerations for modeling burn probability across land- patterns in northern California and Oregon. Theoretical and Applied
scapes with steep environmental gradients: an example from the Colum- Climatology 95, 349–360. doi:10.1007/S00704-008-0012-X
bia Mountains, Canada. Natural Hazards 66, 439–462. doi:10.1007/ Tymstra C (2015) ‘The Chinchaga Firestorm: When the moon and sun
S11069-012-0495-8 turned blue.’ (University of Alberta Press: Edmonton, AB, Canada)
Parks SA, Holsinger LM, Panunto MH, Jolly WM, Dobrowski SZ, Dillon Tymstra C, Woolford DG, Flannigan MD (2019) Statistical surveillance
GK (2018) High-severity fire: evaluating its key drivers and mapping its thresholds for enhanced situational awareness of spring wildland fire
probability across western US forests. Environmental Research Letters activity in Alberta, Canada. Journal of Environmental Statistics 9(4),
13, 044037. doi:10.1088/1748-9326/AAB791 http://www.jenvstat.org/v09/i04/paper.
Pereira MG, Trigo RM, Camara CD, Pereira JMC (2005) Synoptic patterns Tymstra C, Stocks BJ, Cai X, Flannigan MD (2020) Wildfire management
associated with large summer forest fires in Portugal. Agricultural in Canada: Review, challenges and opportunities. Progress in Disaster
and Forest Meteorology 129, 11–25. doi:10.1016/J.AGRFORMET. Science 5, 100045. doi:10.1016/J.PDISAS.2019.100045
2004.12.007 Van Wagner CE (1987) Development and structure of the Canadian Forest
Pickell PD, Coops NC, Ferster CJ, Bater CW, Blouin KD, Flannigan MD Fire Weather Index System. Government of Canada, Canadian Forest
(2017) An early warning system to forecast the close of the spring Service, Forestry Technical Report. (Ottawa, ON, Canada)
burning window from satellite-observed greenness. Scientific Reports Verdú F, Salas J, Vega-Garcia C (2012) A multivariate analysis of
7, 14190. doi:10.1038/S41598-017-14730-0 biophysical factors and forest fires in Spain, 1991–2005. International
Podur J, Wotton BM (2010) Will climate change overwhelm fire manage- Journal of Wildland Fire 21, 498–509. doi:10.1071/WF11100
ment capacity? Ecological Modelling 221, 1301–1309. doi:10.1016/J. Viedma O, Quesada J, Torres I, De Santis A, Moreno JM (2015) Fire
ECOLMODEL.2010.01.013 severity in a large fire in a Pinus pinaster forest is highly predictable
Podur J, Wotton BM (2011) Defining fire spread event days for fire-growth from burning conditions, stand structure, and topography. Ecosystems
modelling. International Journal of Wildland Fire 20, 497–507. 18, 237–250. doi:10.1007/S10021-014-9824-Y
doi:10.1071/WF09001 Wang X, Parisien M-A, Taylor SW, Perrakis DDB, Little J, Flannigan MD
Python Software Foundation (2021) Python Language Reference, version (2016) Future burn probability in south-central British Columbia.
3.8.10. Available at https://www.python.org International Journal of Wildland Fire 25, 200–212. doi:10.1071/
R Core Team (2020) R: A language and environment for statistical WF15091
computing. R Foundation for Statistical Computing. (Vienna, Austria) Wiken EB (1986) Terrestrial Ecozones of Canada. Ecological Land Classi-
Ruffault J, Moron V, Trigo RM, Curt T (2017) Daily synoptic conditions fication, Series No. 19. Environment Canada. (Hull, Quebec, Canada)
associated with large fire occurrence in Mediterranean France: evidence Wotton BM, Nock CA, Flannigan MD (2010) Forest fire occurrence and
for a wind-driven fire regime. International Journal of Climatology climate change in Canada. International Journal of Wildland Fire
37, 524–533. doi:10.1002/JOC.4680 19, 253–271. doi:10.1071/WF09002
Schaefer VJ (1957) The relationship of jet streams to forest wildfires. Wotton BM, Flannigan MD, Marshall GA (2017) Potential climate change
Journal of Forestry 55, 419–425. impacts on fire intensity and key wildfire suppression thresholds in
Schroeder MJ, Glovinsky M, Hendricks VF, Hood FC, Hull MK, Jacobson Canada. Environmental Research Letters 12, 095003. doi:10.1088/
HL, Kirkpatrick R, Krueger DW, Mallory LP, Oertel AG, Reese RH, 1748-9326/AA7E6E
Sergius LA, Syverson CE et al. (1964) Synoptic weather types associ- Zhong S, Yu L, Heilman WE, Bian X, Fromm H (2020) Synoptic weather
ated with critical fire weather. USDA Forest Service, Pacific Southwest patterns for large wildfires in the northwestern United States – a climato-
Forest and Range Experiment Station Report prepared for Office Civil logical analysis using three classification methods. Theoretical and
Defense. (Berkeley, CA, USA) Applied Climatology 141, 1057–1073. doi:10.1007/S00704-020-03235-Y
www.publish.csiro.au/journals/ijwfYou can also read