Characterization of genetic determinants of the resistance to phylloxera, Daktulosphaira vitifoliae, and the dagger nematode Xiphinema index from ...
←
→
Page content transcription
If your browser does not render page correctly, please read the page content below
Preprint: Please note that this article has not completed peer review.

Characterization of genetic determinants of the
resistance to phylloxera, Daktulosphaira vitifoliae,
and the dagger nematode Xiphinema index from
muscadine background
CURRENT STATUS:                ACCEPTED

Bernadette Rubio
INRA

Guillaume Lalanne-Tisné
INRA

Roger Voisin
INRA

Jean-Pascal Tandonnet
INRA

Ulysse Portier
INRA

Cyril Van Ghelder
INRA

Maria Lafargue
INRA

Jean-Pierre Petit
INRA

Martine Donnart
INRA

Benjamin Joubard
INRA

Pierre-Francois Bert
Universite de Bordeaux

                                               1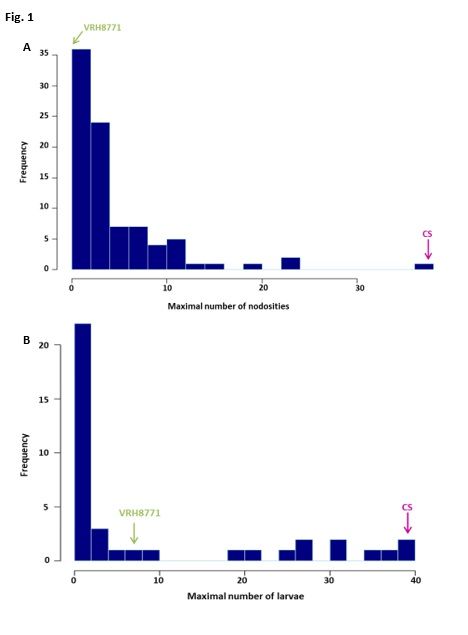
ORCiD: https://orcid.org/0000-0003-3209-952X

Daciana Papura
INRA

Loïc Le Cunff
IFV

Nathalie Ollat

 nathalie.ollat@inra.frCorresponding Author
ORCiD: https://orcid.org/0000-0002-6182-9686

Daniel Esmenjaud
INRA

DOI:
  10.21203/rs.2.15851/v2
SUBJECT AREAS
 Plant Molecular Biology and Genetics
KEYWORDS
 ,

                                               2
Abstract
Background: Muscadine (Muscadinia rotundifolia) is known as a resistance source to many pests and
diseases in grapevine. The genetics of its resistance to two major grapevine pests, the phylloxera D.
vitifoliae and the dagger nematode X. index, vector of the Grapevine fanleaf virus (GFLV) was
investigated in a backcross progeny between the F1 resistant hybrid material VRH8771 (Muscadinia-
Vitis) derived from the muscadine R source ‘NC184-4’ and V. vinifera cv. ‘Cabernet-Sauvignon’ (CS).
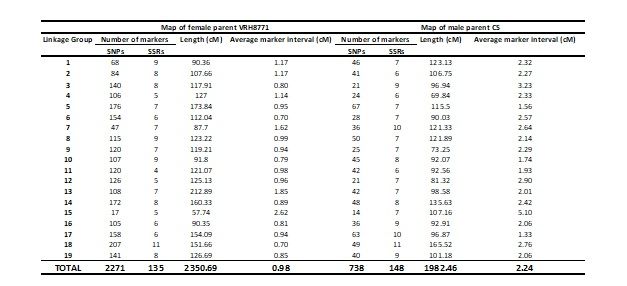
Results: In this pseudo-testcross, parental maps were constructed using simple-sequence repeats
markers and single nucleotide polymorphism markers from a GBS approach. For the VRH8771 map,
2271 SNP and 135 SSR markers were assembled, resulting in 19 linkage groups (LG) and an average
distance between markers of 0.98 cM. Phylloxera resistance was assessed by monitoring root
nodosity number in an in planta experiment and larval development in a root in vitro assay.
Nematode resistance was studied using 10-12 month long tests for the selection of durable resistance
and rating criteria based on nematode reproduction factor and gall index. A major QTL for phylloxera
larval development, explaining more than 70% of the total variance and co-localizing with a QTL for
nodosity number, was identified on LG 7. Additional QTLs were detected on LG 3 and LG 10,
depending on the in planta or in vitro experiments, suggesting that various loci may influence or
modulate nodosity formation and larval development. Using a Bulk Segregant Analysis approach and
a proportion test, markers clustered in three regions on LG 9, LG 10 and LG 18 were shown to be
associated to the nematode resistant phenotype. QTL analysis confirmed the results, although a LOD-
score below the significant threshold value was obtained for the QTL on LG 18.
Conclusions: Based on a high-resolution linkage map and a segregating grapevine backcross
progeny, the first QTLs for resistance to Daktulosphaira vitifoliae and to Xiphinema index were
identified from a muscadine source. All together these results open the way to the development of
marker-assisted selection in grapevine rootstock breeding programs based on muscadine derived
resistance to phylloxera and to X. index in order to delay GFLV transmission.
Background
Domesticated grapevine, Vitis vinifera sub-sp. vinifera (This et al. 2006), is grown grafted in most
3countries worldwide. Grafting has been successfully used to cope mainly with phylloxera
(Daktulosphaira vitifoliae), an insect-pest that destroyed the European vineyard after its introduction
from North America in the middle of the 19th century (Pouget, 1990; Thiery & Vogelweith, 2016) and
participate to the control of other soil-borne pests and adaptation to abiotic stresses.
In addition to Europe, grapevine phylloxera spread quickly to most wine grape growing regions of the
world including South Africa, Middle East, Asia and Australia (Powell 2012). This insect has two
different forms, the radicicoles and the gallicoles, which affect roots and leaves, respectively.
Radicicoles are the most destructive in V. vinifera due to severe root damage, while gallicole forms
are more common in most other species without lethal effects for the plants. Root feeding induces the
formation of galls called nodosities (Powell 2012; Smith et al. 2018). Phylloxera root infection causes
vine decline and finally plant death, partly explained by secondary fungal infections (Pouget 1990).
The use of resistant rootstocks from Vitis species other than V. vinifera is advocated as the main
method of radicicole phylloxera management and may be considered as the most sustainable
example of biological control for a pest ever used (Powell 2008). Several sources of grape phylloxera
resistance for rootstock breeding have been identified. Heritability studies have shown that a variable
number of loci control the resistance trait (Davidis and Olmo 1964; Boubals 1966; Bouquet 1983;
Roush et al. 2007; Ramming 2010). The first genetic mapping of a QTL for phylloxera resistance
identified the RDV1 (RESISTANCE DAKTULOSPHAIRA VITIFOLIAE 1) locus on chromosome 13 in the
Börner (V. riparia x V. cinerea) rootstock (Zhang et al. 2009). The RESISTANCE DAKTULOSPHAIRA
VITIFOLIAE 2 (RDV2) locus was mapped to chromosome 14 in V. cinerea cv. ‘C2-50’ (Smith et al.
2018). A leaf-specific phylloxera resistance locus overlapped the location of RDV2 on LG 14 in a F1
family from a cross containing at least six Vitis species in the ancestry (V. vinifera, V. riparia, V.
rupestris, V. labrusca, V. aestivalis and V. berlandieri). In contrast, from the same plant material, a
locus for resistance to the root form of phylloxera mapped to chromosomes 5 and 10 (Clark et al.
2018).
In addition to phylloxera, rootstocks may contribute to the control of other soil-borne pests such as
root-knot and dagger nematodes. Resistance to the dagger nematode Xiphinema index is an
4important objective in grape rootstock breeding programs. X. index is a migratory ectoparasite that
primarily feeds on the root tips of grapevines and causes severe damage to their root system. More
significantly, X. index is recognized as the vector of Grapevine fanleaf virus (GFLV), the causal agent
of the fanleaf degeneration disease which is considered to be one of the major threats to the
grapevine industry (Hewitt et al. 1958; Andret-Link et al. 2004). X. index can survive in soils of ancient
vineyards and retain GFLV for many years without the presence of host plant (Demangeat et al.
2005). Nematicides and fumigants failed to control the dagger nematode because of their poor
penetration in deep soil layers where X. index mainly survives (Esmenjaud et al. 1992; Villate et al.
2008) and their use is now banned in most countries because of their high toxicity. In order to
overcome these limitations, using nematode-resistant grapevine rootstocks appears as one of the
most promising control method to significantly delay viral transmission. The highest level of
resistance to X. index was found in V. arizonica, V. candicans, V. rufotomentosa, V. smalliana and V.
solonis (Esmenjaud and Bouquet, 2009; Ollat et al. 2016). Resistance in V. arizonica is controlled by a
single major locus, XIPHINEMA INDEX RESISTANCE 1 (XiR1) located on chromosome 19 (Xu et al.
2008; Riaz et al. 2012).
In the next decades, grape growing will have to face several challenges, such as climate change,
decrease in pesticides application, water availability and competition for arable lands with food crops.
In this context, it is important to consider the rootstock as a key component of adaptation and
consequently, breeding new rootstocks is urgently needed. Rootstock breeding programs conducted
throughout the world share similar goals, such as resistance to phylloxera and nematodes (dagger
and root-knot nematodes), vigour management, mineral uptake efficiency, together with drought,
salinity and limestone tolerances (Töpfer et al. 2011; Ollat et al. 2016). The world’s existing
rootstocks have a very narrow genetic base derived from only a few American grape species
accessions (Riaz et al, 2019). Despite the diversity available among the genus Vitis, only 4 to 5
species are commonly used in crosses, i.e. V.berlandieri, V. riparia, V. rupestris, V. champini and V.
vinifera. Muscadinia rotundifolia, the muscadine vine, was also considered as a highly interesting
species for rootstock improvement because of its resistance to many pests and diseases (Bouquet
51983). Thus, hybrids between this American species and V. vinifera were created in order to be used
as rootstocks (Walker et al. 1994) or as parents or elite materials for further crosses (Bouquet 1980).
However, muscadines present major defaults such as poor rooting, and grafting incompatibility or
mineral deficiencies, advanced crosses are necessary to breed highly performing rootstocks.
Grapevine breeding takes generally decades to release an advanced cultivar. Considering the
difficulty to screen for most traits of interest in rootstocks, the development of molecular-assisted
selection is a priority. This relies on the identification of one or few loci closely associated to the trait
expression and explaining a high percentage of phenotypic variance. As previously mentioned, only
four loci have been identified so far in response to phylloxera in various Vitis species and a single one
in response to X. index. Therefore it is crucial to improve our knowledge about the resistance
response of Vitis and Muscadinia spp. resources to major grapevine pests and to analyse their genetic
determinism. Recent progress in the development and application of molecular markers, genetic
mapping and whole genome sequencing combined with high throughput technologies will help to
better characterize the genetic bases of the traits of interest (Varshney et al. 2009). For grapevine,
the development and application of SSR (Simple Sequence Repeat) markers are considered as a key
step of the construction of molecular maps (Doligez et al. 2006; Troggio et al. 2007; Riaz et al. 2012).
Next-generation sequencing (NGS) has then facilitated the development of methods to genotype very
large numbers of SNP (Single Nucleotide Polymorphisms) markers (Ray and Satya 2014; Vlk and
Řepková 2017). Genotyping-by-sequencing (GBS) has been developed as a rapid and robust approach
to sequencing of multiplexed samples (Elshire et al. 2011; Poland and Rife 2012). The work by Barba
and collaborators (2014) demonstrated the first application of the GBS procedure in generating SNPs
to construct a high resolution map for QTL mapping in grapevine.
In order to identify additional sources of resistance to the phylloxera and to the dagger nematode, a
backcross 1 (BC1) population from the cross between a muscadine hybrid (VRH8771 = V. vinifera x M.
rotundifolia) and V. vinifera cv. ‘Cabernet-Sauvignon’ has been characterized in this study. Through
this cross, one seeks to expand the existing knowledge about the genetic determinism of M.
rotundifolia natural resistances towards the pathogens and pests. The main objectives of our study
6were i) to build SSR and SNP-based linkage maps using pseudo-testcross strategy and ii) to exploit
them for QTL mapping of the genetic bases of the resistance responses to these major grapevine
pests. These goals are the first steps toward the development of marker-assisted breeding for
resistance to phylloxera and X. index.
Results
Genotyping: sequencing, SNP calling and SNP selection
A total of 84 million cleaned reads were obtained, and the number of reads per sample ranged from
36,000 to 9.5 million, with an average of 3.05 million. This number of reads was equivalent to ~0.91-
fold coverage of other Vitis genomes which are estimated to have a size of approximately 500 Mb.
The SNP calling performed with GATK pipeline and VCFtools produced a total of 324,183 SNPs among
which 52,625 have been identified as pseudotestcross markers. By excluding sites based on missing
data or segregation distortion, two sets of 2,285 and 738 SNPs were obtained for the female
(VRH8771) and the male (CS) maps, respectively. These sets were complemented by 135 and 148
SSRs genotyped on 90 BC1 individuals for the construction of the female and male maps,
respectively. Because of the missing data threshold per individual and the genotype frequencies
expected, the final dataset included 92 BC1 individuals. In the end, 75 BC1 individuals were
genotyped with both SSRs and SNPs markers, 19 BC1 individuals with SNPs markers only and 17 BC1
individuals with SSRs markers only (Table S1).
High density maternal and paternal genetic maps
Maternal (VRH8771) and paternal (CS) maps were constructed using 2420 and 886 sets of markers
(SSR and SNP markers), respectively (Fig. S1 and Fig S2). For each set of markers, 19 LGs were
produced and the final sizes for the VRH8771 and CS maps were 2351 and 1982 cM, respectively. The
map density or average distance between markers for VRH8771 and CS maps was 0.98 and 2.24 cM,
respectively (Table 1). The comparison of marker order with their physical position in VRH8771 and
CS maps showed that most plots were on the diagonal or adjacent position (Fig. S3).
Phenotypic evaluation of resistance to D. vitifoliae
The phenotypic scores of phylloxera root resistance were obtained in both in planta and in vitro
7experiments using 89 and 37 BC1 individuals, respectively. In the in planta experiment, results were
expressed by a number of nodosities per plant whereas in the in vitro experiment they corresponded
to a number of larvae counted on the five root pieces of each individual. A Spearman correlation
between in vitro and in planta data was performed revealing a positive and significant correlation (r =
0.47, p-value = 0.003). The nodosity and larvae numbers varied considerably within the three
replicates of each BC1 individual plant tested as illustrated by an average value of 73 % and 53 % for
the variation coefficients of in planta and in vitro experiments, respectively. As this experimental
system used the inoculation of insect eggs, the physiological variations in larval development, their
successful attachment to the rootlets and the establishment of the galls cannot be avoided. Low
values in nodosity or larvae numbers may result from less successful inoculations and not reflect the
level of resistance of the host plant. To minimize this kind of effect, the maximal numbers of
nodosities and larvae per individual were considered as the most reliable indicators of the
quantitative resistance phenotype in in planta and in vitro experiments, respectively (Zhang et al.
2009). The negative control genotype, ‘Börner’, exhibited the expected results with a maximum
number of 2 nodosities in planta and 9 larvae in vitro, respectively. Phenotypic responses of both
parental genotypes were in agreement with what was expected, as VRH8771 resulted resistant and
CS susceptible (Fig. 1). Over the population, the number of nodosities ranged from 0 to 37 (Fig. 1a)
and the number of larvae ranged from 0 to 39 (Fig. 1b) in in planta and in vitro experiments,
respectively. In both experiments, there were extensive variations of the phylloxera responses, with
values of broad-sense heritabilities being 0.48 and 0.74 for nodosity and larvae numbers,
respectively.
Phenotypic evaluation of resistance to X. index
In the first two experiments (2010-2011 and 2011-2012), resistance to X. index was screened from 35
BC1 individuals, using roots characteristics (RD and RW), the nematode reproduction factor (RF) and
the gall index (GI). The data obtained from these two experiments were analyzed together since no
year effect was identified (Fig. S4 and Table S2). A principal component analysis (PCA) using those 35
individuals and the RD, RW, RF and GI criteria showed that the two first axes explained 94.25 % of
8total variation (Fig. 2). Based on both the RF and GI criteria, resistant (R) and susceptible (S) groups
were clearly identified. These two groups were separated along the first dimension of the PCA which
is represented by these nematode development criteria. PCA demonstrated that susceptibility criteria
vary independently from root characteristics. Statistical analyzes confirmed this result with significant
differences in GI and RF values between resistant and susceptible BC1 individuals (Wilcoxon signed-
rank test – p-values of 0.00015 and 0.00013 for RF and GI, respectively). On the other hand, no
statistically significant differences were revealed between resistant and susceptible BC1 individuals
for the criteria (RD and RW) related to the roots characteristics (Wilcoxon signed-rank test – p-values
of 0.335 and 0.535 for RD and GW, respectively).
Spearman correlations were calculated among RD, RW, RF and GI criteria. There was no significant
correlation between RD or RW on the one hand and RF or GI on the other hand, which confirmed the
independence of the root and nematode developmental characteristics. The nematode reproduction
factor (RF) was highly correlated with the gall index (GI) (r = 0.59, p-value = 0.00019) (Table S3).
Such a high significant correlation made it possible to rely on the gall index rating in order to score
the response of the 60 total BC1 individuals to X. index within the independent experiments. An
individual is classified as resistant when its replicates have a mean GI value lower than 1 and as
susceptible when its replicates have a mean GI value equal or above 1. Thus, on all five experiments,
there were 50 and 10 BC1 individuals characterized as resistant and susceptible, respectively. This
segregation ratio 50R:10S fits the ratio of 7:1 (χ² 0.05= 0.5978) expected when three dominant and
independent genes control the resistance.
Genetic determinism and mapping of the response to D. vitifoliae
QTLs were detected for all traits scored and for their associated BLUP values in in planta and in vitro
experiments. On the high-density genetic map of VRH8771 (Table 2), seven total QTLs were identified
for both the maximum numbers of nodosities and the maximum numbers of larvae. These QTLs were
localized on three LGs i.e. LG 3, LG 7 and LG 10. LOD scores and the explained phenotypic variances
had higher values under in vitro conditions. This might be due to the lower environmental variations
occurring under in vitro than under greenhouse conditions. On LG 7, several QTLs were found
9whatever the conditions and criteria within a confidence interval of 60 cM. In this group, the two QTLs
detected for the criteria ‘maximum number of nodosities’ and ‘BLUP nodosities’ in in planta
experiment explained each approximately 20 % of the variability while the two QTLs detected in in
vitro conditions for the criteria ‘number of larvae’ and ‘BLUP larvae’ explained variances of 87 and 70
%, respectively. Two QTLs were identified on LG 10 in in planta and in vitro experiments, respectively
with the maximal number of nodosities and the BLUP values associated to the maximal number of
larvae. Finally, analysis of BLUP values associated to the maximal number of nodosities in in planta
conditions, showed a QTL on LG 3.
Genetic determinism and mapping of the response to X. index
The 7R:1S segregation ratio observed in our tests might suggest the presence of three dominant and
independent resistance (R) factors controlling the response to X. index. With this hypothesis in mind
for the detection of markers linked to resistance, we first used a method derived from the bulked-
segregant analysis (BSA) (Michelmore et al. 1991). As a double pseudo-testcross strategy was
developed in the construction of the genetic maps, access to information on the different allelic forms
was available only for SSR markers and, in a first step, the BSA-type analysis was performed using
only these markers. From the 2 (ab), 3 (abc) or 4 (abcd) putative allelic forms of SSRs, we retained
the markers for which an allele was detected in the resistant parent (VRH8771) and in a part of the
resistant BC1 individuals but was lacking in all the susceptible BC1 individuals and the susceptible
parent (CS). Markers meeting this requirement were located on the three linkage groups LG 9, LG 10
and LG 18 (Table 3), which is in line with the hypothesis of three dominant and independent R factors.
In order to use all the available genetic information related to the SSR and SNP markers, a proportion
test was performed. This test aimed at comparing the proportion of resistant and susceptible
individuals at each marker. Markers for which a statistically significant difference between resistant
and susceptible proportions have been obtained, have been considered as potentially involved in the
X. index resistance response. Such groups of markers with significant differences in their R/S
proportions were found on LG 9, LG 10 and LG 18, corroborating the results obtained by BSA-type
analyses from SSR markers (Table S4).
10We finally performed a QTL analysis with a binary mapping model using the R/S phenotypic
information from 60 BC1 individuals and the VRH8771 high-density genetic map. A first QTL
explaining 22.73 % of the phenotypic variance was detected on LG 9 with a LOD score of 3.66 (Table
4 – Fig. S5). VVBX-A-06, the marker identified at the QTL peak on this group, corresponds to the
marker identified previously through both the BSA-type analysis (Table 4) and the proportion test
(Table S4). A second QTL explaining approximatively the same proportion of phenotypic variance
(21.19 %) was detected on LG 10 with an equivalent LOD score (3.59) (Fig. S5). The marker SC8-03
positioned at this QTL was the same as the marker detected by the proportion test on this linkage
group but it was located distantly from the three SSR markers identified in the BSA-type analysis
(MRBX-27, VVIN78-SEC and VVIN85). The third QTL with the highest LOD score (13.43% of the total
phenotypic variance) was located on LG 18, i.e. in the same third chromosomal location as in the BSA-
type analysis and the proportion test. Marker UDV-108 identified at this QTL was also the marker
obtained from both other analyses. Nevertheless, this later QTL had a LOD score of ~2.5 that did not
reach the significant threshold value of 3.12 (Table 4). In descending order, other loci were detected
on LG 7, LG 19 and LG 11 but with much lower values of LOD scores (2.0 to 1.5) (Fig. 3).
Discussion
Genetic mapping of a V. vinifera x M. rotundifolia cross
Vitis x Muscadinia crosses have a very low fertility due to the differences in chromosome number that
generate an incomplete homology between the genomes at meiosis (Riaz et al. 2012). Despite this
limiting factor, a few F1 hybrids were obtained and have then been successfully backcrossed with
Vitis species. Although reduced the size of the progeny, QTL analyses are reliable at the sight of the
reproducibility of results obtained through different experimental conditions (in planta and in vitro)
and different statistical methods (in silico BSA and QTL detection). This paper first reports the
construction of high-density grapevine genetic maps for the BC1 progeny involving the V. vinifera x
M. rotundifolia accession ‘VRH8771’ and the V. vinifera cv. ‘Cabernet-Sauvignon’ using both SSR and
SNP types of markers. The framework maps established using SSR markers from other grapevine
crosses were completed with SNP markers generated by GBS (Adam-Blondon et al. 2004; Doligez et
11al. 2006; Troggio et al. 2007; Wang et al. 2012; Barba et al. 2014). Among the whole genome and
next generation sequencing techniques, GBS offers an inexpensive and robust solution for
simultaneous SNP discovery and genotyping (Elshire et al. 2011; Poland and Rife 2012). In grapevine,
GBS has already been used in the construction of high-resolution maps for the detection of QTLs
linked to powdery and downy mildew resistance (Barba et al. 2014, Teh et al. 2017, Sapkota et al.
2019). In the present map, the number of SNP markers was lower in the paternal parent, CS, than in
the maternal parent, VRH8771. This difference is linked to the use of the V. vinifera cv ‘Pinot Noir’
(PN40024) reference genome in our analyses (The French–Italian Public Consortium for Grapevine
Genome Characterization 2007; Adam-Blondon et al. 2011). Actually, this genome is genetically closer
to CS than to the Vitis x Muscadinia hybrid VRH8771, which explains a higher number of polymorphic
markers in the maternal accession (Delame et al. 2019). As already shown in other studies, the
comparison of the marker order with their physical position in VRH8771 map confirmed the high level
of macrosynteny between the V. vinifera and M. rotundifolia genomes (Riaz et al. 2012; Blanc et al.
2012; Delame et al. 2019). The average distance between adjacent markers in all linkage groups in
the maternal map was 0.98 cM, which is the same range of density reported by Teh et al. (2017) and
Saptoka et al. (2019). The saturation level of the maternal genetic map is close to the map
established by Delame et al (2019) for a muscadine derived progeny.
Identification of original QTLs for nodosity formation and larval development in response
to root infection by D. vitifoliae
The response of the BC1 plants to phylloxera has been explored through both in vitro and in planta
experiments. As expected in each experiment a wide variability of the response has been observed
among replicates of a same plant individual due in particular to the vigour of the insect population. To
minimize this effect, we considered the maximal values of the criteria studied as the most reliable
indicators of the quantitative resistance phenotype (Zhang et al. 2009). Moreover, a linear mixed
model was used to access the block effect in relation to the experimental design in randomized
blocks. Thus, BLUP values were estimated and accounted for environmental effects (Piepho et al.
2008). This method has been used to optimize the statistical power for the detection of significant
12QTLs (Segura et al. 2009; Sadok et al. 2013). A QTL was detected on LG 7 for nodosity and larvae
numbers with an explained phenotypic variance that reached 87 % in the in vitro experiment. The
physiological status of the roots (which insects fed from) in each experiment, i.e. either connected to
their plant (in planta) or completely detached from it (in vitro), was quite different. Despite this, the
strongest QTLs in both experimental conditions were located on the same chromosome (LG 7). Such
results are in agreement with those obtained by Bouquet (1983) who reported also a good correlation
of the data between the experiments conducted in vitro and in the greenhouse and/or the vineyard.
Moreover, this author recorded a low ratio of phylloxera resistant plants in such V. vinifera x M.
rotundifolia BC1 progenies. He suggested that this low ratio can be explained if the R factor
controlling this trait is carried by a Muscadinia chromosome which has a low probability of pairing with
its homologous V. vinifera chromosome in the F1 hybrids. By locating our major QTL in LG 7, the Vitis
chromosome which had been split into the LG 7 (upper arm) and LG 20 (lower arm) in Muscadinia, our
current data are in line with this previous hypothesis of a location of this R factor in the lower arm of
chromosome 7.
Nevertheless, two other QTLs were also identified on LG 3 and LG 10 in our results, suggesting that
other loci may influence or modulate nodosity formation and larval development.
The putative involvement of several QTLs in response to phylloxera has already been reported in the
literature. Davidis and Olmo (1964) first hypothesized that the resistance from a M. rotundifolia
accession was controlled by more than one locus. Then Bouquet (1983) suggested that grape
phylloxera resistance in M. rotundifolia might be mediated by a semi-dominant locus regulated by
three genetic modifiers. Similarly, in interspecific crosses involving different American Vitis species (V.
berlandieri, V. cinerea and V. rubra) and M. rotundifolia, Boubals (1966) concluded that the resistance
appears to be controlled by multiple loci. Four root grape phylloxera resistance QTLs have already
been identified in Vitis spp. In V. cinerea, two QTLs have been mapped in two different accessions:
RDV1 located on LG 13 in cv. ‘Arnold’ (Zhang et al. 2009) and RDV2 located on LG 14 in cv. ‘C2-50’
(Smith et al. 2018). Two other QTLs have been detected on LG 5 and LG 10 in an F1 cross containing
at least six Vitis species in the ancestry (Clark et al. 2018). In our study, three new QTLs were
13identified from M. rotundifolia background. Interestingly, these seven QTLs have been mapped on six
different LGs.
Resistance response to the dagger nematode X. index maps on three different LGs
The individuals were tested for their response to the dagger nematode X. index among successive
experiments and no significant differences were found between the years of experiment, which
underlines the reproducibility of the experimental protocol and the reliability of phenotyping.
Our evaluation of X. index resistance used a nematode reproduction factor and a root gall index
assessed 10 to 12 months after inoculation. The root weight and a visual index of root development
were also considered in order to study their relationships with the nematode development criteria
previously mentioned. Gall index was shown to be highly correlated with the nematode reproduction
factor but not with root characteristics. Such gall index rating method has been previously used in a
genetic study for resistance to X. index in V. arizonica. It allowed the characterization of the early
resistance conferred by the locus XiR1 4 to 8 weeks after inoculation in a fast greenhouse-based
screening system (Xu et al. 2008; Hwang et al. 2010). Our current data demonstrate that gal index is
also a reliable criterion for rating resistance to X. index in longer tests (10-12 months) in order to
identify R factors that should confer a more durable effect.
In our study, the distribution of the resistance levels to X. index was evaluated from 60 BC1
individuals. The approximate 7R:1S segregation ratio obtained suggested that three dominant and
independent resistance factors might be involved in the response to the nematode. To cope with this
hypothesis, a method derived from the bulked-segregant analysis (Michelmore et al. 1991) and
performed on SSRs revealed markers on LG 9, LG 10 and LG 18. A proportion test using both SSRs
and SNPs identified markers in the same three LGs and therefore confirmed previous data.
The QTL analysis performed on the same individuals supported these findings since two QTLs were
identified on LG 9 and LG 10. QTL location on LG10 was not clearly estimated on this chromosome
since the LOD score distribution curve showed 3 significant peaks, A third QTL was detected on LG 18
and, even though it was not significant, its LOD score value was higher than those observed on other
linkage groups. These results provide the first location of resistance factors against the vector
14nematode X. index in muscadine. On the basis of segregation patterns observed in the progenies from
Vitis crosses involving 13 species, one-gene and two-gene modes of tolerance to X. index were
previously reported (Meredith et al. 1982), and Xu et al. (2008) identified a single resistance locus,
XiR1, on the LG 19 of V. arizonica using a map from 185 plants. Interestingly, some hybrids, in
particular the BC1 rootstock ‘Nemadex Alain Bouquet’, derived from the M. rotundifolia accession
‘NC184-4’ presently studied, were shown to decrease both X. index numbers and GFLV infection
under greenhouse and field conditions (Bouquet at al. 2000; Ollat et al. 2011; Claverie et al. 2016;
Nguyen 2018). Consequently, we hypothesize that resistance to X. index conferred by this muscadine
accession will be associated with a delay in GFLV transmission by the nematode to the grapevine.
QTLs identified for response to D. vitifoliaie and X. index map to chromosomic regions
enriched in resistance gene analogs
While V. vinifera is highly sensitive to the most critical pests and diseases for grapevine, wild Vitis and
Muscadinia materials are characterized by various levels of resistance. Among all, powdery and
downy mildew have been studied in details, and numerous loci controlling partial or total resistance to
both diseases have been identified (Merdinoglu et al. 2018). Interestingly, some of the chromosomic
regions identified in our study as carrying R factors to D. vitifoliae and X. index already encompass
QTLs identified in response to other major grapevine diseases. LG 18 contains many loci detected for
resistance to downy mildew Plasmopara viticola and powdery mildew Erysiphe necator in mucadine
(Wiedemann-Merdinoglu et al. 2006; Riaz et al. 2011) or Vitis spp. (Welter et al. 2007; Bellin et al.
2009; Zyprian et al. 2016; Sapkota et al. 2019). Thus, among the markers flanking the Rpv3
(resistance to P. viticola) locus identified from ‘Regent’ genotype by van Heerden and collaborators
(2014) on LG 18, is the UDV-108 marker which has been identified in our study with the maximum
LOD score in one of the three QTLs highlighted in response to X. index. Additionally, in Vitis spp., the
loci rpv7 (resistance to downy mildew) and rpv5 and Ren6 (downy and powdery mildew) have been
reported on LG 7 and LG9 respectively (Bellin et al. 2009; Marguerit et al. 2009; Pap et al. 2016).
These three chromosomes have been previously demonstrated to be enriched in NBS-LRR genes (Di
Gaspero et al. 2007). The current development of sequencing technologies should contribute to the
15comparison of Vitis genomes and to gather more precise knowledge about these resistance genes in
order to use them in breeding new cultivars with multi-pest resistances.
Conclusions
With the objective of grapevine rootstock breeding, our data open the way to the use of muscadine as
a source for the obligate phylloxera R feature and as an R source to X. index in order to delay GFLV
transmission to grapevine by this nematode. In this work, we could successfully identify root
resistances against phylloxera and X. index and map the first cognate QTLs from the M. rotundifolia
source ‘NC184-4’. Thus QTLs were identified on LG 7 completed by LG 3 and LG 10 in response to
phylloxera and on LG 9, LG 10 and LG 18 in response to X. index. These newly identified trait-linked
loci should now be tested in alternative crosses with M. rotundifolia. In the future, validated markers
at those loci may allow their use in a marker-assisted breeding approach for producing new
rootstocks with durable resistances.
Methods
Plant material
We used the backcross 1 (BC1) segregating population of 135 individuals (Table S1) from the cross
between the hybrid VRH8771 [(‘Cabernet-Sauvignon’ x ‘Alicante Bouschet’) x M. rotundifolia] and V.
vinifera cv. ‘Cabernet-Sauvignon’ (VRH8771 x CS). This cross has been initiated by Alain Bouquet at
INRA Montpellier since 2005 and continued at INRA UMR EGFV (Bordeaux, France) after 2008.
VRH8771, the female parent, is resistant to D. vitifoliae and X. index whereas V. vinifera ‘Cabernet-
Sauvignon’ (CS), the male parent, is susceptible (Bouquet et al. 2000). Parental genotypes and BC1
individuals are conserved at the INRA germplasm repository at INRA UMR EGFV (Bordeaux, France).
Insect and nematode material
For D. vitifoliae, all experiments were conducted with the isofemale clone ‘Pcf7’. The original
population was sampled in 2010 at Pineuilh (France) on V. vinifera cv. ‘Cabernet franc’ scions grafted
on SO4 rootstock (V. berlandieri x V. riparia) and maintained at INRA UMR SAVE (Bordeaux, France) on
leaves of the American variety ‘Harmony’, a complex hybrid between Dog-Ridge (V. champinii) and
‘1613C’ (V. labrusca x V. riparia x V. vinifera) and on root pieces of V. vinifera cv. ‘Cabernet
16Sauvignon’.
For X. index, all experiments were conducted with the isofemale line ‘Frejus’. The original population
has been sampled in a GFLV-infected grapevine field in Frejus (Provence, France). Using the
population grown on grapevine in the greenhouse, the line had been created from a single female
inoculated on a fig plant previously grown from in vitro.
Experimental designs and phenotyping
Phylloxera assays
An in planta assay was performed with 89 BC1 individuals. Two control genotypes were also tested: V.
vinifera cv. ‘Pinot Noir’ and the rootstock ‘Börner’ (V. riparia x V. cinerea) as susceptible and resistant
genotypes respectively. This experiment was organized according to a randomized complete block
design with three experimental blocks, each block being an independent randomization of one
replicate of each BC1 individual. Plants were grown in individual pots of 1L in a soil substrate
composed of at least 50 % clay with pebbles at the bottom to improve drainage. The soil was
sterilized by autoclaving in order to prevent cross contamination with other phylloxera population
sources. Each pot was covered with an insect-proof transparent plastic bell and an automatic
watering system was adapted (Fig. S6 A). One hundred phylloxera eggs of ‘Pcf7’ clone, previously
grown on root pieces of V. vinifera cv. ‘Cabernet Sauvignon’ for two generations, were deposited on a
moistened and sterilized filter paper near the root (~3 cm depth) of each pot. Three months after
inoculation, the plants were uprooted and the nodosity number was counted (Fig. S6 B). The maximal
number of nodosities scored among the three replicates of each BC1 individual was considered as the
most reliable indicator of the quantitative resistance phenotype.
An in vitro assay was also performed according to Pouget (1975) to assess the larval development of
phylloxera on 37 BC1 individuals. Five woody root pieces per individual, 6 to 7 cm long, were
arranged in small bundles (a contact between all the roots is required) on a disk of dampened blotting
paper in a Petri dish sealed with parafilm. Three replicates were realized for each individual. A
fungicide treatment (Ridomil Gold, Syngenta ® - 2.3g/L) was carried out on the roots to prevent
Botrytis cinerea infection. In each Petri dish, 50 phylloxera eggs were deposited on the roots pieces.
17Then Petri dishes were incubated at 25°C in the dark. The number of larvae that have developed on
the five root pieces was counted one month after inoculation. The maximal number of larvae scored
among the three replicates was considered as the best indicator of the quantitative resistance
phenotype.
X. index assays
A total of 60 BC1 individuals were evaluated during five successive experiments conducted between
2010 and 2017 (Table S4). Three reference genotypes were also tested: the susceptible V. rupestris
cv. ‘du Lot’, the resistant BC1 rootstock ‘Nemadex Alain Bouquet’ from the cross ‘VRH8773 (V.
vinifera x M. rotundifolia) x 140 Ru (V. berlandieri x V. rupestris)’ and the susceptible to intermediate
genotype ‘VRH8624’. VRH8773 is a brother clone of VRH8771, and VRH8624 in an F1 hybrid (V.
vinifera x M. rotundifolia) whose muscadine parent is the accession ‘Trayshed’ (Esmenjaud et al.
2010).
For each evaluation, homogenous hardwood cuttings of the individuals were rooted annually in
alveolated plates in the nursery at INRA UMR EGFV (Bordeaux, France) in February. In May, plants
were delivered to INRA UMR ISA (Sophia-Antipolis, France), planted individually into 2-L pots with six
replicates per individual and grown in a greenhouse. At the end of June, each pot was inoculated with
a fixed number of nematodes that ranged from 300 to 900 depending on the year of experiment
(Table S5). The plants were grown for ten to twelve months, which is the time that allows
approximately three to four nematode developmental cycles over two successive calendar years.
At harvest, the aerial part of the plant was cut at the collar level and removed and each pot was
hermitically placed into a plastic bag and stored in a cold chamber at 6°C. This stopped plant and
nematode development simultaneously in all individual replicates until plant and nematode ratings.
Ratings were done sequentially, i.e. replicate after replicate. Total soil of each 2-L pot was recovered
in a 10-L bucket, over which plant roots were washed individually with caution under tap water. The
entire root system of each plant was rated for its root development (RD) based on a 0-5 scale and its
fresh root weight (RW) was also measured. Root galling was rated for each plant using a 0-5 gall
index (GI) scale derived from studies for resistance to the root-knot nematode Meloidogyne spp. : 0 =
18no gall; 1 = 1-10 %; 2 = 11-30 %; 3 = 31-70 %; 4 = 71-90 %; 5 > 90 % of root system galled (Barker
1985). Nematodes of each plant were extracted from the total soil suspended in the bucket using an
adapted Oostenbrink method (De Goede and Verschoor 2000). In the two first experiments (2010-
2011 and 2011-2012), final nematode numbers were counted under a binocular microscope. Then the
ratio between nematode final and initial numbers was calculated to evaluate the mean nematode
reproduction factor (RF) for each BC1 individual and the parental and reference genotypes.
Individuals were classified as resistant (R) when their RF value was lower than 1 and susceptible (S)
when their RF value was equal or above 1. As the two first experiments showed that RF ratings were
significantly correlated with GI ratings (see Results section), no nematode extraction was performed
for the three last experiments (2012-2013, 2015-2016 and 2016-2017) and individuals were classified
directly as R or S from their visual symptoms.
Treatment of phenotypic data sets
Phylloxera assays
The number of nodosities and the number of larvae were explored using the following generalized
mixed model:
Pij = µ + individual + blockj + εij
where Pij is the observed phenotype, µ is the overall mean of the phenotypic data, ‘individual’
corresponds to the genetic differences among the BC1 individuals, ‘block’ accounts for the differences
in microenvironmental conditions among the three blocks, and εij is the residual term (R LME4
package). The factor ‘individual’ was treated as a random factor, whereas the factor ‘block’ was
treated as a fixed factor. The ‘Best linear unbiased predictions’ (BLUP) of random effects were
extracted from the selected generalized mixed model. The BLUP values were noted by the name of
the trait preceded by the word BLUP.
For each quantitative phenotypic trait, broad sense heritability was estimated using the formula
h²=σ²g/[ σ²g+ σ²e/n], where σ²g is the genetic variance, σ²e is the environmental variance and n is the
number of plants per accession.
19Nematode assays
All principal component analyses (PCA) and parametric and non-parametric statistical tests were
performed using R version 3.4.0. Statistical significance was set at P < 0.05.
Mapping of the resistance traits
Simple Sequence Repeats (SSR) markers
DNA was extracted from 50 to 100 mg of young leaves grown in a greenhouse from 90 BC1
individuals (Table S1). Leaves were ground in 5 mL of a first buffer extraction containing sodium
metabisulfite [sodium metabisulfite 20 mM, Tris-HCl pH8 0.2 M, EDTA pH8 70 mM, NaCl 2 M]. 500 µL
of this homogenate was incubated with 450 µL of a second buffer with CTAB [CTAB 2 %, NaCl 1.4 M,
EDTA pH8 20 mM, Tris-HCl pH8 0.1 M] during one hour at 65°C. Then the solution was centrifuged for
30 minutes at 13,000 rpm at 4°C. 500 µL of supernatant was sampled and cleaned with the same
volume of a solvent chloroforme:octanol (24:1). After 20 min of spin at 13,000 rpm at 4°C, we
recovered 300 µL of the aqueous phase in 450 µL of a solution of isopropanol: ammonium acetate
(2:1). We left one hour at 4°C and then we centrifuged at 13,000 rpm for 20 min at 4°C. We discarded
the solution and washed the pellet with 70% ethanol v/v (two times). After centrifugation (13,000 rpm
for 20 min at 4°C), we discarded the ethanol, and precipitated the pellet in 100 to 200 µL of TE 0.1 X
[Tris HCl 10mM, EDTA 1mM]. DNAs were quantified by NanodropTM.
A total of 217 primers pairs were used: 61 VMC (Vitis Microsatellite Consortium, managed through
AGROGENE, Moissy Cramayel, France), 7 VVMD (Bowers et al. 1999), 1 VVS (Thomas and Scott 1993),
6 SC08 (Cipriani et al. 2011), 1 VrZAG (Sefc et al. 1999), 7 VVC (Thomas and Scott 1993), 59 VVI
(Merdinoglu et al. 2005), 11 MRBX (Zah-Bi et al. 2010), 21 UDV (Di Gaspero et al. 2005) and marker
Gf13-9 (Zhang et al. 2009). Two new series of SSRs, VVBX and VVBX-A, were designed from the
genome 12X of V. vinifera cv. ‘Pinot Noir’ (PN40024) using Primer3 software (Untergasser et al. 2012).
Primers characteristics of VVBX and VVBX-A markers are reported in Table S6.
PCRs were performed by a single reaction with M13-tailed forward primer (Oetting et al. 1995)
conjugated with four different dyes (6FAM™, VIC®, NED™ and PET®) in 15 µl reaction volume
containing : 5 ng of DNA template, 1.5 µL of 10xPCR reaction buffer, 2 mM of MgCl2, 0.2 mM of each
20dNTP, 0.05 µM of M13 tailed SSR forward primer, 0.2 µM of reverse primer, 0.2 µM of dye conjugated
with M13 primer, and 0.2 U of JumpStart™ Taq DNA Polymerase (Sigma-Aldrich). Amplification
conditions were as follows: 5 min initial denaturation step at 95°C followed by 2 cycles (30 s
denaturation at 95°C, 1.5 min annealing at 60°C or 56°C and 1 min extension at 72°C) followed by 35
cycles (30 s denaturation at 95°C, 30 s annealing at 60°C or 56°C and 1 min extension at 72°C) then
followed by 10 min final extension at 72°C. Visualization was performed by a 3730 DNA analyzer
(Applied BiosystemTM). Eight to sixteen PCR products were pooled, according to the size of SSRs and
the dyes, and analyzed in a single run. Electropherograms were analyzed using free software STRand.
Any ambiguous genotypes were re-run, re-amplified or left as unknown.
Single Nucleotide Polymorphisms (SNP) markers
Two foliar disks (1.5 cm of diameter) of 128 BC1 individuals grown in a greenhouse were sampled
(Table S1). DNA extractions were realized on dried leaf tissues using the same protocol as described
by Cormier et al. (2019). Genotyping-by-sequencing (GBS) was performed as described by Elshire et
al. (2011) (Keygene N.V. owns patents and patent applications protecting its Sequence Based
Genotyping technologies) integrating two 96-well plates across 96 barcodes for library preparation.
The genomic library was prepared using ApeKI restriction enzyme. Paired-end sequencing of 150 bp
reads was performed on an Illumina HiSeq3000 system (at the GeT-PlaGe platform in Toulouse,
France).
Raw reads were checked with FastQC (Andrews 2016), demultiplexed with a custom script
(https://github.com/timflutre) and cleaned with CutAdapt (Martin 2011). Cleaned reads were then
mapped to the V. vinifera cv ‘Pinot Noir’ (PN40024) genome assemblies for SNP calling. Alignment on
this genome was performed using Burrows-Wheeler Aligner maximal exact match (BWA-MEM) with
default parameters (Li and Durbin 2009), SAMtools and Picard (http://broadinstitute.github.io/picard/).
SNP calling was performed with GATK using the hardfilter parameters (McKenna et al. 2010; DePristo
et al. 2011; Van der Auwera et al. 2013).
VCFtools was used to remove SNPs with a quality score < 200 and with depth values < 10 (Danecek
21et al. 2011). Quality-filtered SNPs were analyzed with the major_minor and get_pseudo_test_cross
scripts from HetMappS pipeline to identify pseudo-testcross markers (Hyma et al. 2015). In the
variant call format (VCF) output file only sites with less than 10 % missing data were retained.
Individuals with more than 50% missing data and those with genotype frequencies different from
expected 1:1 marker segregation were discarded. Two sets of markers were obtained corresponding
to the two parental genotypes.
Map construction
Individual maps were constructed for each parental genotype following a double pseudo-testcross
strategy (Grattapaglia and Sederoff 1994). Marker segregation was analysed with regard to goodness-
of-fit to the expected Mendelian ratio using the Chi-square test (P < 0.05). Marker types of lm x ll and
nn x np were retained for construction of maternal and paternal maps, respectively. Genetic maps
and marker order were determined using the maximum likelihood (ML) algorithm with Haldane
function and default parameters of JoinMap®4.1 software (Van Ooijen 2006). Linkage groups (LGs)
were constructed with a minimum threshold logarithm of odds (LOD) score of 6.0. LGs were grouped
and numbered based on their corresponding physical chromosome numbers (The French–Italian
Public Consortium for Grapevine Genome Characterization 2007).
Methods for resistance mapping
Phylloxera assays
The maximum number of nodosities (in planta assay), the maximum number of larvae (in vitro assay)
and the BLUP values associated were used as the quantitative scores of susceptibility/resistance
response.
Detection of quantitative trait loci (QTLs) was performed with the one-dimension scan function,
scanone, of R/qtl software using a normal model but also a non-parametric analysis and the
expectation-maximization (EM) algorithm method depending on the normality of the data (Dempster
et al. 1977; Broman et al. 2003). Multipoint genotype probabilities were calculated beforehand using
calc.genoprob with step = 1 and default parameters. Logarithm of odd score (LOD) significance
threshold was estimated with 1000 permutations and for a significant level α of 0.05. An interval
22estimate of the location of each QTL was calculated using the 1.5-LOD intervals method of Rqtl
(Broman and Sen 2009). The percentage of the phenotypic variation explained by a QTL corresponds
to the regression value R² taken at its peak LOD score.
Nematode assays
Based on SSR markers, an in silico method derived from the Bulked Segregant Analysis (BSA) was
performed (Michelmore et al. 1991). In the VRH8771 x CS progeny, polymorphic markers were
distributed into either 2 (ab), 3 (abc) or 4 (abcd) allelic forms. From each of the markers screened,
markers retained were those for which an allele was detected in the resistant parent (VRH8771) and
in part of the resistant BC1 individuals but in none of all susceptible BC1 individuals.
The resistant and susceptible phenotypes were converted to values equal to 0 and 1, respectively.
The one-dimension scan function, scanone, of R/qtl software was performed with the argument model
= ‘binary’ (Broman and Sen 2009). LOD significance threshold, the QTL interval and the R² value were
obtained with the procedure described in the previous paragraph. A number of 47 phenotyped
individuals were used for the BSA analysis with SSR markers whereas the 60 total individuals
phenotyped were used for QTL analysis with SSR and SNP markers.
Declarations
Ethics approval and consent to participate
Not applicable
Consent for publication
Not applicable
Availability of data and material
The data sets during the current study are available from the corresponding author.
Competing interests
The authors declare there are no conflicts of interest.
Funding
This study has received funding from the European Union’s Seventh framework program for research,
technological development and demonstration under grant agreement n°311775 (Innovine, 2013-
232016). It was also partly funded by the French Ministry of Agriculture through the CASDAR contracts
‘RemuneX’ (2015-2018) (CTPS Project n°C-2014-09), and ‘PIVERT I and II’ (2016-2019) (France
AgriMer EDP 09 16 00 2775, EDP 09 17 00 3392, EDP 09 18 00 3764). A complementary funding has
been provided by the contracts INRA-AgriObtentions IVD3 (2011-2015) and IVD4 (2016-2020).
Authors’ Contributions
NO, DE and DP designed the study. ML and J-PT performed the crosses and participated to the
maintenance of the progeny. ML, J-PP, BJ and DP performed the phylloxera tests and ML, MD, BJ, DP,
GLT and BR analyzed the data for phylloxera. DE, RV, UP and CVG performed the X. index tests and
DE, GLT and BR analyzed the data for X. index. GLT and MD collected the samples for DNA extraction
and performed microsatellite genotyping. GLT, LLC and BR constructed the genetic maps and
performed the statistical analysis. GLT and BR contributed to the QTL analyses. P-FB aided in
interpreting the results and contributed to the correction of the manuscript. DE, GLT and BR wrote the
first version of the manuscript. DE, BR, LLC and NO generated the last version of the manuscript. All
authors read and approved the manuscript
Acknowledgements This manuscript is dedicated to Alain Bouquet who initiated numerous crosses
involving muscadine in particular the cross used in this study. Without him, nothing would have been
possible. The authors thank A. El Msayryb and A. Bakhkhouch for their help in nematological analyses,
B. Douens, J-P Robert and C. Hévin for their contribution to plant material multiplication and
maintenance, and N. Girollet for his wise advices and help in bioinformatic processing of data.
Abbreviations
BLUP: Best linear unbiased predictions
BSA: Bulked segregant analysis
EM: expectation-maximization
GBS: Genotyping-by-sequencing
LG: Linkage group
LOD: Logarithm of odds ratio
ML: maximum likelihood
24NGS: Next-generation sequencing
PCA: principal component analysis
QTL: Quantitative trait locus
SNP: Single nucleotide polymorphism
VCF: variant call format
References
1. Adam-Blondon AF, Martinez-Zapater JM, Kole C (2011) Genetics, Genomics, and
Breeding of Grapes. Science Publishers and CRC Press Book
2. Adam-Blondon A-F, Roux C, Claux D, et al (2004) Mapping 245 SSR markers on the
Vitis vinifera genome: a tool for grape genetics. Theor Appl Genet 109:1017–1027
3. Andret-Link P, Laporte C, Valat L, et al (2004) Grapevine fanleaf virus: still a major
threat to the grapevine industry. J Plant Pathol 86:183-195
4. Barba P, Cadle-Davidson L, Harriman J, et al (2014) Grapevine powdery mildew
resistance and susceptibility loci identified on a high-resolution SNP map. Theor Appl
Genet 127:73–84
5. Barker KR (1985) Design of greenhouse and microplot experiments for evaluation of
plant resistance to nematodes. In: Zuckerman BM, MAi WS, Harrison MB eds. Plant
Nematology Laboratory Manual. Amherst: University of Massachussets Agriculture
Experiment Station, 103-113
6. Bellin D, Peressotti E, Merdinoglu D, et al (2009) Resistance to Plasmopara viticola in
grapevine 'Bianca' is controlled by a major dominant gene causing localised necrosis
at the infection site. Theor Appl Genet 120:163-176
7. Blanc S, Wiedemann-Merdinoglu S, Dumas V, et al (2012) A reference genetic map of
Muscadinia rotundifolia and identification of Ren5, a new major locus for resistance
to grapevine powdery mildew. Theor Appl Genet 125:1663–1675
8. Bordenave L, Tandonnet JP, Decroocq S, et al (2014) Wild vitis as a germplasm
25resource for rootstocks. In: Exploitation of autochtonous and more used vines
varieties - Oenoviti International Network I, Geisenheim, Germany.
9. Boubals D (1966) Hérédité de la résistance au phylloxéra radicicole chez la vigne.
Ann Amélioration Plantes 16:327–347
10. Bouquet A (1980) Vitis x Muscadinia hybridization: A new way in grape breeding for
disease resistance in France Proc Third Intl Symp on Grape breeding pp. 42-61
11. Bouquet A (1983) Etude de la résistance au phylloxéra radicicole des hybrides Vitis
vinifera x Muscadinia rotundifolia. Vitis 22:311-323
12. Bouquet A, Danglot Y, Bongiovanni M, et al (2000) Breeding rootstocks resistance to
Grape fanleaf virus spread, using Vitis x Muscadinia hybridization. Acta Hortic 528:
517-526
13. Bowers JE, Dangl GS, Meredith CP (1999) Development and characterization of
additional microsatellite DNA markers for grape. Am J Enol Vitic 50:243–246
14. Broman KW, Sen S (2009) A guide to QTL mapping with R/qtl. Springer, Dordrecht
15. Broman KW, Wu H, Sen S, Churchill GA (2003) R/qtl: QTL mapping in experimental
crosses. Bioinformatics 19:889–890
16. Cipriani G, Di Gaspero G, Canaguier A, et al (2011) Molecular linkage maps:
strategies, resources and achievements. In AF Adam-Blondon JM Martinez-Zapater C
Kole (eds) Genet Genomics Breed Grapes pp. 111–136
17. Clark MD, Teh SL, Burkness E, et al (2018) Quantitative trait loci identified for foliar
phylloxera resistance in a hybrid grape population: Foliar phylloxera resistance. Aust
J Grape Wine Res 24:292–300.
18. Claverie M, Audeguin L, Barbeau G, et al (2016) Nemadex AB : Bilan des réseaux
d'expérimentation en France. Progrès Agricole et Viticole pp.17-29.
19. Cormier F, Lawac F, Maledon E, et al (2019) A reference high-density genetic map of
26You can also read