Cough Against COVID: Evidence of COVID-19 Signature in Cough Sounds
←
→
Page content transcription
If your browser does not render page correctly, please read the page content below

Cough Against COVID: Evidence of COVID-19 Signature in Cough Sounds
                                                                   Piyush Bagad1∗ , Aman Dalmia1∗ , Jigar Doshi1∗ , Arsha Nagrani2† ,
                                                                         Parag Bhamare1 , Amrita Mahale1 , Saurabh Rane1 ,
                                                                                 Neeraj Agarwal1 , Rahul Panicker1
                                                                                       1
                                                                                        Wadhwani Institute for Artificial Intelligence
                                                                               2
                                                                                   VGG, Dept of Engineering Science, University of Oxford
arXiv:2009.08790v2 [cs.SD] 23 Sep 2020

                                                                     Abstract                                   symptoms (asymptomatics) but they continue to be conta-
                                                                                                                gious (WHO 2020a; Daniel P. Oran 0; Day 2020). To ad-
                                           Testing capacity for COVID-19 remains a challenge globally
                                           due to the lack of adequate supplies, trained personnel, and
                                                                                                                dress this challenge, we present an AI-based triaging tool
                                           sample-processing equipment. These problems are even more            to increase the effective testing capacity of a given public
                                           acute in rural and underdeveloped regions. We demonstrate            health system. At the current model performance and at a
                                           that solicited-cough sounds collected over a phone, when             prevalence of 5–30%, our tool can increase testing capacity
                                           analysed by our AI model, have statistically significant signal      by 43–33%.
                                           indicative of COVID-19 status (AUC 0.72, t-test, p < 0.01,              There have been various successful efforts using CT scans
                                           95% CI 0.61—0.83). This holds true for asymptomatic pa-              and X-rays to classify COVID-19 from other viral infec-
                                           tients as well. Towards this, we collect the largest known           tions (Wang and Wong 2020; Hall et al. 2020; Gozes et al.
                                           (to date) dataset of microbiologically confirmed COVID-19            2020; He et al. 2020). This suggests that COVID-19 affects
                                           cough sounds from 3,621 individuals. When used in a triag-           the respiratory system in a characteristic way (Huang et al.
                                           ing step within an overall testing protocol, by enabling risk-
                                           stratification of individuals before confirmatory tests, our tool
                                                                                                                2020; Imran et al. 2020) (see Section II (B) of (Imran et al.
                                           can increase the testing capacity of a healthcare system by          2020) for a detailed summary). The respiratory system is a
                                           43% at disease prevalence of 5%, without additional supplies,        key pathway for humans to both cough and produce voice
                                           trained personnel, or physical infrastructure.                       where air from the lungs passes through and is shaped by
                                                                                                                the airways, the mouth and nasal cavities. Respiratory dis-
                                                                                                                eases can affect the sound of someones breathing, coughing,
                                                               1    Introduction                                and vocal quality as most readers will be familiar with from
                                         On 11th March, 2020, the World Health Organisation                     having e.g. the common cold. Following this intuition we in-
                                         (WHO) declared COVID-19 (also known as the coronavirus                 vestigate whether there is a COVID-19 signature in solicited
                                         disease, caused by SARS-CoV2) a global pandemic. As of                 cough sounds and if it can be detected by an AI-model.
                                         20th August, 2020, there were more than 22M confirmed                     The main contributions of this paper are as follows: (i) We
                                         cases of COVID-19 globally and over 788K deaths (JHU                   demonstrate with statistical significance that solicited-cough
                                         2020). Additionally, COVID-19 is still active, with 267K               sounds have a detectable COVID-19 signature; (ii) Our mod-
                                         new cases and 6,030 deaths per day world wide. As we                   elling approach achieves a performance of 72% AUC (area
                                         eagerly await new drug and vaccine discoveries, a highly               under the ROC curve) on held out subsections of our col-
                                         effective method to control the spread of the virus is fre-            lected dataset; (iii) We demonstrate with statistical signifi-
                                         quent testing and quarantine at scale to reduce transmission           cance that solicited-cough sound has a detectable COVID-
                                         (Kucharski et al. 2020). This has led to a desperate need for          19 signature among only asymptomatic patients (Fig. 7b);
                                         triaging and diagnostic solutions that can scale globally.             (iv) We collect a large dataset of cough sounds paired with
                                            While the WHO has identified the key symptoms for                   individual metadata and COVID-19 test results. To the best
                                         COVID-19 – fever, cough, and breathing difficulties, and re-           of our knowledge this is currently the largest cough dataset
                                         cently, an expanded list (WHO 2020b), these symptoms are               with verified ground truth labels from COVID-19 Reverse
                                         non-specific, and can deluge healthcare systems. Fever, the            Transcription Polymerase Chain Reaction (RT-PCR) test re-
                                         most common symptom, is indicative of a very wide variety              sults; and (v) Finally, we describe a triaging use case and
                                         of infections; combining it with a cough reduces the possi-            demonstrate how our model can increase the testing capac-
                                         ble etiologies to acute respiratory infections (ARIs), which           ity of the public health system by 43%.
                                         affect millions at any given time. Additionally, the majority
                                         of COVID-19 positive individuals show none of the above                        2    Motivation and Related Work
                                            ∗
                                              These authors contributed equally to this research                Sound has long been used as an indicator for health.
                                            †
                                              Work done at Wadhwani AI as a Visiting Researcher                 Skilled physicians often use stethoscopes to detect the
                                         Copyright c 2021, Association for the Advancement of Artificial        presence of abnormalities by listening to sound from the
                                         Intelligence (www.aaai.org). All rights reserved.                      heart or the lungs. Machine learning (ML), in particu-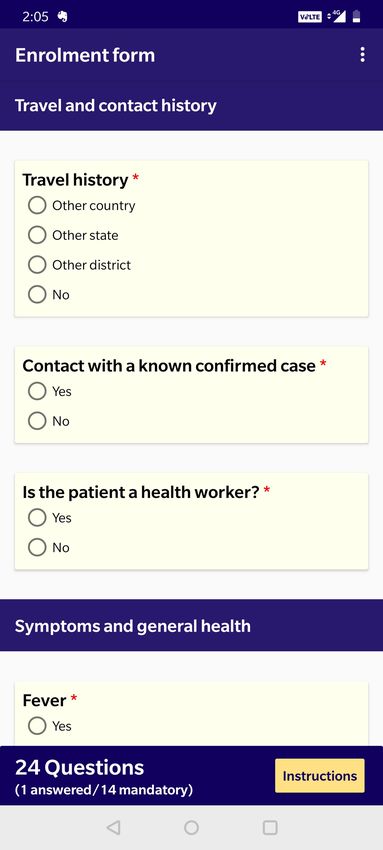
Yes
                                                                                COVID-19                     RT-PCR test
                                                                                 or not                      recommended

                                                                                          No

                                                                               No RT-PCR
    Record cough sounds on a               Our AI model predicts the           test required
           phone app                      presence of COVID-19 from
                                              cough sounds alone

Figure 1: Cough Against Covid. An overview of our non-invasive, AI-based pre-screening tool that determines COVID-19
status from solicited-cough sounds. With the AI model set to an operating point of high sensitivity, an individual is referred
for gold standard RT-PCR test if they triage positive for risk of COVID-19. At 5% disease prevalence, this triaging tool would
increase the effective testing capacity by 43%.

lar, deep learning, has shown great promise in automated          sourced dataset (Sharma et al. 2020) of cough, breathing and
audio interpretation to screen for various diseases like          voice sounds was also recently released to enable sound as a
asthma (Oletic and Bilas 2016) and wheezing (Li et al.            medium for point-of-care diagnosis for COVID-19.
2017) using sounds from smartphones and wearables. Open-             Apart from (Imran et al. 2020) and (Brown et al.
source datasets like AudioSet (Gemmeke et al. 2017) and           2020), none of the previous efforts actually detect COVID-
Freesound Database (Fonseca et al. 2018) have further             19 from cough sounds alone. (Imran et al. 2020) covers
boosted research in this domain.                                  only 48 COVID-19 tested patients, while our dataset con-
   Automated reading of chest X-rays and CT scans (Wang           sists of 3,621 individuals with 2,001 COVID-19 tested pos-
and Wong 2020; Hall et al. 2020; Gozes et al. 2020; He            itives. The dataset used in (Brown et al. 2020) was en-
et al. 2020) have been widely studied along with typically        tirely crowdsourced with the COVID-19 status being self-
collected healthcare data (Soltan et al. 2020) to screen for      reported, whereas our dataset consists of labels directly re-
COVID-19. Respiratory sounds have also been explored for          ceived from healthcare authorities. Further, we show that
diagnosis (see (Deshpande and Schuller 2020) for a nice           COVID-19 can be detected from the cough sounds of asymp-
overview). Some research has explored the use of digital          tomatic patients as well. Unlike previous works, we also
stethoscope data from lung auscultation as a diagnostic sig-      demonstrate how label smoothing can help tackle the inher-
nal for COVID-19 (hui Huang et al. 2020). The use of              ent label noise due to the sensitivity of the RT-PCR test and
human-generated audio as a biomarker offers enormous po-          improve model calibration.
tential for early diagnosis, as well as for affordable and ac-
cessible solutions which could be rolled out at scale through                              3    Data
commodity devices.
                                                                  In this section we outline our data collection pipeline as well
   Cough is a symptom of many respiratory infections.
                                                                  as the demographics and properties of the gathered data. We
Triaging solely from cough sounds can be simple oper-
                                                                  further describe the subset of the data used for the analysis
ationally and help reduce load on the healthcare system.
                                                                  in this paper.
(Saba 2018; Botha et al. 2018) detect tuberculosis (TB)
from cough sounds, while (Larson et al. 2012) track the              We note here that we use two types of data in this work.
recovery of TB patients using cough detection. A prelimi-         First, we describe data collected from testing facilities and
nary study on detecting COVID-19 from coughs uses a co-           isolation wards for COVID-19 in various states of India,
hort of 48 COVID-19 tested patients versus other pathology        constituting the largest dataset of tested COVID-19 cough
coughs to train a combination of deep and shallow mod-            sounds (to the best of our knowledge). Next, we mention
els (Imran et al. 2020). Other valuable work in this do-          several open-source cough datasets that we use for pretrain-
main investigates a similar problem (Brown et al. 2020),          ing our deep networks.
wherein a binary COVID-19 prediction model is trained on
a dataset of crowdsourced, unconstrained worldwide coughs         3.1   COVID-19 cough dataset
and breathing sounds. In (Han et al. 2020) speech record-         Data collection We create a dataset of cough sounds from
ings from COVID-19 hospital patients are analyzed to au-          COVID-19 tested individuals from numerous testing facili-
tomatically categorize the health state of patients. A crowd-     ties and isolation wards throughout India (collection is on-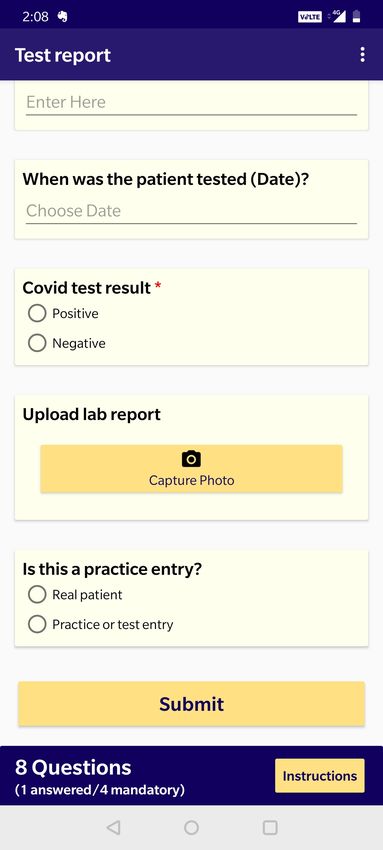
Disease Status Sex Location Age (years)
500 300
Positive Positive 200 Positive
600
Negative 250 Negative Negative
400 175
No. of individuals
500
150
200
400 300 125
150
300 100
200
100 75
200
100 50
100 50
25
0 0 0 0
Negative Positive Female Male F1 F2 F3 F4 (0, 19] (19, 29] (29, 39] (39, 49] (49, 59] (59, 69] (69, 79] (79, 89] (89, 100]
Figure 2: Dataset demographics. From left to right – distribution of the number of individuals based on COVID-19 test result,
sex, location and age.
Duration (seconds) cility protocol. For each individual, we collect 3 sepa-
120 Mean: 3.39 sec rately recorded audio samples of the individual coughing,
No. of cough samples
100
an audio recording of the individual reciting the num-
bers from one to ten and a single recording of the in-
80
dividual breathing deeply. Note here that these are non-
60
spontaneous coughs, i.e. the individual is asked to cough
40 into the microphone in each case, even if they do not nat-
20 urally have a cough as a symptom.
0
0.0 2.5 5.0 7.5 10.0 12.5 15.0 17.5 3. Testing: RT-PCR test results are obtained from the re-
spective facility’s authorized nodal officers.
Figure 3: Duration statistics. Distribution of the duration of
the cough audio recordings. For each stage, we utilise a separate application interface.
Screenshots for the apps and further details are provided in
suppl. material. We note here that the COVID-19 test result
going). Testing facilities provide data for both positively and is not known at the time of audio cough recording – minimis-
negatively tested individuals, whereas isolation wards are ing collection bias, and that all data collection is performed
meant only for those who have already tested positive. For in environments in which potential solutions may actually
isolation wards, we only consider individuals within the first be used.
10 days after an initial positive result through RT-PCR. Our
eligibility criteria also requires that individuals should be in- Dataset As of August 16th, 2020 our data collection ef-
dependently mobile and be able to provide cough samples forts have yielded a dataset of 3,621 individuals, of which
comfortably. The data collector is required to wear a PPE 2,001 have tested positive. In this paper we focus on a cu-
kit prior to initiating conversation, and maintain a distance rated set of the collected data (until 20 July, 2020). We also
of 5 feet at all times from the participant. The participant restrict our models to use only the cough sounds (and not
is required to wear a triple layer mask and provide written the voice or breathing samples). Henceforth, all results and
consent. For minors, consent is obtained from a legally ac- statistics will be reported on this data used in our analysis
ceptable representative. Our data collection and study have after filtering and manual verification (details of which are
been approved by a number of local and regional ethics com- provided in the suppl. material). Our curated dataset con-
mittees 1 . sists of 3,117 cough sounds from 1,039 individuals. We aim
For each individual, our data collection procedure consists to release some or all of the data publicly to the research
of the following 3 key stages: community. Figures 2 and 3 show distribution statistics of
1. Subject enrollment: In the first stage, subjects are en- the data. Out of 1,039 individuals, 376 have a positive RT-
rolled with metadata such as demographic information PCR test result (Fig. 2, left) and the sex breakdown is 760
(including self-reported age and sex), the presence of male and 279 female. (Fig. 2, center-left). (Fig. 2, center-
symptoms such as dyspnea (shortness of breath), cough right) highlights the distribution by the facility from which
and fever, recent travel history, contact with known the data was collected (we use data from 4 facilities, F1-F4).
COVID-19 positive individuals, body temperature, and (Fig. 2, right) shows the age distribution, which is skewed
any comorbidities or habits such as smoking that might towards middle-aged individuals (between 20-40 years of
render them more vulnerable. age), while Fig. 3 shows the distribution of the lengths of
2. Cough-sound recording: Since cough is an aerosol gen- our cough samples. Fig 4 shows the distribution of symp-
erating procedure, recordings are collected in a desig- toms recorded for dyspnea, cough and fever. Interestingly,
nated space which is frequently disinfected as per fa- note that most individuals are asymptomatic. In our dataset,
the most common single symptom among COVID-19 posi-
1 tive individuals is fever while that among negatives is cough,
The names of the precise committees have been omitted to pre-
serve anonymity, and will be added to any future versions. followed by an intersection of cough and fever.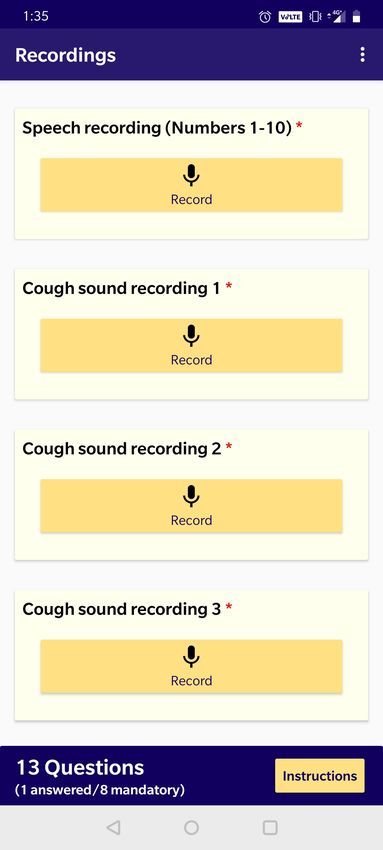
Positive          ing of numerous respiratory sounds. 2 We use 11,687 audio
                                                                  segments of which 2,486 are coughs.
                                                                  3. Coswara (Sharma et al. 2020): This is a curated dataset

                 Intersection Size
                                                                  of coughs collected via worldwide crowd sourcing using
                                                                  a website application3 . The dataset contains samples from
                                                                  570 individuals, with 9 voice samples for each individual,
                                                                  including breathing sounds (fast and slow), cough sounds
                                                                  (heavy and shallow), vowel sounds, and counting (fast and
                                                                  slow). In total the dataset consists of 2,034 cough sam-
                                                                  ples and 7,115 non-cough samples. We are unaware of the
                                                                  COVID-19 status of the coughs in this dataset as it was col-
                                                                  lected after the pandemic broke out.

      Set size
                                                                                            4    Method
                                                  Negative        Inspired by the recent success of CNNs applied to audio in-
                                                                  puts (Hershey et al. 2016), we develop an end-to-end CNN-
                                                                  based framework that ingests audio samples and directly
                 Intersection Size

                                                                  predicts a binary classification label indicating the probabil-
                                                                  ity of the presence of COVID-19. In the following sections,
                                                                  we outline details of the input, model architecture, training
                                                                  strategies employed and inference.

                                                                  4.1    Input
                                                                  During training we randomly sample a 2-second segment
                                                                  of audio from the entire cough segment. We use short-term
                                                                  magnitude spectrograms as input to our CNN model. All au-
                                                                  dio is first converted to single-channel, 16-bit streams at a
      Set size                                                    16kHz sampling rate for consistency. Spectrograms are then
                                                                  generated in a sliding window fashion using a hamming win-
Figure 4: Symptom co-occurrence statistics. We show statis-       dow of width 32ms and hop 10ms with a 512-point FFT.
tics for individuals with an RT-PCR positive (top) and neg-       This gives spectrograms of size 257 x 201 for 2 seconds of
ative (bottom) test for the following symptoms: dyspnea           audio. The resulting spectrogram is integrated into 64 mel-
(shortness of breath), cough and fever.                           spaced frequency bins with minimum frequency 125Hz and
                                                                  maximum frequency 7.5KHz, and the magnitude of each bin
                                                                  is log transformed. This gives log-melspectrogram patches
                                                                  of 64 x 201 bins that form the input to all classifiers. Finally,
3.2    Open-source non-COVID cough datasets                       the input is rescaled by the largest magnitude over the train-
                                                                  ing set to bring the inputs between -1 and 1.

In the absence of explicit feature engineering, deep Convolu-     4.2    CNN architecture
tional Neural Networks (CNNs) are data hungry relying on          An overview of our CNN architecture can be seen in Fig. 5.
thousands of manually annotated training examples. Given          As a backbone for our CNN model we use the popular
the challenges of training deep CNNs from scratch on small        ResNet-18 model consisting of residual convolution lay-
datasets, we collect a larger dataset of cough samples from       ers (He et al. 2016), followed by adaptive pooling layer in
various public datasets (Fonseca et al. 2018; Al Hossain          both the time and frequency dimensions. Finally, the out-
et al. 2020; Sharma et al. 2020) which we use to pretrain our     put is passed through 2 linear layers and then a final predic-
model. In total we obtain 31,909 sounds segments, of which        tive layer with 2 neurons and a softmax activation function,
27,116 are non-cough respiratory sounds (wheezes, crackles        which is used to predict whether the input cough sample has
or breathing) or human speech, and 4,793 are cough sounds.        COVID-19. Dropout (Srivastava et al. 2014) and the ReLU
The various data sources and their statistics are as follows:     activation function are used after all linear layers.
1. FreeSound Database 2018 (Fonseca et al. 2018): This
is an audio dataset consisting of a total of 11,073 audio files   4.3    Training strategies
annotated with 41 possible labels, of which 273 samples           Augmentation Given the medium size of our dataset, we
are labelled as ‘cough’. We believe the cough sounds cor-         adopt the standard practise of data augmentation, applying
respond to COVID-19 negative individuals as these sounds
were recorded well before the COVID-19 pandemic.                     2
                                                                       Including speech, coughs, sneezes, sniffles, silence, breathing,
2. Flusense (Al Hossain et al. 2020): This is a subset of         gasps, throat-clearing, vomit, hiccups, burps, snores, and wheezes.
                                                                     3
Google’s Audioset dataset (Gemmeke et al. 2017), consist-              https://coswara.iisc.ac.in/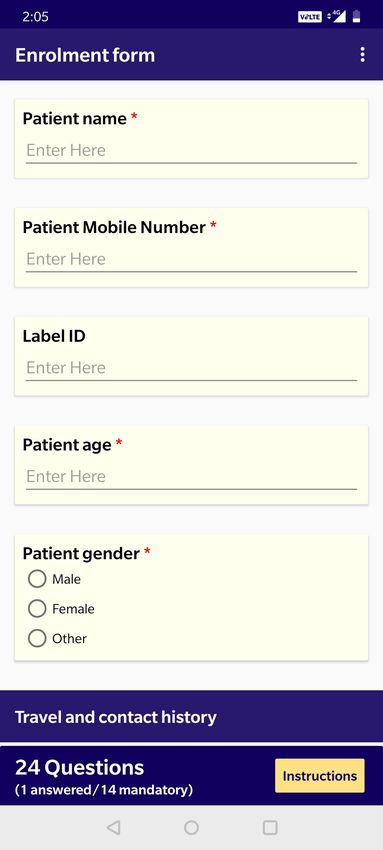
Input
                                                                               Adaptive         Dropout         Dropout
                                                                                average         + FC +          + FC +          Dropout +
                                                                                pooling          ReLU            ReLU              FC

                                                                                                                                      COVID-19 or
                                                                                                                                         not
                1 x 64 x 201            ResNet18                 512 x 2 x 7              512             256             128

Figure 5: Network architecture. An input cough spectrogram goes through a deep CNN to predict the presence of COVID-19.

transformations to our data to boost performance and in-                 0.95 after every 10 epochs. We use a batch size of 32 and
crease robustness. We perform data augmentation online,                  train for a total of 110 epochs. Label smoothing is randomly
i.e. transformations are applied randomly to segments dur-               applied between 0.1 and 0.3. Our model is implemented in
ing training. We perform two types of augmentation: (1)                  PyTorch (Paszke et al. 2019) (version 1.6.0) and trained us-
the addition of external background environmental sounds                 ing a single Tesla K80 GPU on the Linux operating system.
from the ESC-50 dataset (Piczak 2015), and (2) time and fre-             The same seed has been set for all our experiments (more
quency masking of the spectrogram input (Park et al. 2019).              details can be found in suppl. material). We used Weights &
ESC-50 (Piczak 2015) consists of 2,000 environmental au-                 Biases (Biewald 2020) (version 0.9.1) for experiment track-
dio recordings from 50 environmental classes. At train time,             ing and visualisation.
we randomly select a single noise sample and modulate the
amplitude by a random factor between 0.4 and 0.75, before                4.4   Inference
adding it to the input cough spectrogram.                                Every cough sample is divided into 2-second segments us-
                                                                         ing a sliding window with a hop length of 500ms. We take
Pre-training Our model architecture is first pretrained on
                                                                         the median over the softmax outputs for all the segments to
the open source cough datasets outlined in Sec. 3.2. We par-
                                                                         obtain the prediction for a single sample. We pad inputs less
tition the data into train and validation (the validation set
                                                                         than 2 seconds with zeros. A comparison of different aggre-
consists of 648 cough and 2882 non-cough sounds), and
                                                                         gation methods have been provided in suppl. material.
train our model to simply predict the presence of a cough
or not (cough detection). Note that this is a proxy task and             Individual-level aggregation For each individual in the
we use this simply to pretrain our model and learn a good                dataset, we have three cough samples. We consider the max
initialisation of weights.                                               of the predicted probabilities of the three cough samples to
    We first initialise the ResNet-18 backbone with weights              obtain the prediction for a single individual. All performance
obtained from pretraining on ImageNet (the additional lin-               metrics have been reported at the individual level.
ear layers after are initialised randomly). Given the highly
unbalanced nature of the pretraining data, we upsample the                                5       Experimental Evaluation
minority class to ensure that each batch has the equal num-              5.1   Tasks
ber of cough and non-cough samples. AdamW (Loshchilov
and Hutter 2017) is used as the optimizer with a learning                Although we train our model on the entire dataset once, we
rate of 1e-5 and weight decay 1e-4. The model is trained for             focus on three clinically meaningful evaluations:
200 epochs and on the proxy cough vs. non-cough task, we                 • Task 1: Distinguish individuals tested positive from indi-
achieve an AUC of 0.98 on the validation set.                              viduals tested negative for COVID-19.
Label smoothing For our final task of COVID-19 classifi-                 • Task 2: Distinguish individuals tested positive, from in-
cation, we note here that the ground truth labels come solely              dividuals tested negative for COVID-19, specifically for
from the RT-PCR test for COVID-19. Even though this test                   individuals that do not report cough as a symptom. We
is widely used, it is known to make mistakes, i.e. it is esti-             refer to this set as Asymptomatic (no C).
mated to have a sensitivity of almost 70% at a specificity of            • Task 3: Distinguish individuals tested positive, from in-
95% (Watson, Whiting, and Brush 2020). Hence it is possi-                  dividuals tested negative for COVID-19, specifically for
ble that a number of cough samples may have the wrong la-                  individuals that do not report cough, fever or breathless-
bel, and penalising our model for making mistakes on these                 ness as a symptom. We refer to this set as Asymptomatic
samples can harm training. Hence we apply a standard label                 (no C/F/D).
smoothing technique (Mller, Kornblith, and Hinton 2019)
                                                                           The number of cough samples in the validation set for
during training for each instance. Label smoothing is also
                                                                         each task are provided in Table 1. Fig. 7b shows the com-
known to improve model calibration (Mller, Kornblith, and
                                                                         parison in performance across the three tasks.
Hinton 2019). Results are provided in Sec. 6.2.
Implementation details For cough classification, we use                  5.2   Triple-stratified cross-validation
the pretrained weights from the cough non-cough pretrain-                In order to create a fair evaluation, we (1) create training and
ing task to initialize the model. SGD is used as the opti-               validation sets from disjoint individuals, (2) we balance the
mizer, with an initial learning rate of 0.001 and a decay of             number of positive and negatives obtained from each facility
Task    Positive    Negative                      5.6               Ablation analysis
                 (1)     87-102      108-117
                                                                   We also quantify the effect of several aspects of our train-
                 (2)     57-75       78-105                        ing pipeline, notably - pretraining, label smoothing and the
                 (3)     45-66       69-93                         length of the input segment. We experiment with two seg-
                                                                   ment lengths - 1 second and 2 seconds. For the model trained
Table 1: Dataset statistics per task. Number of cough sam-         on 1-second input segments, we perform hyperparameter
ples in the validation set for each task. Since we perform 5-      tuning again. Results for all ablation analysis are provided
fold validation, we show the range from min-max. Note that         in Sec. 6.
the precise number of samples varies across folds as we se-
lect 10% of the total dataset but ensure that the validation set
is balanced per facility. Note that each individual has three                                                       6          Discussion
cough samples.                                                     Fig. 6a shows that the CNN-based model outperforms all
                                                                   shallow models by atleast 7% in terms of AUC. We also per-
                                                                   form a statistical significance analysis of the results of our
in the validation set, to ensure that we are not measuring a       model. We conduct a t-test with the Null Hypothesis that
facility specific bias, and (3) we upsample the minority class     there is no COVID-19 signature in the cough sounds and the
samples per facility in the train set (facility-wise class dis-    results were found to be statistically significant, p < 1e − 3,
tribution has been shown in Fig. 2). We split our dataset into     95% confidence interval (CI) 0.61—0.83.
train and validation sets of approximately 90%:10% ratio,
and following standard practise for ML methods on small            6.1               Effect of ensembling
datasets, perform 5-fold cross-validation.                         It is widely known that ensembling diverse models can im-
                                                                   prove performance, even if some models perform worse than
5.3   Evaluation metrics                                           others individually (Sagi and Rokach 2018). Fig. 7a empir-
                                                                   ically validates this for our task by showing that ensem-
We report several standard evaluation metrics such as the          bling the deep and shallow models improves performance
Receiver Operating Characteristic - Area Under Curve               compared to any of the individual models. This also indi-
(ROC-AUC), Specificity (1 - False Positive Rate (FPR)), and        cates that there is further room for performance improve-
Sensitivity (also known as True Positive Rate (TPR)). Since        ment through better ensembling techniques and using more
this solution is meant to be used as a triaging tool, high sen-    diverse models.
sitivity is important. Hence, we report the best specificity
at 90% sensitivity. We report mean and standard deviation                             Comparison with Shallow Models                                          Ablation on Length of Segments
                                                                         1.0                                                                     1.0
across all 5 cross-validation folds. For fairness, all hyperpa-
rameters are set on the first fold and applied, as is, to other          0.8                                                                     0.8

folds, including epoch selection.
                                                                         0.6                                                                     0.6

5.4   Comparison to shallow baselines
                                                                   TPR

                                                                                                                                           TPR

                                                                         0.4                                                                     0.4

We also compare our CNN-based model to shallow clas-                                                       ResNet-18 (AUC = 0.68 ± 0.07)
sifiers using hand-crafted audio features. We experiment                 0.2
                                                                                                           GBC (AUC = 0.60 ± 0.04)
                                                                                                           XGB (AUC = 0.61 ± 0.07)
                                                                                                                                                 0.2

with the following classifiers: (1) Logistic Regression (LR),                                              SVM (AUC = 0.60 ± 0.04)
                                                                                                           LR (AUC = 0.55 ± 0.06)
                                                                                                                                                                                         2-sec (AUC = 0.68 ± 0.07)
                                                                                                                                                                                         1-sec (AUC = 0.61 ± 0.07)

(2) Gradient Boosting Trees (3) Extreme Gradient Boosting                0.0

                                                                               0.0    0.2      0.4
                                                                                                           Random (AUC = 0.50)

                                                                                                            0.6          0.8         1.0
                                                                                                                                                 0.0

                                                                                                                                                       0.0   0.2       0.4         0.6
                                                                                                                                                                                         Random (AUC = 0.50)

                                                                                                                                                                                                  0.8          1.0
(XGBoost) and (4) Support Vector Machines (SVMs). As                                                 FPR                                                                     FPR

input to the classifiers, we use a range of features such as the               (a) Shallow models vs CNN                                               (b) 1-sec vs 2-sec segments
tempo, RMS energy and MFCCs (see Sec. 4.1 from (Brown
et al. 2020) for an exhaustive list of the features used.) For     Figure 6: Ablation results. Comparison of ROC curves
all methods, we follow the preprocessing design choices            across (a) different model families - ResNet-18 outperforms
adopted by (Brown et al. 2020). We optimize the hyperpa-           other shallow baselines; (b) different segment lengths. 2-
rameters following the same procedure outlined in 5.3.             second is found to be the optimal segment length

5.5   Stacked ensemble
We ensemble the individual-level predictions from ResNet-          6.2               Effect of label smoothing
18 (both with and without label smoothing) and the XG-             The effect of applying label smoothing has been reported
Boost classifier (described in detail in Sec. 5.4) using           in Table 2. Besides improving AUC, label smoothing also
Stacked Regression (Van der Laan, Polley, and Hubbard              improves the specificity at 90% sensitivity. This shows that
2007). The stacked regressor is a XGBoost classifier using         at the required operating point (threshold on the softmax
the predicted probabilities from each of the above models          scores) for a triaging tool, the model is able to classify better
as features. The hyperparameters for the regressor are men-        with smoothened labels. This suggests that explicitly dealing
tioned in the suppl. material. We report performance with          with label noise can improve performance. We also empiri-
and without the ensemble (Fig. 7a).                                cally verify that label smoothing improves model calibration
Ensembling Deep and Classical Models Symptomatic vs Asymptomatic Individuals
1.0 1.0 the Null Hypothesis that there is no COVID-19 signature in
the cough sounds of asymptomatic patients and the results
0.8 0.8 were found to be statistically significant, p < 1e − 2.
0.6 0.6
6.6 Performance across sex and location
TPR
TPR
0.4 0.4
While we note that our dataset contains more males than
females, there is no obvious bias in COVID-19 test results
0.2 0.2
Overall (AUC = 0.72 ± 0.09)
Symptomatic (C) (AUC = 0.79 ± 0.11)
(Fig. 2), and performance is similar for both male (0.71 ±
Stacked Ensemble (AUC = 0.72 ± 0.09)
ResNet-18 (AUC = 0.68 ± 0.07)
Asymptomatic (No C) (AUC = 0.69 ± 0.09)
Asymptomatic (No C/F/D) (AUC = 0.67 ± 0.09)
0.11) and female (0.72 ± 0.11) individuals.
0.0 Random (AUC = 0.50) 0.0 Random (AUC = 0.50)
Samples collected from different locations can have dif-
0.0 0.2 0.4 0.6 0.8 1.0 0.0 0.2 0.4 0.6 0.8 1.0
FPR FPR
ferent label distributions. For example, testing facilities (F1,
(a) Ensembling (b) Asymptomatic individuals F3 and F4) tend to have predominantly COVID-19 negatives
while isolation wards (F2) tends to contain COVID-19 pos-
Figure 7: Classification results. Comparison of ROC curves itives (Fig. 2). Naively training a classifier on this combined
(a) for our best model obtained by ensembling a shallow dataset would lead to significantly inflated performance be-
model with the deep model. (b) for symptomatic and asymp- cause it could simply learn a location classifier instead of a
tomatic individuals: C - cough, F - fever, D - dyspnea (short- COVID-19 cough classifier. This is a known phenomenon in
ness of breath). Our model is able to identify COVID-19 deep learning and medical imaging (Badgeley et al. 2019)
from the cough sounds of asymptomatic individuals as well. (Wachinger et al. 2019). To address this issue, we carefully
constructed our validation set to contain only testing facili-
ties with equal number of positive and negative samples per
(Mller, Kornblith, and Hinton 2019) as it drives the optimal location. Future work will explore algorithmic mitigation by
threshold for COVID-19 classification much closer to 0.5. applying techniques such as (Zhang, Lemoine, and Mitchell
2018).
Model AUC Specificity Threshold
with LS 0.68 ± 0.07 0.31 ± 0.13 0.422 ± 0.062 7 Use Case: COVID-19 Triaging Tool
no LS 0.65 ± 0.08 0.27 ± 0.11 0.002 ± 0.002
In India alone, as of the 21st of August, 2020, there have
Table 2: Effect of label smoothing. Label smoothing im- been over 33M COVID19 RT-PCR tests performed (ICMR
proves specificity at 90% sensitivity and model calibration. 2020). While the current testing capacity is 800k/day, the
test positivity rate (TPR) has been increasing at a steady
pace, indicating that there is an urgent need for testing to be
ramped up even further. The ability to ramp up tests, how-
6.3 Effect of pre-training ever, is significantly hindered by the limited supply of testing
Table 3 shows the utility of using pretrained weights. Pre- kits and other operational requirements such as trained staff
training improves the mean AUC by 17%, showing it’s im- and lab infrastructure. This has led to an increased urgency
portance in dealing with small or medium sized datasets like for accurate, quick and non-invasive triaging, where individ-
ours. uals most likely to be determined positive for COVID19 are
tested as a priority.
Model AUC To address this, we propose a triaging tool that could be
with pretraining 0.68 ± 0.07 used by both individuals and health care officials. We pick
no pretraining 0.51 ± 0.07 the threshold of the model such that we have a high sensitiv-
ity of 90% which is desirable for a triaging tool. At this sen-
Table 3: Effect of pre-training. Pre-training greatly improves sitivity our best model has a specificity of 31%. As shown in
model performance. Fig. 1, such a model can be used to reliably detect COVID-
19 negative individuals while we refer the positives for a
confirmatory RT-PCR test. In this way, we increase the test-
6.4 Optimal segment length ing capacity by 43% (a 1.43x lift) when we assume a dis-
Fig. 6b indicates that using segments of 2-seconds performs ease prevalence of 5%. In Table 4, we also show the relative
better than 1-second segments. We suspect that this happens gains at different prevalence levels. Precise calculations can
because our dataset contains several samples with silence be found in the suppl. material.
at the start and the end, increasing the probability of noisy
labels being assigned to random crops during training. 8 Conclusion and Future Work
In this paper, we describe a non-invasive, machine learning
6.5 Asymptomatic individuals based triaging tool for COVID-19. We collect and curate
Fig. 7b shows the performance for asymptomatics. We see a large dataset of cough sounds with RT-PCR test results
that while our model performs significantly better for symp- for thousands of individuals, and show with statistical ev-
tomatic individuals, performance for asymptomatic individ- idence that our model can detect COVID-19 in the cough
uals is still far above random. A t-test was conducted with sounds from our dataset, even for patients that are entirelyPrevalence Testing Capacity All this while working at the epicenters (hospitals and test-
1% +44% ing sites) of this global pandemic.
5% +43%
10% +41% References
30% +33%
Al Hossain, F.; Lover, A. A.; Corey, G. A.; Reich, N. G.;
Table 4: Utility of our triaging tool. We show the increase in and Rahman, T. 2020. FluSense: a contactless syndromic
the effective testing capacity of a system at different disease surveillance platform for influenza-like illness in hospital
prevalence levels. waiting areas. Proceedings of the ACM on Interactive, Mo-
bile, Wearable and Ubiquitous Technologies 4(1): 1–28.
Badgeley, M. A.; Zech, J. R.; Oakden-Rayner, L.; Glicks-
asymptomatic. At current model performance, our tool can berg, B. S.; Liu, M.; Gale, W.; McConnell, M. V.; Percha,
improve the testing capacity of a healthcare system by 43%. B.; Snyder, T. M.; and Dudley, J. T. 2019. Deep learning
Future work will involve incorporating other inputs from our predicts hip fracture using confounding patient and health-
dataset to the model, including breathing sounds, voice sam- care variables. NPJ digital medicine 2(1): 1–10.
ples and symptoms. Our data collection is ongoing, and sub-
sequent models will be trained on individuals beyond the Biewald, L. 2020. Experiment Tracking with Weights and
subset in this study. We will also explore fast and computa- Biases. URL https://www.wandb.com/. Software available
tionally efficient inference, to enable COVID-19 testing on from wandb.com.
smartphones. This will enable large sections of the popula- Botha, G.; Theron, G.; Warren, R.; Klopper, M.; Dheda, K.;
tion to self-screen, support proactive testing and allow con- Van Helden, P.; and Niesler, T. 2018. Detection of tuber-
tinuous monitoring. culosis by automatic cough sound analysis. Physiological
measurement 39(4): 045005.
9 Acknowledgments
Brown, C.; Chauhan, J.; Grammenos, A.; Han, J.; Hasthana-
We are thankful to AWS for covering the entire cost of the sombat, A.; Spathis, D.; Xia, T.; Cicuta, P.; and Mascolo,
GPUs used for this work. We also thank James Zhou (Stan- C. 2020. Exploring Automatic Diagnosis of COVID-19
ford), and Peter Small) and Puneet Dewan (Global Health from Crowdsourced Respiratory Sound Data. arXiv preprint
Labs) for very helpful discussions, inputs, and evangelism. arXiv:2006.05919 .
We are grateful to Ankit Baghel, Anoop Manjunath and
Arda Sahiner from Stanford for helping with curating the Daniel P. Oran, E. J. T. 0. Prevalence of Asymptomatic
cough pre-training dataset. SARS-CoV-2 Infection. Annals of Internal Medicine 0(0):
null. doi:10.7326/M20-3012. URL https://doi.org/10.7326/
We also want to thank the Governments of Bihar and
M20-3012. PMID: 32491919.
Odisha, and the Municipal Corporation of Greater Mumbai
for extending necessary approvals and facilitating activities Day, M. 2020. Covid-19: four fifths of cases are asymp-
for data collection in respective geographies. tomatic, China figures indicate. BMJ 369. doi:10.1136/
We are grateful to Ashfaq Bhat and his team at Norway In- bmj.m1375. URL https://www.bmj.com/content/369/bmj.
dia Partnership Initiative for supporting data collection and m1375.
advocacy efforts in the state of Bihar and Odisha. Ravikant
Deshpande, G.; and Schuller, B. 2020. An Overview on Au-
Singh and his team at Doctors for You for playing a criti-
dio, Signal, Speech, & Language Processing for COVID-19.
cal role in initiating data collection, getting IRB approvals
arXiv preprint arXiv:2005.08579 .
and managing field operations. Pankaj Bhardwaj and Suman
Saurabh from Department of Community Medicine in All Fonseca, E.; Plakal, M.; Font, F.; Ellis, D. P.; Favory, X.;
India Institute of Medical sciences, Jodhpur for leading the Pons, J.; and Serra, X. 2018. General-purpose tagging
data collection efforts in the institute. of freesound audio with audioset labels: Task description,
We greatly appreciate the support of our lovely team dataset, and baseline. arXiv preprint arXiv:1807.09902 .
members at Wadhwani AI. Nikhil Velpanur played a key role
Gemmeke, J. F.; Ellis, D. P.; Freedman, D.; Jansen, A.;
helping early data collection, supported by Akshita Bhan-
Lawrence, W.; Moore, R. C.; Plakal, M.; and Ritter, M.
jdeo and Patanjali Pahwa. Puskar Pandey has been help-
2017. Audio set: An ontology and human-labeled dataset
ing ensure continued data collection. Bhavin Vadera pro-
for audio events. In 2017 IEEE International Conference
vided important support for data collection in additional
on Acoustics, Speech and Signal Processing (ICASSP), 776–
sites. Vishal Agarwal helped build essential digital tools for
780. IEEE.
data collection. Kalyani Shastry managed the entire logistics
and coordinated supplies needed for field data collection at Gozes, O.; Frid-Adar, M.; Greenspan, H.; Browning, P. D.;
various study sites. Zhang, H.; Ji, W.; Bernheim, A.; and Siegel, E. 2020. Rapid
And finally, we are humbled by the passion, hard work, ai development cycle for the coronavirus (covid-19) pan-
and dedication of our numerous field staff. They have en- demic: Initial results for automated detection & patient mon-
sured strict adherence of the safety protocols through the itoring using deep learning ct image analysis. arXiv preprint
data collection effort while maintaining high data quality. arXiv:2003.05037 .Hall, L. O.; Paul, R.; Goldgof, D. B.; and Goldgof, Larson, S.; Comina, G.; Gilman, R. H.; Tracey, B. H.;
G. M. 2020. Finding Covid-19 from Chest X-rays us- Bravard, M.; and López, J. W. 2012. Validation of an au-
ing Deep Learning on a Small Dataset. arXiv e-prints tomated cough detection algorithm for tracking recovery of
arXiv:2004.02060. pulmonary tuberculosis patients. PloS one 7(10): e46229.
Han, J.; Qian, K.; Song, M.; Yang, Z.; Ren, Z.; Liu, S.; Li, S.-H.; Lin, B.-S.; Tsai, C.-H.; Yang, C.-T.; and Lin, B.-
Liu, J.; Zheng, H.; Ji, W.; Koike, T.; et al. 2020. An Early S. 2017. Design of wearable breathing sound monitoring
Study on Intelligent Analysis of Speech under COVID-19: system for real-time wheeze detection. Sensors 17(1): 171.
Severity, Sleep Quality, Fatigue, and Anxiety. arXiv preprint Loshchilov, I.; and Hutter, F. 2017. Decoupled weight decay
arXiv:2005.00096 . regularization. arXiv preprint arXiv:1711.05101 .
He, K.; Zhang, X.; Ren, S.; and Sun, J. 2016. Deep resid- Mller, R.; Kornblith, S.; and Hinton, G. 2019. When Does
ual learning for image recognition. In Proceedings of the Label Smoothing Help?
IEEE conference on computer vision and pattern recogni-
tion, 770–778. Oletic, D.; and Bilas, V. 2016. Energy-efficient respiratory
sounds sensing for personal mobile asthma monitoring. Ieee
He, X.; Yang, X.; Zhang, S.; Zhao, J.; Zhang, Y.; Xing, sensors journal 16(23): 8295–8303.
E.; and Xie, P. 2020. Sample-Efficient Deep Learning for
Park, D. S.; Chan, W.; Zhang, Y.; Chiu, C.-C.; Zoph, B.;
COVID-19 Diagnosis Based on CT Scans. medRxiv doi:
Cubuk, E. D.; and Le, Q. V. 2019. Specaugment: A simple
10.1101/2020.04.13.20063941. URL https://www.medrxiv.
data augmentation method for automatic speech recognition.
org/content/early/2020/04/17/2020.04.13.20063941.
arXiv preprint arXiv:1904.08779 .
Hershey, S.; Chaudhuri, S.; Ellis, D. P. W.; Gemmeke, J. F.;
Paszke, A.; Gross, S.; Massa, F.; Lerer, A.; Bradbury, J.;
Jansen, A.; Moore, R. C.; Plakal, M.; Platt, D.; Saurous,
Chanan, G.; Killeen, T.; Lin, Z.; Gimelshein, N.; Antiga, L.;
R. A.; Seybold, B.; Slaney, M.; Weiss, R. J.; and Wilson,
et al. 2019. Pytorch: An imperative style, high-performance
K. 2016. CNN Architectures for Large-Scale Audio Classi-
deep learning library. In Advances in neural information
fication.
processing systems, 8026–8037.
Huang, C.; Wang, Y.; Li, X.; Ren, L.; Zhao, J.; Hu, Y.;
Piczak, K. J. 2015. ESC: Dataset for environmental sound
Zhang, L.; Fan, G.; Xu, J.; Gu, X.; Cheng, Z.; Yu, T.; Xia, J.;
classification. In Proceedings of the 23rd ACM international
Wei, Y.; Wu, W.; Xie, X.; Yin, W.; Li, H.; Liu, M.; Xiao,
conference on Multimedia, 1015–1018.
Y.; Gao, H.; Guo, L.; Xie, J.; Wang, G.; Jiang, R.; Gao,
Z.; Jin, Q.; Wang, J.; and Cao, B. 2020. Clinical features Saba, E. 2018. Techniques for Cough Sound Analysis. Ph.D.
of patients infected with 2019 novel coronavirus in Wuhan, thesis, University of Washington.
China. The Lancet 395(10223): 497 – 506. ISSN 0140- Sagi, O.; and Rokach, L. 2018. Ensemble learning: A survey.
6736. doi:https://doi.org/10.1016/S0140-6736(20)30183- Wiley Interdisciplinary Reviews: Data Mining and Knowl-
5. URL http://www.sciencedirect.com/science/article/pii/ edge Discovery 8(4): e1249.
S0140673620301835. Sharma, N.; Krishnan, P.; Kumar, R.; Ramoji, S.; Chetupalli,
hui Huang, Y.; jun Meng, S.; Zhang, Y.; sheng Wu, S.; S. R.; R., N.; Ghosh, P. K.; and Ganapathy, S. 2020. Coswara
Zhang, Y.; wei Zhang, Y.; xiang Ye, Y.; feng Wei, Q.; gui – A Database of Breathing, Cough, and Voice Sounds for
Zhao, N.; ping Jiang, J.; et al. 2020. The respiratory sound COVID-19 Diagnosis.
features of COVID-19 patients fill gaps between clinical Soltan, A. A.; Kouchaki, S.; Zhu, T.; Kiyasseh, D.; Tay-
data and screening methods. medRxiv . lor, T.; Hussain, Z. B.; Peto, T.; Brent, A. J.; Eyre,
ICMR. 2020. ICMR: SARS-CoV-2 (COVID-19) Testing D. W.; and Clifton, D. 2020. Artificial intelligence
Status. https://www.icmr.gov.in/. Accessed: 2020-08-21. driven assessment of routinely collected healthcare data
Imran, A.; Posokhova, I.; Qureshi, H. N.; Masood, U.; Riaz, is an effective screening test for COVID-19 in patients
S.; Ali, K.; John, C. N.; and Nabeel, M. 2020. AI4COVID- presenting to hospital. medRxiv doi:10.1101/2020.07.07.
19: AI enabled preliminary diagnosis for COVID-19 from 20148361. URL https://www.medrxiv.org/content/early/
cough samples via an app. arXiv preprint arXiv:2004.01275 2020/07/08/2020.07.07.20148361.
. Srivastava, N.; Hinton, G.; Krizhevsky, A.; Sutskever, I.; and
JHU. 2020. COVID-19 Dashboard by the Center for Sys- Salakhutdinov, R. 2014. Dropout: a simple way to prevent
tems Science and Engineering (CSSE) at Johns Hopkins neural networks from overfitting. The journal of machine
University (JHU). https://coronavirus.jhu.edu/map.html. learning research 15(1): 1929–1958.
Accessed: 2020-08-21. Van der Laan, M. J.; Polley, E. C.; and Hubbard, A. E. 2007.
Kucharski, A. J.; Klepac, P.; Conlan, A.; Kissler, S. M.; Super learner. Statistical applications in genetics and molec-
Tang, M.; Fry, H.; Gog, J.; and Edmunds, J. 2020. Ef- ular biology 6(1).
fectiveness of isolation, testing, contact tracing and phys- Wachinger, C.; Becker, B. G.; Rieckmann, A.; and Pölsterl,
ical distancing on reducing transmission of SARS-CoV- S. 2019. Quantifying confounding bias in neuroimaging
2 in different settings. medRxiv doi:10.1101/2020.04.23. datasets with causal inference. In International Conference
20077024. URL https://www.medrxiv.org/content/early/ on Medical Image Computing and Computer-Assisted Inter-
2020/04/29/2020.04.23.20077024. vention, 484–492. Springer.Wang, L.; and Wong, A. 2020. COVID-Net: A Tailored A Data
Deep Convolutional Neural Network Design for Detec- A.1 Collection
tion of COVID-19 Cases from Chest X-Ray Images. In
arXiv:2003.09871. Our data collection pipeline consists of the following stages:
(i) collection of individual specific meta data, (ii) recording
Watson, J.; Whiting, P. F.; and Brush, J. E. 2020. Interpreting of audio samples and finally (iii) obtaining the results of the
a covid-19 test result. BMJ 369. doi:10.1136/bmj.m1808. COVID-19 RT-PCR test. We achieve this through three sep-
URL https://www.bmj.com/content/369/bmj.m1808. arate application interfaces as shown in Fig. 8. The details
WHO. 2020a. Coronavirus disease 2019 (COVID-19) Situ- of data collected through these apps are enlisted below:
ation Report 46. https://www.who.int/docs/default-source/ • Personal and Demographic information: We collect the
coronaviruse/situation-reports/20200306-sitrep-46-covid- individual’s name, mobile number, age, location (facility)
19.pdf?sfvrsn=96b04adf 4#:∼:text=For%20COVID% and self-reported biological sex.
2D19%2C,infections%2C%20requiring%20ventilation.
• Health-related information: We collect the COVID-19
Accessed: 2020-08-21.
RT-PCR test result, body temperature and respiratory rate.
WHO. 2020b. Q&A on coronaviruses (COVID- We also note the presence of symptoms like fever, cough,
19). https://www.who.int/emergencies/diseases/novel- shortness of breath and number of days since these symp-
coronavirus-2019/question-and-answers-hub/q-a-detail/q- toms first appear, and any measures undertaken specifi-
a-coronaviruses. Accessed: 2020-08-21. cally for cough relief. Finally, we also ask individuals if
Zhang, B. H.; Lemoine, B.; and Mitchell, M. 2018. Mitigat- they have any co-morbidities.
ing unwanted biases with adversarial learning. In Proceed- • Additional metadata: Additional data collected includes
ings of the 2018 AAAI/ACM Conference on AI, Ethics, and location (name of the facility, City and State), travel his-
Society, 335–340. tory of the individual, information about contact with
confirmed COVID-19 cases, whether they are a health
worker, and information about habits such as smoking,
tobacco.
A.2 Preparation
Record linkage : Since we use three different apps to col-
lect data at different points in time, we need to link data
across all three for a single individual. We achieve this
through a semi-manual method that primarily uses fuzzy
matching of each individual’s name and phone number. Note
that this process is non-trivial to automate since there are in-
stances of wrongly entered texts, families sharing the same
phone number etc. After the correspondence matching, we
remove all identifiers from the dataset.
Manual validation : We manually validate each audio
recording to check for errors in data collection. Specifically,
for each cough, speech and breathing sample, we verify that
the required sounds are actually present in the audio (e.g.
cough sounds actually contain coughing). We only select the
entries that pass this manual validation stage to create our
usable dataset.
A.3 Splits for Cross Validation
Our dataset has a total of 1,039 individuals. We create 5 non-
overlapping folds such that the validation set in each fold
contains an equal number of positives and negatives from
each facility. As noted in Sec. 6.6. of the paper, samples col-
lected from different locations can have different label distri-
butions. For example, testing facilities (F1, F3 and F4) tend
to have predominantly COVID-19 negatives while isolation
wards (F2) tends to contain COVID-19 positives (Fig. 2). In
order to test that our model is not simply learning a facility
classifier, we carefully curate the validation sets. We only
consider data from the testing facilities F1 and F3 in the val-
idation set. We do not test on facility F4 because of the small
number of data samples obtained from this facility.(a) Enrollment app (b) Audio Recording app (c) Test result app
Figure 8: Application Interfaces used in data collection. Demographic, symptom and other health-related metadata are collected
through (a) Our Enrollment app. Audio recordings are collected through (b) the Recording app and RT-PCR test results are
uploaded for each patient using our (c) Test result app.
B Method predictions to be between 0 and 1, we rank the predictions
B.1 Reproducibility instead of using the actual predicted probabilities. This
gives us a minor performance lift from 0.680 to 0.686.
We set the seed as 42 for all packages that involve any ran-
domness: PyTorch (torch.cuda.manual seed all, • Stacked Ensemble: As described in Sec. 5.5, we use
torch.manual seed), random (random.seed) and XGBoost on top of the predictions from 3 models to
numpy (np.random.seed). This seed is set identically improve the AUC from 0.68 to 0.72. The hyperpa-
across all experiments. rameters used for XGBoost are: max depth=10,
learning rate=0.1, n estimators=5000,
B.2 Inference scale pos weight=4000/pos ratio,
File-level aggregation Table 5 shows a comparison of var- min child weight=50, gamma=0.05,
ious file-level aggregation methods (described in Sec. 4.4). reg lambda=100, where pos ratio = 0.1 is
Note that these numbers are without individual-level aggre- the ratio of the number of positive samples to negative
gation. Both median and mean perform equally well. samples. The description of these parameters are given
below:
Individual-level aggregation Table. 5 shows the compar-
ison of various individual-level aggregation methods (Sec. – max depth: Maximum tree depth for base learners
4.4) with our ResNet-18 based model. We empirically find – learning rate: Boosting learning rate
that max aggregation performs the best.
– n estimators: Number of gradient boosted trees.
Method File-level Individual-level Equivalent to number of boosting rounds
min 0.62 ± 0.05 0.61 ± 0.07 – scale pos weight: Balancing of positive and neg-
median 0.64 ± 0.04 0.65 ± 0.07 ative weights
mean 0.64 ± 0.05 0.65 ± 0.08
max 0.62 ± 0.03 0.68 ± 0.07
– min child weight: Minimum sum of instance
weight (hessian) needed in a child
Table 5: Comparison of aggregation methods. For the file- – gamma: Minimum loss reduction required to make a
level aggregation, median and mean over segment predic- further partition on a leaf node of the tree
tions seems to work equally well whereas for individual- – reg lambda: L2 regularization term on weights
level aggregation, max over probabilities over individual
file-predictions works best. The descriptions for the full list of parameters and their
default values can be found in the API documentation for
XGBoost 4 .
Ensembling We tried two methods for ensembling:
• Ranking: Ensembling uncalibrated models might lead to 4
https://xgboost.readthedocs.io/en/latest/python/python api.html#module-
lower performance and since AUC doesn’t require the xgboost.sklearnC Use Case: COVID-19 triaging tool
Computation of lift from prevalence The utility of our
method as a triaging tool for COVID-19 has been described
in Sec. 7. Here, we show the detailed calculations that we use
to obtain the numbers for Table 4. The lift in testing capacity
(L) is calculated as a function of the disease prevalence (ρ),
the sensitivity (Sn ), and the specificity (Sp ) of our model.
We use n to denote the population size, and T P , T N , F P
and F N to denote true positives, true negatives, false posi-
tives and false negatives respectively. We propose a triaging
mechanism wherein only individuals that are deemed posi-
tive from our model are sent for RT-PCR tests (Fig. 1, main
paper). Hence all negatives from our model (which can be
both true negatives T N or false negatives F N ) are not tested
by RT-PCR. The number of false negatives from our model
at the operating point we select (high sensitivity (90%)) is
extremely low.
Given we are not testing negatives, the effective increase
(or lift) in testing capacity becomes
n
L=
n − (T N + F N )
It is trivial to show that
T N = Sp (1 − ρ)n; F N = ρn(1 − Sn )
Thus, we obtain the lift
1
L=
[1 − ((1 − ρ)Sp ) + ρ(1 − Sn )]You can also read