Characterizing the Seabed: a Geoscience Perspective - Brill
←
→
Page content transcription
If your browser does not render page correctly, please read the page content below
chapter 1

Characterizing the Seabed: a Geoscience
Perspective

           Alvar Braathen and Harald Brekke

1          Introduction

The sea with its seabed has assets that have become extensively exploited as a
source for food, energy and transport. Traditionally, the advancements of man-
kind on land have been more successful than in the oceans, mostly due to a
physical setting that challenges easy-access and low-cost operations. However,
this is gradually changing under the combined factors of the depletion of the
required new resources as assets on land, and an increasing demand, resulting
in an increased attention for the oceans. Meanwhile, the oceans remain mostly
unknown, could be hostile and are for sure fragile.
   In this contribution, our aim is not to explore the possibilities laying in the
oceans and its seabed as other chapters in this book extensively cover them.
Our objective is to inform about the seabed itself and define it, by asking some
key questions that geoscientists could answer: What is the seabed made up
of? Is the seabed a static entity or will the bed change over time? How could
human activity influence the physical consistency of the seabed? These ques-
tions are basic but compulsory if one wish to implement a regulatory regime
to seabed activities. It may be obvious, but decision-makers have to know what
they regulate.

2          What Characterizes the Seabed?

The term seabed refers to the top-surface of earth in seas and oceans, also
known as the seafloor or ocean floor. This surface has a topography, which is
directly related to the nature of its subsurface geology, in places modified by
ocean currents and sedimentary processes. Both the topography and the sub-
surface are important factors in the use of the seabed by humankind. From
a resource perspective, humankind determines how resources from the sea-
bed may be exploited and its resources distributed or protected by preventing

© Alvar Braathen and Harald Brekke, 2020 | doi:10.1163/9789004391567_003
This is an open access chapter distributed under the terms of the CC BY-NC-ND   4.0 License.
                                                                       Alvar Braathen and Harald Brekke - 9789004391567
                                                                         Downloaded from Brill.com04/10/2021 10:10:21AM
                                                                                                          via free access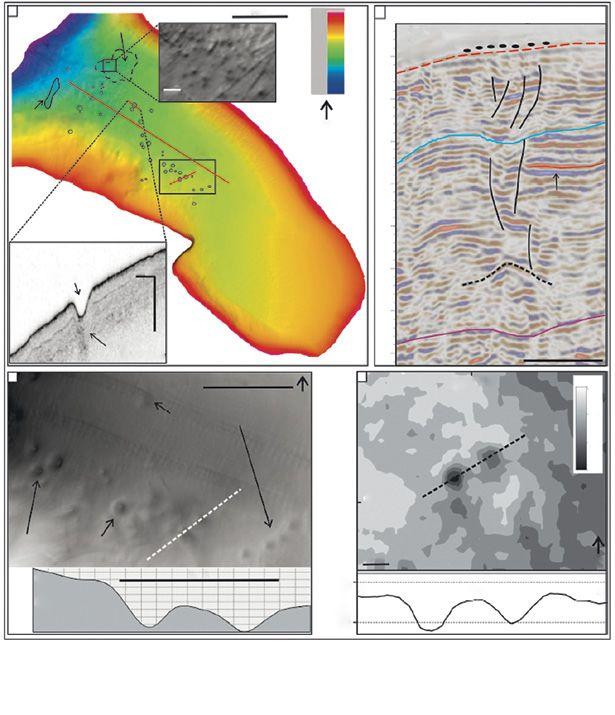
22                                                                  Braathen and Brekke

exploitation. In all circumstances, the nature and accessibility of the seabed
will be a crucial preliminary consideration. To understand the characteristics
of the topography and subsurface of the seabed, we will have to look at the
formation of the seabed, including the outer parts of the Earth’s crust below
oceanic water (2.1), and then the nature and processes of the interface between
solid or semi-solid earth materials and water column in the sea (2.2). These
are subjects covered extensively in many textbooks.1 Our approach is therefore
that of a summary.

2.1      The Earth’s Crust
The main geological difference between the continents and the deep oceans
is the nature of the Earth’s crust. In geology, one speaks of continental crust as
opposed to oceanic crust. The continental crust is very thick (20–40 km) and
relatively light, while oceanic crust is thin (5–15 km) and considerably denser,
as shown in figures 1 and 2. This is because continental crust consists of light
minerals rich in silica and aluminium, while oceanic crust consists of heavy,
dense minerals rich in iron and magnesium. The effect of this is that the con-
tinents float high on the earth’s mantle, like a cork on water, while the deep
ocean floor is barely afloat, like a piece of heavy wood. This marked difference
in buoyancy, thickness and relative elevation, is actually the underlying reason
for the general global distribution of land and water. The thick buoyant conti-
nents support the vast areas of emergent land, while the heavy and low-lying
oceanic crust forms the floor of the deep parts of the huge ocean basins that
accommodate the world’s seawater.
    The differences between the continental and oceanic crust relates to the
processes by which they are formed. The outer part of the Earth, including
the crust, is divided into several large segments called lithospheric plates, which
fit together like pieces in a jig saw puzzle. These plates ‘float’ and drift slowly
in different directions upon the deeper mantle of the Earth. This implies that
along some boundaries the plates separate and move away from each other
(divergent boundaries), while along other boundaries they collide (convergent
boundaries). In geology, this process is called plate tectonics.
    Along the boundaries where plates separate, space is continuously created
as the plates move away from each other at the speed of 1–10 cm/yr. This space
is immediately filled by molten rock from the mantle in the form of intrusions
and lavas, which solidify and form new crust. This is the way the dense and
heavy oceanic crust is formed. The process is called ocean spreading since it

1 	See notably: J.P. Kennett, Marine Geology (Prentice Hall, 1982); E. Seibold and W. Berger, The
    sea floor: an introduction to marine geology (Springer, 2017).

                                                                 Alvar Braathen and Harald Brekke - 9789004391567
                                                                  Downloaded from Brill.com04/10/2021 10:10:21AM
                                                                                                     via free access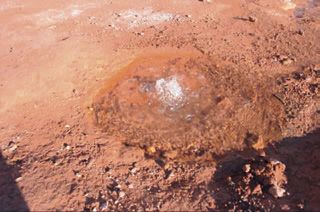
Characterizing the Seabed                                                                  23

implies that the ocean crust on both sides of the plate boundary is growing,
causing the ocean to widen. Such widening oceans have all originated in break-
up zones along which old continents were rifted apart by forces in Earth’s
mantle. These break-up zones then become new divergent plate boundaries
between which the new ocean will form by ocean spreading. The Atlantic
Ocean of today is such a spreading ocean, which accommodates increasing
separation between the American continent on one side and Europe and
Africa on the other.
   Ocean spreading along some plate boundaries implies that other bound-
aries experience plate collision, making up convergent plate boundaries. At
such boundaries, the crust of one plate will be forced under the other plate,
with the contact termed a subduction zone. The heavy oceanic crust tends to
be forced down. As the down-pressed plate moves down into the mantle in
the subduction zone, the oceanic crust will melt again, and the molten rock
will rise to the surface where it forms chains of volcanoes on the overriding
plate. These volcanoes in many places form chains of islands, so called island
arcs. Where the overriding plate is that of a continent the volcanoes becomes
part of the margin of that continent. Water and sediments will be involved in
the melting process within the subduction zone giving rocks enriched in light
minerals akin to continental crust. As millions of years pass, such islands and/
or continental margins at convergent boundaries of plates will collide with
islands or continents on other plates. Since they are formed of light rocks they
will not be subducted into the mantle again, but tend to become accreted to
the colliding islands or continent forming mountain chains. That is the way
continents grow. For instance, the Pacific Ocean of today is surrounded by sub-
duction zones where its oceanic crust disappears beneath the American and
Asian continents. Millions of years into the future, the Pacific Ocean will close
and the two continents collide.
   Thus, the plate tectonic process results in a cycle where oceans come and go
while continents collide and grow (Fig. 1.1 in Annex). The plate tectonic process
started more than 4 billion years ago when the Earth had cooled sufficiently for
molten rock to solidify and begin forming crust on the planet’s surface.

2.2      Seabed Topography
The general topography of the seabed of the Earth may be described in terms
of the continental shelf, the continental slope, the continental rise, the continen-
tal margin, and the deep ocean floor (Fig. 1.1). These terms are used partly in a
legal sense by Article 76 of the United Nations Convention of the Law of the
Sea (UNCLOS) to define the outer limits of coastal state’s jurisdiction over
the continental shelf.

                                                        Alvar Braathen and Harald Brekke - 9789004391567
                                                         Downloaded from Brill.com04/10/2021 10:10:21AM
                                                                                            via free access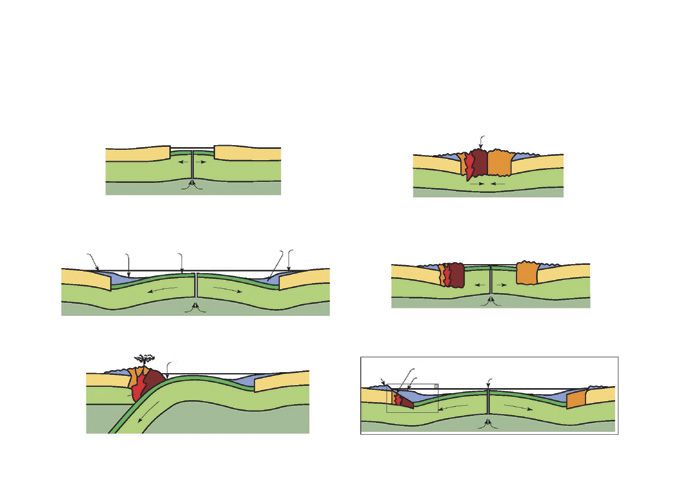
24                                                               Braathen and Brekke

figure 1.1 Profile showing a cross section of the elements of the general topography of
           the seabed extending from the coastline to the deep ocean floor

The topography of the seabed is related to the lateral distribution of the two
types of crust, as shown in Figure 1.2. All the continents, which make up nearly
all of the earth’s land areas, have a continental shelf underlain by continental
crust dominated by light components (minerals such as quartz and feldspar).
This shelf is the part of the continent that is submerged below the sea, and
make up vast areas of sea floor at a water depth starting at the beach and
descending to some hundred meters. The shelf is bound seaward by the con-
tinental slope of similar light composition, dipping gently towards the deep
ocean. In general, the continental slope is formed near the edge of the conti-
nental mass where the continental crust thins considerably and merges with
the oceanic crust. At the base of the slope, at water depths below 3,000–4,000
meters, we reach the realm of the deep ocean floor that is underlain by oceanic
crust made up of dark, heavy components. In many parts of the world one also
finds a continental rise, which is an area of very gentle dip between the base
of the slope and the deep ocean floor. The classical continental rise is a wedge
shaped pile of sediments derived from the shelf areas and accumulated next
to the base of the slope – in many places the sedimentary wedge partly overly
oceanic crust.
   In geology, the underwater areas of the planet are subdivided into two parts:
the continental margins and the deep ocean floor. The continental margin
extends from the shoreline to the end of the continental rise or to the base of
the continental slope where no rise exists. The area seaward of the continental
margin is the deep ocean floor.
   The continental shelf is relatively flat and shallow. The widest continental
shelves are found in the continental margins that were formed at divergent
plate margins; also termed passive margins (see Fig. 1.1). Passive margins form

                                                              Alvar Braathen and Harald Brekke - 9789004391567
                                                               Downloaded from Brill.com04/10/2021 10:10:21AM
                                                                                                  via free access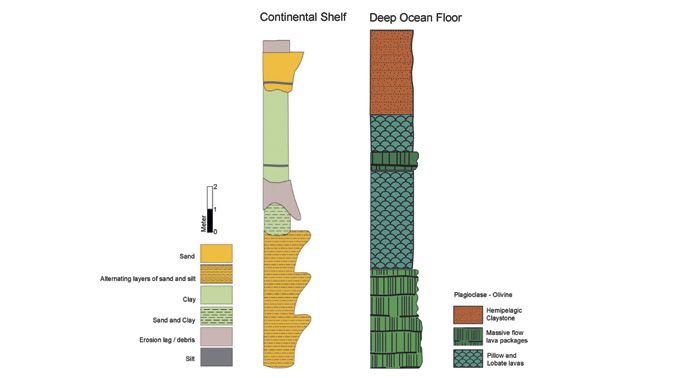
Characterizing the Seabed                                                                                                                                  25

                                                 The Ocean Cycle
         Opening and contraction                                                         Collision and re-opening
                                                                                                                          Ancient
                North America             Rift                 Africa                                                     Appalachians

1                                                                                                                                                    4

     Continental Continental    Oceanic                  Deep-sea       Shelf
     shelf       rise           crust                    Sediments      Sediments                  OD 0502001         Atlantic

2                                                                                                                                                    5
                                          Rift Ancestral Atlantic

                                   Trench                                           Modern          Eroded core of ancient Appalachians
                                                                                    Appalachians     Modern shelf           Mid Atlantic rift
3              Granite                                                                                                                               6

figure 1.2 The Ocean Cycle. Schematic illustration of six progressive steps in the ocean cycle
           exemplified by the geological evolution of the Atlantic margins.
           based on Press and Siever, 1974
           1)	The evolution starts with break-up, splitting North America from Africa, lead-
               ing to formation of passive continental margins separated by oceanic crust
               gradually formed by intrusion of molten rock and extrusion of lavas at the mid-
               oceanic ridge (steps 1–2). This rifting and onset of ocean floor spreading of the
               Proto-Atlantic Ocean (the Iapetus Ocean) happened ca. 700 million years ago.
           2)	The mature stage of the ocean floor spreading in the Iapetus Ocean in Cambrian
               times (ca. 500 million years ago). In stages 1) and 2) the margins of the conti-
               nents are tectonically and magmatically relatively passive while they are being
               progressively separated by the ocean floor spreading process. Continental
               margins in this geological setting are therefore termed ‘passive margins’.
           3)	The contraction stage of the Iapetus Ocean in Ordovician times by the establish-
               ment of subduction zones along the continental margins. Such continental
               margins are tectonically and magmatically very active, and are therefore termed
               ‘active margins’.
           4)	The collision between the old continents resulting in the final closure and
               destruction of the Iapetus Ocean and the consequent formation of the
               Appalachian/Caledonian Orogen (mountain chain) about 420 million years ago.
           5)	Renewed rifting along the axis of the orogen and re-establishment of seafloor
               spreading in the Atlantic Ocean through Jurassic and Cretaceous times. Note
               that continents at this stage have grown through the crustal material accreted at
               the continental margins during the continental collision and the previous ocean
               contractional stage.
           6)	Present spreading stage of the Atlantic Ocean where the passive continental
               margins still grow by the deposition of continentally derived sediments in the conti-
               nental slopes along the outer parts of the margins.
           Note: F. Press and R. Siever. Earth (W.H. Freeman and Company, San Francisco,
           1974).

                                                                                                                        Alvar Braathen and Harald Brekke - 9789004391567
                                                                                                                         Downloaded from Brill.com04/10/2021 10:10:21AM
                                                                                                                                                            via free access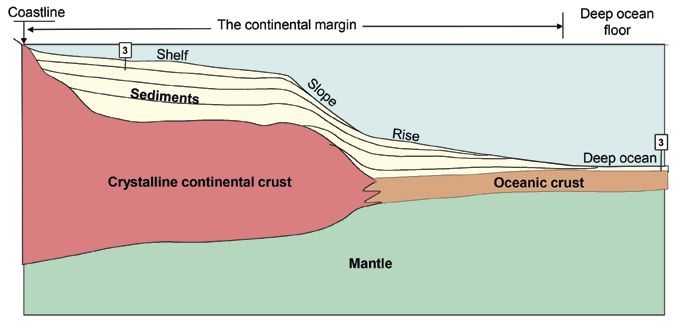
26                                                       Braathen and Brekke

by the extension and rifting of the continental crust prior to the break-up of
the continent, ultimately leading to ocean floor and spreading. Thus, the wid-
est continental shelves in the world are developed in the continental margins
of the Atlantic Ocean. Narrow continental shelves are typical in continental
margins associated with subduction zones at convergent plate boundaries: the
active margins. They are generally narrow, as for instance seen along the west-
ern margin of the American continent.
    All continental shelves end at the continental slope. The shape and nature of
the continental slope vary considerably around the world. Along most passive
continental margins, the continental slope forms an overall even surface with
low gradients. Several of these slopes are underlain by large accumulations of
sediment derived from rivers or glaciers that has draped and smoothed ear-
lier topography. Such slopes are dominated by sedimentary processes and are
generally accompanied by a large continental rise at the base of the slope. For
other passive margins, however, the continental slope is a complex system of
plateaus, ridges and steep escarpments formed by fault movements and from
volcanic activity. For the active margins, the continental slope of the overriding
plate typically constitutes the steep, landward slope towards the subduction
trench (Fig. 1.2). Such trenches are the deepest places on Earth.
    The topography of the deep ocean floor seaward of the continental slope
is formed by the oceanic crust and later modified by sediment deposition.
The oceanic crust is produced by volcanism (sea-floor spreading) along the
diverging plate boundary. Hot rock is less dense than cold rock. Therefore,
the young crust along the ocean spreading boundaries is relatively elevated
to about 2,500 meters depth because the rocks are heated by the volcanic
processes. Away from the spreading axis, the crust becomes denser as it cools
with time and gradually subsides to large depths of about 4,000–6,000 meters.
Thus, the spreading boundaries stand up as a global system of broad mountain
chains (volcanoes) of the deep oceans. These mountain chains are called mid-
ocean ridges. The floor of these mid-ocean ridges is very irregular reflecting
the original volcanic terrain of hills and mountains. Away from the elevated
parts of the mid-ocean ridges, the crust becomes covered by sediment through
time. In the deepest, older parts of the oceans the rugged terrain of the crust
is totally buried by sediments, which forms the vast, flat abyssal plains of the
world’s oceans.
    The oceans are locally punctuated by a different type of volcanic edifices,
seen as seamounts that rise several thousand meters from the deep ocean floor.
These volcanoes are geologically different from those of the ocean spreading
process as they form above so-called hot-spots in the deep mantle. Many of
these seamounts are surmounted by islands like those of Hawaii and Polynesia.

                                                      Alvar Braathen and Harald Brekke - 9789004391567
                                                       Downloaded from Brill.com04/10/2021 10:10:21AM
                                                                                          via free access
Characterizing the Seabed 27
3 Seabed Composition and Its Mapping
3.1 Seabed Composition
Earth materials in the surface seabed of the continental shelf is made up of
a veneer of material falling out of suspension, such as dust from continents,
biological material, sometimes ash and, more recently, human waste. Seafloor
biological activity creates debris, for instance from reefs. Sand and mud is
mostly supplied by rivers entering the ocean at given points. From their entry
point, biological debris, sand and mud are washed around by waves and cur-
rents in the sea before settling in positions where wave and current action
have limited impact. Typically, this process of deposition will create distinct
layering, or stacking of beds, of which the younging-up order, or sequence, of
distinct beds make up a lithostratigraphy (Fig. 1.3).
With increased burial by progressive burial, or chemical reactions between
grains in sediments and fluids, initially unconsolidated biological debris, sand,
mud and clay will start to advance mechanical strength by creating bonds in a
process termed diagenesis. This is the path towards lithification that ultimately
leads to rocks, such as limestone, sandstone, mudstone and shale underlying
the unconsolidated to poorly consolidated upper beds underneath the seafloor.
figure 1.3 Typical lithostratigraphy of the continental shelf compared to similar stratigraphy
of the deep ocean floor, shown in stratigraphic columns in which the total thickness
would be between 10 and 100 meters in vertical section down from the sea-floor
(on the top). The distribution of sediments such as sand and clay is directly linked
to the source for various sediments and subsequently the physical conditions
(waves, currents, composition) of the water column and its impact on the seafloor.
Alvar Braathen and Harald Brekke - 9789004391567
Downloaded from Brill.com04/10/2021 10:10:21AM
via free access28 Braathen and Brekke
The seabed of the deep ocean floor shows similar traits to beds of the con-
tinental shelf. However, with increasing distance to land (source of sand),
limited seafloor biological activity, and depths excluding wave impact, a sig-
nificant part of the seabed material has been falling out of suspension (ash,
windblown dust, biological material). Local patches of sand and mud relates
to infrequent currents down the continental slope. With the volcanic activity
at the mid oceanic ridges, hard rocks from volcanic flows of the oceanic crust
make up the units below the topside veneer of poorly consolidated sediments.
Furthermore, cooling of volcanic material triggers hydrothermal activity, with
seafloor groundwater venting revealed as black smokers.
3.2 Mapping the Seabed and Its Composition
In many parts of the world, the seafloor has been subject to mapping. For large
areas, fairly detailed seafloor morphology maps are available, based in cam-
paigns by national authorities, military activity, and compilation of datasets
from mostly commercial ships equipped with advanced echo-sounders. The
motivation for this work has been multifold, spanning form protection of reefs
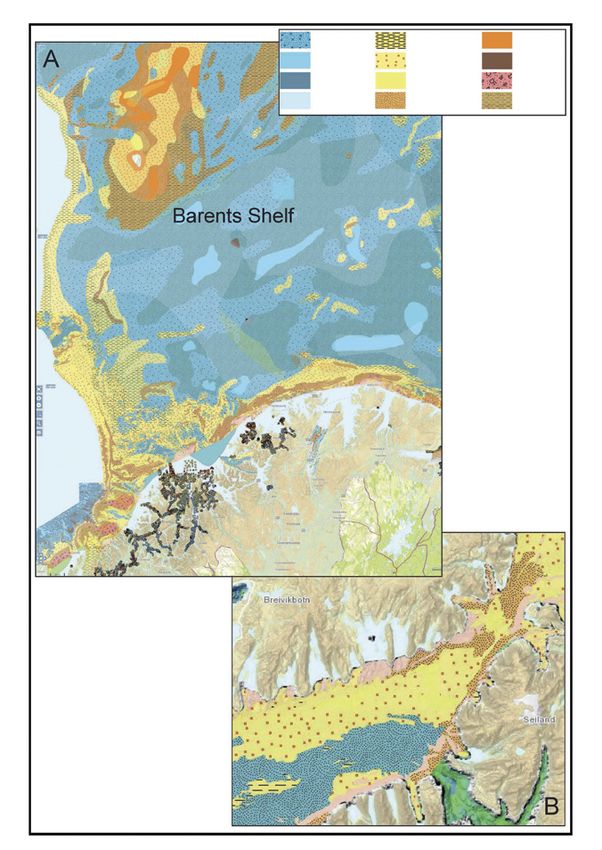
to placement of infrastructure. In Figure 1.4 we present one example, based on
the Norwegian Mapping authority’s (Kartverket2) efforts to manage the sea-
floor of the Barents shelf and nearby fjords of North Norway.3
In the case of the Barents Shelf seafloor, the mapping campaigns show that
it is composed of sand, mud and shale, with some areas of concentrated bio-
logical activity displaying deep-water patch reefs. This distribution of materials
on the seafloor is controlled by former or contemporaneous wave and current
energy at the base of the marine water column. The basic physics behind mov-
ing sand or clay grains dictate that sand reflect most energy and shale lower
energy. Noticeable, the energy level in areas with sand could be sufficient to
create net seafloor erosion, hence causing gradual removal of the topmost part
of the seabed.
In fjord areas like in Norway, the sediment distribution is closer linked to
land, as rivers convey the bulk of the sediments to the fjord basin. Accordingly,
sand is found at the mouth of rivers and streams, whereas mud and clay settle
from suspension further out in the fjord. As discharge by river can be very high
and even episodic during floods, seabed thickness varies greatly from thick
deltas to thin deep fjord deposits.
2 Norwegian Mapping Authority (Kartverket): .
3 For further insight, information is given on the Geological Survey of Norway’s website at
.
Alvar Braathen and Harald Brekke - 9789004391567
Downloaded from Brill.com04/10/2021 10:10:21AM
via free accessCharacterizing the Seabed 29
Sandy mud Gravel in muddy sand Gravel
Mud Gravely sand Rocky sediment
Mud and blocks Sand Rock and blocks
Silt Sandy gravel Muddy gravel
figure 1.4 (A) Seafloor composition of the Barents Sea continental shelf, and (B)
a similar map showing the seafloor composition in a fjord of North
Norway.
Examples from the database of the Geological Survey of
Norway (NGU) (ww.ngu.no). With the consent of NGU.
Alvar Braathen and Harald Brekke - 9789004391567
Downloaded from Brill.com04/10/2021 10:10:21AM
via free access30 Braathen and Brekke
Maps like those presented in Figure 1.4, directly describing seafloor compo-
sition, allow insight to temporal stability. The derived information is crucial for
placement of infrastructure, as further outlined below. Such detailed data are
nonetheless not common on a global scale. They mostly exist in ocean basins
where there are significant national economic or other interests at stake.
Hence, some areas of the world are already well mapped, while others are far
from being mapped.
4 Natural Processes in and on the Seabed
As mentioned, in most places the seafloor experiences net deposition or
erosion of sediments, although major or catastrophic events (e.g., storms, tsu-
namis, landslides) can temporarily change this status. From the moment a
bed is building up, biological activity will modify its consistence. Most common
is bioturbation by sediment eating organisms, consuming whatever organic
material that has been captured in the sediment. These forms of life thrive in
given positions, with deeper areas below the photogenic zone less attractive.
Further, in shallow waters with extensive wave action, or in locations exposed
to fresh water from streams, living conditions are uninviting. In areas where
organic material is not fully consumed, there will be bacterial degradation cre-
ating gas (hydrocarbons). This gas is biogenic, and should not be mistaken as
thermogenic gas. The latter relates to chemical reactions in organic shales (and
sometimes limestones) that survived the biological activity and experienced
deeper burial. As described above, deeper burial instigate the transition to
rock that, combined with general heating, mobilize hydrocarbons in organic
beds. Byproducts are gas and oil.
The transition from loose sediment to rock linked to compaction from burial
and chemical reactions reduces the pore space available for fluids. Fluids will
typically be captured sea water or groundwater that migrate in from other beds.
General compaction reduces available space for fluids, forcing them to migrate.
As basically all fluids are lighter than rock and earth materials, this migration
follows paths that eventually will bring fluids to the surface, unless trapped.
The consequence is that large parts of the seafloor experience expulsion of
fluids such as fresh or salt (brine) ground water, biogenic and thermogenic gas
and even oil. Much of this relaxed flow is bypassing the seabed during migra-
tion from deeper geological units to the surface.
There are numerous examples of the fluid expulsion at the Earth’s surface,
with two illustrations presented in Figures 1.5 and 1.6. This phenomenon is
not unique to the oceans, and excellent natural examples of it can be found
Alvar Braathen and Harald Brekke - 9789004391567
Downloaded from Brill.com04/10/2021 10:10:21AM
via free accessCharacterizing the Seabed 31
figure 1.5
A CO 2 leak in Utah, USA
photograph by Alvar Braathen
A
Cluster of unit-pockmarks 1 km (m) B Line 427 magnified
-20
(diameter < 5 m) NWPockmarks on bathymetric dataSE
b.s.I. depth(m)
-200
-130 Seafloor
Faults
5m -200
Pockmark trough
Forwick et al., (2009) N TWT(ms) Top Kapp Toscana
Fig. 7C, D
B
A pa
rt o
fL Igneous body?
ine Faults
(Fi 427 m
g.7
B) agni
-600
fi ed
Pockmark 40 m Folding?
10 m
-800
Top Kapp Starostin
Acoustic
turbidity zone 1 km
C 150 m D 15º32'00"E BS(-dB)
-24
N
-26
Less-sharply outlined pockmarks
B
-28
-30
B
78º15'24"N
A
Sharply outlined pockmarks
A 50 m N
-76 A 75 m B
-28 (-dB)-24
A 50 m B
-80 (m)
-84
Figure 7. (A) High-resolution multibeam bathymetric data from SA1 (Adventfjorden) showing the distribution of pockmarks. The area enclosed
figure 1.6 Pockmarks of Isfjorden, Svalbard, Norway. High-resolution multibeam
by the dashed lines in the northwest of the fjord has c. 25-30 unit-pockmarks (top inset shows magnified unit-pockmarks on bathymetric data).
Bottom inset illustrates the acoustic turbidity zone beneath a pockmark on the sub-bottom profile. (B) Structural interpretation of 2D seismic data
bathymetric data from SA1 (Adventfjorden) showing the distribution
(Line 427) in deeper successions beneath the pockmarks. (C) Sharply and less-sharply outlined circular pockmarks. Profile A-B across the pock-
marks in illustrated beneath. (D) Multibeam backscatter data and corresponding A-B profile across the same pockmarks shown Fig. 7C.
of pockmarks. (A) The dashed-line area has c. 25–30 unit-pockmarks
(top inset: magnified unit-pockmarks on bathymetric data; bottom
inset: acoustic turbidity zone beneath a pockmark on the sub-bottom
profile. (B) Structural interpretation of 2D seismic data (Line 427)
in deeper successions beneath the pockmarks. (C) Sharply and
less-sharply outlined circular pockmarks. Profile A-B across the
pockmarks is illustrated beneath. (D) Multibeam backscatter data
and corresponding A-B profile across the pockmarks in Fig. C.
modified from Roy et al. 2016
Alvar Braathen and Harald Brekke - 9789004391567
Downloaded from Brill.com04/10/2021 10:10:21AM
via free access32 Braathen and Brekke
onshore, such as in Utah (Southwest USA). This region display numerous sites
that leakage natural CO 2 to the Earth’s surface from deeper reservoirs/aqui-
fers. Extensive geological investigations suggest fluids migrate up conduits
along narrow zones in the crust that have experienced earthquakes and which
are called faults. This migration has lasted for at least 400,000 years.4 Not sur-
prisingly, drilling in 1937 next to a CO 2 charged spring punctured one fluid
migration route, triggering significant CO 2 outbursts.
Another example of fluid expulsion from the seafloor can be found in the
pristine High Arctic of Norway (see Figure 1.6). In Svalbard, the Longyearbyen
CO 2 Lab project undertook mapping of the fjord seafloor as a baseline study.
The concept was to map pre-existing leaks before starting injection campaigns
into rocks nearby. Investigations found hundreds of small depressions with
circular rims on the seafloor, so-called pockmarks.5 They are formed by fluids
or gas rising out of the seabed, lifting away sediments and gradually forming
a 1–10 m deep crater. Mobilized sediments settle along the rim of the crater.
As the wilderness of Svalbard has experienced minimal impact by human
activity, this illustrates how fluid migration to the seafloor is a natural process,
with pockmarks as the physical evidence. For the CO 2 Lab, key questions were
attached to timing of fluid migration and flow rate. A central question was
notably to know whether these pockmarks were the result of ongoing flow.
Most pockmarks turned out to be dormant, reflecting former fluid expulsion
episodes. However, a few pockmarks in the fjord are active, showing mainly
methane gas mixed with ground, where thermogenic gas is sourced from
the deep subsurface. The organic black shales of the Svalbard bedrock emit
natural gas.
For the broader audience, the two examples of Utah and Svalbard discussed
above offer a higher learning value, which is that, basically, all geological mate-
rials will leak, given sufficient time. However, these leaks are overall slow and
will seldom be catastrophic (in geology terms this means shorter than thou-
sand years).
4 B. Dockrill, and Z. Shipton, ‘Structural controls on leakage from natural CO 2-geologic storage
site: Central Utah’, U.S.A., Journal of Structural Geology, v. 32, no. 11 (2010) 1768–1782.
5 S. Roy, M. Hovland, & A. Braathen, ‘Evidence of fluid seepage in Grønfjorden, Spitsbergen:
Implications from an integrated acoustic study of seafloor morphology, marine sediments
and tectonics,’ Marine Geology, no. 380 (2016), 67–78.
Alvar Braathen and Harald Brekke - 9789004391567
Downloaded from Brill.com04/10/2021 10:10:21AM
via free accessCharacterizing the Seabed 33
5 Seabed Resources and Human Activity
The resources of the seabed are both geological and biological. Geological
resources are found on the surface – mainly as sand and gravel, and deep sea
minerals –, as well as in the subsurface of the seabed – mainly as oil and gas.
Biological resources in the form of sedentary organisms live on or just below
the surface as part of the biodiversity, with species specialized according to
available resources, depending on the composition of the surface and subsur-
face of the seabed, and the associated geological processes.
The floor of the continental shelf is usually underlain by thick sequences of
sediments that may host hydrocarbon resources. This is especially the case for
continental shelves of passive continental margins where the sediments may
date back to long before the break-up of the continent. Therefore, these mar-
gins host most of the offshore oil and gas industry of the world.
Continental shelfs worldwide is the site for anchored infrastructures, for
instance drill holes that bypass the seabed on their way to the deeper sub-
surface and which are placed there to extract hydrocarbons. Other drill holes
are used to inject (waste-)water, gas or, in a few places, even anthropogenic
CO 2. Decades with learning around these operations make them familiar to
the general public, although technical challenges around infrastructure place-
ment such as wells are resolved by experts. Similar knowledge exists around
harvesting of biota from the seafloor (algae, shell fish, etc.) and, to a lesser
extent, mining biota in the uppermost seabed for instance by seafloor trawl-
ing. These undertakings are well regulated in most waters, with national and
bilateral agreements regulating undertakings.6
The deep ocean floor at 1000’s of meters depth has been regarded eco-
nomically less interesting as it is nearly barren of life that can be harvested.
However, a growing global population facing the transition to a society increas-
ingly dependent on digital processes and renewable energy has given rise to
a general agreement that there will be an increasing demand for metals in
the future, both in volume and diversity. This notion is reflected in the cur-
rent significantly growing interest in deep sea mining. Exploration for deep
sea polymetallic minerals is taking place both in the continental shelf areas
of coastal states and in the international seabed (the Area). At present, there
are 29 exploration contracts in the Area, and the activity is expected to move
6 See R. Caddell, Chapter 12 of this book, ‘Deep-Sea Bottom Fisheries and the Protection of
Seabed Ecosystems: Problems, Progress and Prospects.’
Alvar Braathen and Harald Brekke - 9789004391567
Downloaded from Brill.com04/10/2021 10:10:21AM
via free access34 Braathen and Brekke
to exploitation in a near or not too far future.7 There are two main types of
polymetallic deposits on the seafloor of the deep oceans: ferro-manganese
minerals and seafloor massive sulphides.8 The ferro-manganese mineral
deposits are formed by oxyhydroxide minerals of iron and manganese, which
also carry minor, but economically interesting quantities of nickel, copper,
cobolt, rare earth elements (REE) and other metals. They form two types of
deposits: nodules and crusts. The individual nodules are formed as concentric
layers of minerals that are precipitated from the seawater above the seafloor
or from the pore water of the sediments just below the seafloor. Nodules grow
in areas of very sparse sedimentation and form large nodule fields in the abys-
sal plains that lie far from the sediment sources of the continents. The largest
nodules fields are found in the Pacific Ocean. The ferro-manganese crusts grow
as mineral lamina precipitated onto surfaces of bare rock on the seafloor (e.g.
escarpments, ridges and seamounts). Such crusts are found in all oceans.
The seafloor massive sulphides are formed by hydrothermal processes asso-
ciated with volcanic activity, mainly along the mid-ocean ridges of the oceans
(see above Section 2.2). The heat of the volcanic activity sets up a circula-
tion system of hot water within the ocean crust, leaching metallic elements
from the rock and carrying them up to the seafloor in hydrothermal vents. In
contact with the cold seawater, the metals will precipitate as a black cloud
of sulphides; hence the name ‘black smokers’. Such deposits are known from
all oceans, and some of them are already the object of industry activity. The
Canadian company Nautilus is currently developing a sulphide deposit called
‘Solwara’ within the Exclusive Economic Zone (EEZ) of Papua New Guinea.9
The Japanese agency JOGMEC in August 2017 carried out a successful test of
mining equipment on a sulphide deposit in the Okinawa Trough.10 It seems
that deep sea mining will take place as affordable technology opens new
avenues.
How will human activity on the seabed impact the local environment?
Infrastructure on the shelf such as oil platforms are anchored by traditional
7 See website of the International Seabed Authority at . For an
analysis of the applicable legal regime, see J. Dingwall, Chapter 7 of this book, ‘Commercial
Mining Activities in the Deep Seabed Beyond National Jurisdiction: The International
Legal Framework.’
8 See R. Sharma (ed.), Deep-Sea Mining. Resources Potential, Technical and Environmental
Considerations, (Springer International Publishing, 2017).
9 See further information on the website of the company Nautilus Minerals Inc at .
10 ‘Japan successfully undertakes large-scale deep-sea mineral extraction,’ Japan Times,
26 September 2017 .
Alvar Braathen and Harald Brekke - 9789004391567
Downloaded from Brill.com04/10/2021 10:10:21AM
via free accessCharacterizing the Seabed 35
methods (chain and anchor) or, for some installations, stands on the seafloor
by their own weight. Others stand on pillars knocked into the seabed. Future
production facilities will however to a larger degree lay on the sea floor or be
dug into the seabed. Common for all these semi-permanent facilities is that
they cause changes in the physical conditions for the seafloor, thereby impact-
ing the seabed with time. Waves amplify when hitting obstacles such as pillars,
drill hole casings, storage tanks or tubes/cables, increasing the likelihood for
erosion of the seafloor. On the contrary, infrastructure dampening the sea
could cause deposition. Infrastructure also has a load that could cause subsid-
ence. Further, infrastructure could generate heat and/or light impacting the
biological environment. All these effects are in most cases technically manage-
able if considered when it comes to design. Similarly, environmental impacts
caused by local sea floor modifications, or even spills, have been extensively
analyzed, as has the ownership and obligations to acreage. The environmental
impacts from local seafloor modifications are also regarded a major issue to be
considered with regard to the future deep sea mining for minerals; or similar
mining for biota in the seabed of the shelfs.
6 Geoscience Posts to the Regulatory Community
Our considerations around the seabed, based on our background as geologists,
bring forward many aspects that are well known, and well regulated, but we
feel that a reminder is in any case valuable. In order to reach science-based
decisions reflecting a precautionary approach, lawmakers must get access to
sufficient insight to understand the implications and impacts that the envis-
aged new laws may cause.
Alvar Braathen and Harald Brekke - 9789004391567
Downloaded from Brill.com04/10/2021 10:10:21AM
via free accessYou can also read