Climate-fever: A Dataset for Verification of Real-World
←
→
Page content transcription
If your browser does not render page correctly, please read the page content below
climate-fever: A Dataset for Verification of Real-World
                                                                Climate Claims
                                                                            Preprint, compiled January 5, 2021

                                                Thomas Diggelmann                      Jordan Boyd-Graber                   Jannis Bulian
                                               Department of Physics              CS, iSchool, LSC, and UMIACS             Google Research
                                                    ETH Zurich                         University of Maryland             Zurich, Switzerland
                                                 Zurich, Switzerland                  College Park, MD, USA              jbulian@google.com
                                            thomasdi@student.ethz.ch                  jbg@umiacs.umd.edu
arXiv:2012.00614v2 [cs.CL] 2 Jan 2021

                                                      Massimiliano Ciaramita                            Markus Leippold
                                                         Google Research                         Department of Banking and Finance
                                                        Zurich, Switzerland                             University of Zurich
                                                       massi@google.com                                 Zurich, Switzerland
                                                                                                  markus.leippold@bf.uzh.ch

                                                                                        Abstract

                                                 We introduce climate-fever, a new publicly available dataset for verification of climate
                                                 change-related claims. By providing a dataset for the research community, we aim to
                                                 facilitate and encourage work on improving algorithms for retrieving evidential support
                                                 for climate-specific claims, addressing the underlying language understanding challenges,
                                                 and ultimately help alleviate the impact of misinformation on climate change. We adapt
                                                 the methodology of fever [1], the largest dataset of artificially designed claims, to real-
                                                 life claims collected from the Internet. While during this process, we could rely on the
                                                 expertise of renowned climate scientists, it turned out to be no easy task. We discuss
                                                 the surprising, subtle complexity of modeling real-world climate-related claims within
                                                 the fever framework, which we believe provides a valuable challenge for general natural
                                                 language understanding. We hope that our work will mark the beginning of a new exciting
                                                 long-term joint effort by the climate science and ai community.

                                        1    Introduction

                                        With the easy availability of information through the Internet and social media, claims of unknown veracity
                                        manipulate public perception and interpretation. Misinformation and disinformation are particularly pressing
                                        issues for the climate change debate. They have confused the public, led to political inaction, and stalled
                                        support for climate-change mitigation measures [2, 3, 4, 5]. To counter the influence of potentially false
                                        claims on the formation of public opinion on climate change, researchers and experts began to manually
                                        assess claims’ veracity and publish their assessments on platforms such as climatefeedback.org and
                                        skepticalscience.com.
                                        Recently, new literature on algorithmic fact-checking has emerged, using machine learning and natural
                                        language understanding (nlu) to work on this problem from different angles. One influential framework that
                                        combines several of these aspects is fever [1]. It consists of a well-vetted dataset of human-generated claims
                                        and evidence retrieved from Wikipedia and a shared-task for evaluating implementations of claim validators.
                                        Given that the fever claims are artificially constructed, they may not share the characteristics of real-world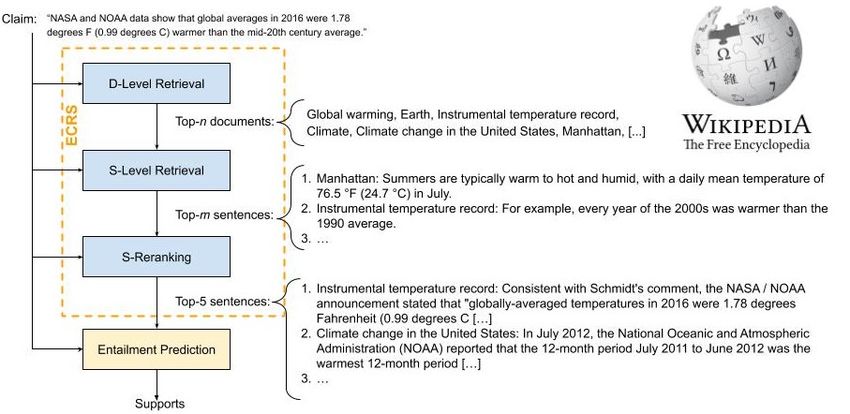
Preprint – climate-fever: A Dataset for Verification of Real-World Climate Claims                                   2

claims. Consequently, researchers [6] started to collect real-world claims from multiple fact-checking
organizations along with evidence manually curated by human fact-checkers.
We believe that technology cannot and will not in the foreseeable future replace human fact-checkers. But it
can help to provide relevant, reliable evidence for humans to make better decisions about the veracity of a
claim. In this work, we focus on building a dataset of real-world claims specifically on climate change. We
collect 1,535 claims on the Internet. For each claim, we algorithmically retrieve the top five relevant evidence
candidate sentences from Wikipedia by the use of nlu where humans annotate each sentence as supporting,
refuting, or not giving enough information to validate the claim. We call this database of 7,675 annotated
claim-evidence pairs the climate-fever dataset.1 .

2       Methodology
We adopt a pipeline approach for our evidence retrieval and claim validation system similar to the baseline
system proposed by fever [1] and similar to virtually all competing implementations that followed [7, 8,
9, 10, 11]. The reason for building this system is two-fold. First, we require an algorithm to automatically
retrieve evidence candidates from a large Knowledge Document Collection2 (kdc) given a claim to build our
dataset. Second, we require an end-to-end claim validation algorithm to predict entailment given a claim and
evidence candidates to form a baseline, i.e., to answer the question if current claim validation approaches are
up to the task of algorithmically validating real-life claims.

Figure 1: Overview of the claim validation system consisting of the Evidence Candidate Retrieval System
(ecrs) and Entailment Prediction (ep) stage.

Our architecture consists of two distinct components, the Evidence Candidate Retrieval System (ecrs) and
the Entailment Prediction (ep) stage (see Fig. 1). For a given claim, the ecrs retrieves sentences as evidence
candidates from the kdc. A pair of claim and evidence candidate sentences are fed to the ep to predict one
of the labels SUPPORTS, REFUTES or NOT_ENOUGH_INFO, depending on whether the evidence is supporting,
refuting, or not giving enough information to validate the given claim. The fever dataset uses a copy of the
    1
   We make this dataset publicly available at http://climatefever.ai.
    2
   We define kdc as any large document corpus that contains well-founded textual (prose) representations of knowledge.
Examples for kdc’s are encyclopediae, newspaper archives, scientific publications.
Preprint – climate-fever: A Dataset for Verification of Real-World Climate Claims 3
English Wikipedia containing only the introductory section of all articles as kdc. We also use the English
Wikipedia as kdc but, given the complexity of real-life climate claims, allow the complete body of Wikipedia
articles as a source of evidence.3
2.1 Retrieving and labeling climate claims (Task-1)
To obtain a set of candidate climate claims from the Internet, we follow an ad-hoc approach and use a set
of seed keywords in Google searches4 to identify possible sources for such claims. We either retrieved the
claims manually, or we scraped the pages automatically. We collected an equal number of climate-fever
claims from both scientifically-informed and climate change skeptics/deniers sources. This procedure resulted
in a balanced set of more than 3,000 climate claims.
fever claims were written and curated by annotators, enforcing a rigorous set of requirements for writing
claims. The resulting claims are self-contained, short, and syntactically simple. For example, one of the rare
claims related to climate change in fever reads:
"The Gray wolf is threatened by global warming."
In contrast, a candidate claim crawled from the wild is, e.g.:
“The Intergovernmental Panel on Climate Change is misleading humanity about climate change
and sea levels, and that in fact, a new solar-driven cooling period is not far off.”
Given the complexity of real claims, we introduce the definition of a verifiable claim as follows.
Definition 1 (Verifiable claims) A claim is potentially verifiable if it is a) well-formed and b) subjectively
investigable.
a) A well-formed claim is a single English sentence, consistent, unambiguous, and complete (i.e., not
much implicit knowledge is needed for comprehension by the reader).
b) A claim is subjectively investigable, if evidence could be retrieved from a knowledge document
collection (kdc) that decreases the investigators uncertainty about the truthfulness (or falsehood) of
the statement.
Equipped with our definition of verifiable claims, we asked climate scientists to label our collected claims
(Task 1). For each claim, we collected up to five votes. This annotation task resulted in more than 1,535
verifiable climate claims on which there was a sufficient consensus among the annotators. We give examples
of verifiable and non-verifiable claims in Appendix A.
3
This extension introduces a challenge with respect to the retrieval of evidence candidates. In the original setup, the
number of sentences retrieved after the document retrieval stage is permitting for pairwise ranking against a given claim
(up to 100 sentences on average in the introductory section). In our case, the number of sentences becomes intractable. We,
therefore, introduce a novel technique by leveraging learned sentence-embeddings combined with a fast vector similarity
index, faiss [12], to pre-select the most relevant sentences given a claim prior to the pairwise re-ranking. This can be
compared to Facebook AI’s Dense Passage Retrieval (dpr) [13] that uses a similar approach for solving Open-Domain
Question Answering (qa) by using dense embeddings rather than BM25.
4
For this study we did not automate this step. Instead, we manually searched for seed keywords, identified potential
targets, and used Python libraries such as requests and BeautifulSoup to download, parse and clean content for
subsequent processing.Preprint – climate-fever: A Dataset for Verification of Real-World Climate Claims 4
2.2 Evidence candidate retrieval
To automatically retrieve relevant evidence candidates from Wikipedia for a given claim, we build an ecrs
pipeline consisting of the following three steps5 :
1. Document-level retrieval: Given a claim as input, we retrieve the most relevant documents from the kdc.
We apply an entity-linking approach similar to [8]. We use BM25 [16] to query an inverse document index
containing all English Wikipedia articles with entity mentions extracted from the claim. We use a dependency
parser to identify candidates of entity mentions, and we select the top-10 relevant articles.
2. Sentence-level retrieval: From the selected articles, we retrieve the top-100 most relevant sentences using
sentence-embeddings trained on the fever dataset. To produce task-specific sentence-embeddings, we adopt a
pretrained albert (large-v2) model in an average-pooled Siamese-setting [17]. We apply hard positive and
negative mining [18, 7] to compensate for the large number of possible negative examples.
3. Sentence re-ranking: Similar to [7] we train a point-wise model to predict a relevance score for pairs of
claim and evidence. We adopt a pretrained albert (base-v2) model with a binary classifier on the [CLS]
token. Every evidence is classified as evidence (1) or non-evidence (0). During training, we use claims along
with supporting and refuting evidence from the fever training split as examples for evidence and we randomly
sample sentences from the fever Wikipedia dump to provide examples for non-evidence. During inference,
we sort evidence sentences by the predicted score in descending order and select the top five sentences.
2.3 Evidence candidate labelling (Task-2)
In Task-2, the claims together with their top five evidence sentences as retrieved by the ecrs are displayed to
the annotators to label it as supporting, refuting, or not giving enough information to validate the claim.6 For
each claim, we collect five individual votes per claim-evidence pair, which allows us to analyze confidence
and to compute inter-annotator agreement. During post-processing we compute a micro-verdict (for every
claim-evidence pair) and a macro-label for every claim (aggregated on the five micro-verdicts). The micro-
verdict is given by the majority-vote for each claim-evidence pair (or it is NOT_ENOUGH_INFO on a tie). The
claim-label is by default NOT_ENOUGH_INFO unless there is supporting (SUPPORTS) or refuting (REFUTES)
evidence. If there is both supporting and refuting evidence the claim-label is DISPUTED.
2.4 Entailment prediction
For entailment prediction, the top five candidate evidence sentences along with the corresponding Wikipedia
article titles are jointly compared against the claim to predict one of the labels SUPPORTS, REFUTES, or
NOT_ENOUGH_INFO. We adopt a pretrained albert (large-v2) with a three-way classifier on the [CLS] token
of a concatenation of claim and evidence sentences. We train the model by using the ecrs to retrieve the top
five evidence candidates for each claim from the fever training split and use the gold-labels as ground-truth for
optimizing the cross-entropy loss. We reach a competitive label-accuracy of 77.68% on the fever dev-set using
our end-to-end pipeline (sota label-accuracy of 79.16% on the dev-set is reported by [10]). For measuring the
end-to-end performance of our claim-validation pipeline on the climate-fever dataset, we predict labels for
all claim and evidence-set pairs and compare against the gold-labels (claim-labels) from Task-2.
5
For BM25 in the first step we leverage Apache’s Lucene (https://lucene.apache.org/), while our model
implementations for steps two and three are both based on Google’s albert model [14] by using HuggingFace’s
transformers library [15].
6
Given our 1,535 climate claims and five sentences per claim, we end up with 7,675 annotations.Preprint – climate-fever: A Dataset for Verification of Real-World Climate Claims 5
Table 1: For evidence candidate labelling (Task-2) the 1,535 claims were split into 10 slices of 770 claims
each (except for the last slice). Each slice consists of 3,850 (770 × 5) claim-evidence pairs. This table lists for
each slice the average number of voters, the inter-annotator agreement (αKrippendorff ), the fraction of evidence
sentences with total agreement and the average entropy with respect to the select class (SUPPORTS, REFUTES
or NOT_ENOUGH_INFO).
Slice Size Avg. Num. Voters αKrippendorff Total Agreement Avg. Entropy
0 770 2.227 0.283 0.613 0.266
1 770 4.019 0.399 0.423 0.380
2 770 2.000 0.522 0.745 0.176
3 770 3.001 0.106 0.201 0.544
4 770 2.000 0.215 0.504 0.344
5 770 2.000 0.091 0.404 0.413
6 770 2.000 0.252 0.529 0.327
7 770 2.825 0.316 0.461 0.371
8 770 2.000 0.431 0.635 0.253
9 745 2.000 0.229 0.545 0.315
3 Discussion and future work
To gain insight into the 1,535 climate claims, we collected several statistics about the dataset. By using a
clustering technique, we identified more than 20 different topics represented by the collected claims, such
as claims concerning “climate change in the arctic”, “sea-level rise”, and more general ones concerning
“climate_change and global warming” (see Appendix B).
The evidence labelling task (Task-2) produced a dataset of 1,535 claims with an annotated set of five evidence
candidates for each claim. Each evidence sentence is labelled by at least two voters (2.4 ± 0.7 voters per
evidence on average). The distribution for aggregate claim-labels SUPPORTS, REFUTES, DISPUTED, and
NOT_ENOUGH_INFO is 655 (42.67%), 253 (16.5%), 153 (9.97%), and 474 (30.88%). While fever only
contains undisputed claims, we include claims for which both supporting and refuting evidence were found.
We believe that these examples are especially useful since they appear to be a common feature of real-world
claims.
Furthermore, we dealt with the limitation of fever-style majority-vote based aggregation for deciding on
a claim label. The approach is too naïve as, in many cases, retrieved evidence covers only some facets of
the claim, in which case not enough evidence is present to form a final opinion. More generally, a claim
(hypothesis) can at best be refuted by contrarian evidence. Epistemologically, it is impossible to assign a final
verdict. In our case, the only purpose for assigning a gold-label to each climate-claim is to measure a baseline
performance of a fever entailment predictor on our dataset. Our dataset provides both the micro-verdict labels
and the claim-labels for each claim-evidence pair.
For Task-2 we measured an average inter-annotator agreement (Krippendorff’s alpha) of 0.334. This low level
of agreement signifies the hardness of the task, i.e., even for human annotators, it is non-trivial to decide if an
evidence candidate supports or refutes a given claim. Table 1 details the level of disagreement on a per-slice
basis.7 We observed that training the annotators can help raise the agreement level (e.g. slice 8 was labelled
by two second-time annotators). Furthermore, we could also see that pairs of annotators that are experts on
the topic (e.g., climate scientists or ML specialists) tend to have a higher average agreement (cf. slices 0 and
3).
7
For Task-2 we split the 1,535 claims into 10 slices of 770 claims each (except for the last slice) such that each
annotator has to label 3,850 claim-evidence pairs.Preprint – climate-fever: A Dataset for Verification of Real-World Climate Claims 6
The fever-trained entailment-predictor evaluated on the climate-fever dataset8 yields the following scores
(cf. table 4): label-accuracy = 38.78%, recall = 38.78%, precision = 56.49%, F1 = 32.85%. We computed
weighted-averages for the last three metrics to compensate for the unbalanced labels. The real-life nature
of the climate-fever dataset proves to be a challenge indicated by the low label-accuracy (38.78% — only
slightly better than chance classification), as compared to the higher and competitive label-accuracy on
the original fever dev-set (77.69%). As can be seen in table 5, the model particularly struggles to predict
SUPPORTED claims while it performs slightly better on predicting REFUTED claims. We suspect that this result
can mainly be attributed to the stark qualitative differences between real-world claims of climate-fever and
the artificial nature of fever claims. As argued above, real-world claims pose some unique challenges and
subtleties. For instance, the claim
“The melting Greenland ice sheet is already a major contributor to rising sea level and
if it was eventually lost entirely, the oceans would rise by six metres around the world,
flooding many of the world’s largest cities.”
includes a statement that the sea level will rise six meters. An ecrs-retrieved evidence sentence may state a
sea-level rise of x + meters. Although the numbers differ, the climate scientists labelled the evidence as
supportive. There are also more demanding cases. For instance, for the claim
“An article in Science magazine illustrated that a rise in carbon dioxide did not precede a
rise in temperatures, but actually lagged behind temperature rises by 200 to 1000 years.”
the ecrs provides both supporting and refuting evidence and labelled as such by the annotators. Such disputed
claims are absent in the fever dataset.9 To develop new strategies for tackling (climate-related) disinformation,
we must be able to cope with the complexity of real-life claims in general, and at the same time, account
for the specific characteristics of claims related to climate change. By further extending climate-fever and
making it publicly available, we provide a first step in the right direction and hope that our work will stimulate
a new long-term joint effort by climate science and ai community.
Acknowledgments
We would like to thank Thomas Hofmann (ETH Zurich) for his helpful contribution to an early draft of this
paper. We also thank Christian Huggel (University of Zurich) and Reto Knutti (ETH Zurich) for all their
comments and their climate science expertise. Finally, we are grateful to all climate scientists and annotators
who were involved in the annotation process to build the climate-fever database. Research supported with
Cloud tpus from Google’s TensorFlow Research Cloud (tfrc).
References
[1] J. Thorne, A. Vlachos, C. Christodoulopoulos, and A. Mittal, “FEVER: a large-scale dataset for fact extraction and
verification,” arXiv preprint arXiv:1803.05355, 2018.
[2] W. R. Anderegg, J. W. Prall, J. Harold, and S. H. Schneider, “Expert credibility in climate change,” Proceedings of
the National Academy of Sciences, vol. 107, no. 27, pp. 12 107–12 109, 2010.
[3] D. Ding, E. W. Maibach, X. Zhao, C. Roser-Renouf, and A. Leiserowitz, “Support for climate policy and societal
action are linked to perceptions about scientific agreement,” Nature Climate Change, vol. 1, no. 9, pp. 462–466,
2011.
[4] S. D. Benegal and L. A. Scruggs, “Correcting misinformation about climate change: The impact of partisanship in
an experimental setting,” Climatic change, vol. 148, no. 1-2, pp. 61–80, 2018.
8
To stay compatible with the fever methodology for evaluation we simply excluded disputed claims from our dataset.
9
We list more examples of our climate-fever dataset in Appendix D.Preprint – climate-fever: A Dataset for Verification of Real-World Climate Claims 7
[5] S. Van der Linden, A. Leiserowitz, S. Rosenthal, and E. Maibach, “Inoculating the public against misinformation
about climate change,” Global Challenges, vol. 1, no. 2, p. 1600008, 2017.
[6] I. Augenstein, C. Lioma, D. Wang, L. C. Lima, C. Hansen, C. Hansen, and J. G. Simonsen, “Multifc: A real-
world multi-domain dataset for evidence-based fact checking of claims,” in Proceedings of the 2019 Conference
on Empirical Methods in Natural Language Processing and the 9th International Joint Conference on Natural
Language Processing (EMNLP-IJCNLP), 2019, pp. 4677–4691.
[7] A. Soleimani, C. Monz, and M. Worring, “BERT for evidence retrieval and claim verification,” in European
Conference on Information Retrieval. Springer, 2020, pp. 359–366.
[8] A. Hanselowski, H. Zhang, Z. Li, D. Sorokin, B. Schiller, C. Schulz, and I. Gurevych, “Ukp-athene: Multi-sentence
textual entailment for claim verification,” arXiv preprint arXiv:1809.01479, 2018.
[9] Y. Nie, H. Chen, and M. Bansal, “Combining fact extraction and verification with neural semantic matching
networks,” in Proceedings of the AAAI Conference on Artificial Intelligence, vol. 33, 2019, pp. 6859–6866.
[10] W. Zhong, J. Xu, D. Tang, Z. Xu, N. Duan, M. Zhou, J. Wang, and J. Yin, “Reasoning over semantic-level graph for
fact checking,” arXiv preprint arXiv:1909.03745, 2019.
[11] Z. Liu, C. Xiong, M. Sun, and Z. Liu, “Fine-grained fact verification with kernel graph attention network,” in
Proceedings of the 58th Annual Meeting of the Association for Computational Linguistics, 2020, pp. 7342–7351.
[12] J. Johnson, M. Douze, and H. Jégou, “Billion-scale similarity search with gpus,” arXiv preprint arXiv:1702.08734,
2017.
[13] V. Karpukhin, B. Oğuz, S. Min, L. Wu, S. Edunov, D. Chen, and W.-t. Yih, “Dense passage retrieval for open-domain
question answering,” arXiv preprint arXiv:2004.04906, 2020.
[14] Z. Lan, M. Chen, S. Goodman, K. Gimpel, P. Sharma, and R. Soricut, “ALBERT: A lite BERT for self-supervised
learning of language representations,” 2019.
[15] T. Wolf, L. Debut, V. Sanh, J. Chaumond, C. Delangue, A. Moi, P. Cistac, T. Rault, R. Louf, M. Funtowicz, and
J. Brew, “Huggingface’s transformers: State-of-the-art natural language processing,” ArXiv, vol. abs/1910.03771,
2019.
[16] S. Robertson and H. Zaragoza, The probabilistic relevance framework: BM25 and beyond. Now Publishers Inc,
2009.
[17] N. Reimers and I. Gurevych, “Sentence-bert: Sentence embeddings using siamese bert-networks,” arXiv preprint
arXiv:1908.10084, 2019.
[18] A. Hermans, L. Beyer, and B. Leibe, “In defense of the triplet loss for person re-identification,” arXiv preprint
arXiv:1703.07737, 2017.
[19] L. McInnes, J. Healy, and J. Melville, “Umap: Uniform manifold approximation and projection for dimension
reduction,” arXiv preprint arXiv:1802.03426, 2018.
[20] “Using umap for clustering — umap 0.4 documentation,” https://umap-learn.readthedocs.io/en/latest/clustering.html,
(Accessed on 09/24/2020).
[21] S. Louhichi, M. Gzara, and H. B. Abdallah, “A density based algorithm for discovering clusters with varied density,”
in 2014 World Congress on Computer Applications and Information Systems (WCCAIS). IEEE, 2014, pp. 1–6.Preprint – climate-fever: A Dataset for Verification of Real-World Climate Claims 8
Appendix
A Claim Labelling (Task 1)
In the following, we present examples of verifiable and non-verifiable claims given definition 1.
Example A.1
Observe the following three potentially verifiable claims:
“NASA and NOAA data show that global averages in 2016 were 1.78 degrees F (0.99 degrees C)
warmer than the mid-20th century average.”
“The amount of carbon dioxide absorbed by the upper layer of the oceans is increasing by about 2
billion tons per year.”
“The bushfires in Australia were caused by arsonists and a series of lightning strikes, not ’climate
change’.”
The above claims are verifiable (1) because each claim is well-formed and there is a high probability that evidence could
be retrieved from a kdc either supporting or refuting it.
Example A.2
Observe the following claim:
“Since the beginning of the Industrial Revolution, the acidity of surface ocean waters has increased
by about 30 percent.13,14 This increase is the result of humans emitting more carbon dioxide into the
atmosphere and hence more being absorbed into the oceans.”
This claim consists of more than a single sentence and therefore does not adhere to definition 1 and, as a consequence of
this, is not verifiable.
Example A.3
Observe the following claim:
“Unprecedented climate change has caused sea level at Sydney Harbour to rise approximately 0.0 cm
over the past 140 years.”
This claim is not verifiable because it contains information that is inconsistent (a sea level rise of 0.0 cm) in violation of
definition (1).
Example A.4
Observe the following claim:
“CO2 emissions from all commercial operations in 2018 totaled 918 million metric tons—2.4% of
global CO2 emissions from fossil fuel use.”
This statement is incomplete because for its comprehension the reader would need to know that ‘commercial operators’ is
referring to air travel.
Example A.5
Observe the following claim:
“Yet nature-based solutions only receive only 2% of all climate funding.”
The above sentence is ambiguous because it is missing a subject. The collection of real claims sourced from the internet
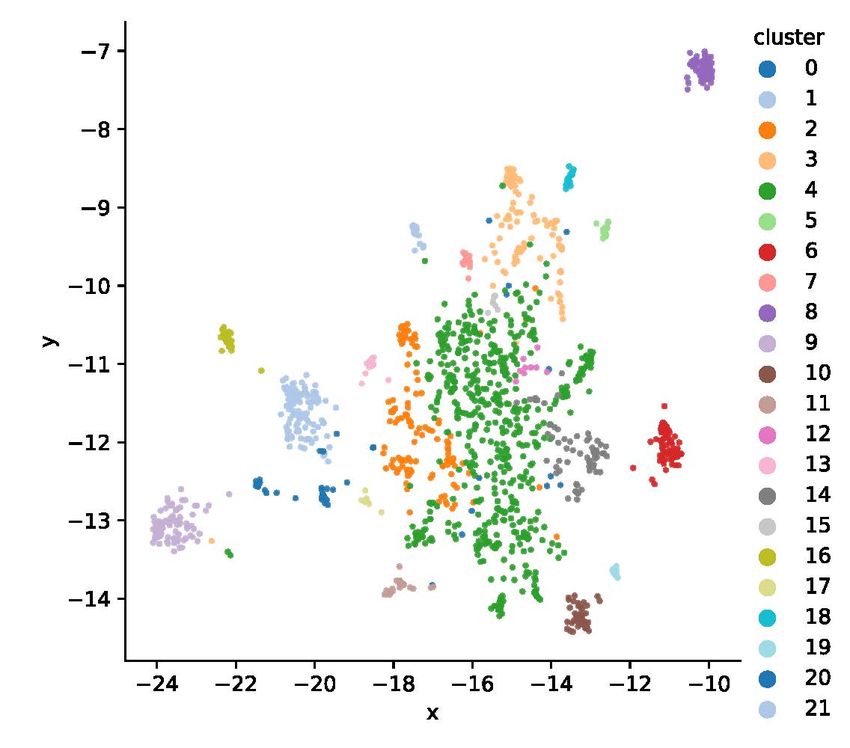
contains many examples of this type of non-verifiable claims.Preprint – climate-fever: A Dataset for Verification of Real-World Climate Claims 9 Figure 2: Scatter plot showing a two-dimensional embedding of the 1535 climate claims using umap [19] for dimensionality reduction. The cluster assignments were computed using the density based dbscan [21] algorithm performed on 30-dimensional umap embeddings. B Topic distribution To better understand the nature of the collected climate claims from the wild we applied a clustering technique helping us to discover topics discussed in the claims. For this we pre-processed each claim by tokenizing it into its constituting tokens (words, punctuation). We then replaced each word by its lemmatized and lower-cased version. Additionally, we rejected tokens that are either stopwords or punctuation and tokens that are shorter than 3 characters. Finally, we calculated the bigrams for all words in a claim and appended these to the list of unigrams to form a total list of terms. We then built a dictionary using the pre-processed claims. We post-processed the dictionary by keeping only terms that are contained in at least 5 claims. We also rejected terms that are contained in more than 50% of the total number of claims. After filtering, we kept the 150 most frequent terms. Table 2 lists all 150 dictionary terms sorted by document frequency, lead by the words “global”, “climate” and “warming”. We then calculated the tf-idf transformed document vectors for all claims using the dictionary. We applied umap [19] to find a two-dimensional embedding of the vectors for graphical visualization as can be seen in fig. 2. Additionally, as described in [20], we computed a 30-dimensional embedding also by applying umap that we used as input to the dbscan [21] clustering algorithm. We identified 21+1 different clusters (21 clusters plus ambiguity cluster 0) by using this technique. Table 3 gives an overview about the different clusters describing cluster size and the top-5 words within the cluster measured with respect to term-frequency. It can be seen that different topics are present within the set of climate-claims represented by distinct clusters in fig. 2, such as claims concerning “climate change in the arctic” (cluster 3), “sea-level rise” (cluster 8), and more general ones concerning “climate_change and global warming” (clusters 1 and 9).
Preprint – climate-fever: A Dataset for Verification of Real-World Climate Claims                                         10

C     Baseline evaluation
To evaluate a baseline system on climate-fever, we trained a claim validation system on the fever task reaching a
competitive label-accuracy of 77.58% on the fever dev-set. The final entailment prediction task was formulated as a
three-way classifier predicting label SUPPORTS, REFUTES or NOT_ENOUGH_INFO based on the claim and a concatenation
of all evidence sentences (were we prepended the Wikipedia article title to each evidence sentence to resolve missing
co-references). Tables 4 and 5 compare the performance of the claim validator evaluated on climate-fever and on the
fever dev-set.

D     climate-fever dataset
In this section we give an overview about the collected and labelled claims from the climate-fever dataset. We show
examples of supported and refuted claims and also give examples for disputed statements and claims that are not-verifiable
(should have been rejected during Task-1). We believe that one draw-back of the original fever dataset is the lack
of examples with contradictory evidence which naturally seem to arise when dealing with real-life claims. We also
report the average entropy for each claim as calculated by interpreting the relative frequencies of label votes as label
membership probabilities and calculating the mean entropy with respect to the individual entropies calculated for the
evidence sentences. Entropy then acts as surrogate for measuring the inter-annotator agreement: high entropy means
disagreement, low entropy means agreement. The entropy is naturally zero for claims were we so far only collected a
single vote per evidence.
We note that the claim-label is SUPPORTS, if at least one micro-verdict is SUPPORTS and all others are NOT_ENOUGH_INFO;
it is REFUTES, if at least one micro-verdict is REFUTES and all others are NOT_ENOUGH_INFO; it is NOT_ENOUGH_INFO, if
all micro-verdicts are NOT_ENOUGH_INFO; otherwise the claim-label is DISPUTED.

D.1    Supported claims
The following claims were all supported by evidence sentences retrieved by the ecrs as labelled by the annotators.
Example D.1
Here, we believe that the high inter-annotator disagreement is due to the incoherent formulation of the claim (“more than
100 per cent . . . ”). However, it is still clear what the statement intends to say which is why it correctly was labelled as
verifiable during Task-1.

 Votes : 4
 Entropy: 1.04
 Claim: more than 100 per cent of the warming over the past century is due to human actions
 Evidence:
           Supports: The view that human activities are likely responsible for most of the observed increase in global
               mean temperature (""global warming"") since the mid-20th century is an accurate reflection of current
               scientific thinking. [wiki/Kyoto_Protocol]
           Not_Enough_Info: Human-caused increases in greenhouse gases are responsible for most of the
               observed global average surface warming of roughly 0.8◦ C (1.5◦ F) over the past 140 years.
               [wiki/Scientific_consensus_on_climate_change]
           Supports: The dominant cause of the warming since the 1950s is human activities.
               [wiki/Scientific_consensus_on_climate_change]
           Supports: The global warming observed over the past 50 years is due primarily to human-induced emissions
               of heat-trapping gases. [wiki/Scientific_consensus_on_climate_change]
           Supports: Human activities, primarily the burning of fossil fuels (coal, oil, and natural gas), and sec-
               ondarily the clearing of land, have increased the concentration of carbon dioxide, methane, and
               other heat-trapping (""greenhouse"") gases in the atmosphere...There is international scientific con-
               sensus that most of the warming observed over the last 50 years is attributable to human activities.
               [wiki/Scientific_consensus_on_climate_change]
 Verdict: Supports
Preprint – climate-fever: A Dataset for Verification of Real-World Climate Claims 11
Example D.2
Votes : 4
Entropy: 0.0
Claim: A paper by Ross McKitrick, an economics professor at the University of Guelph, and Patrick Michaels, an
environmental studies professor at the University of Virginia, concludes that half of the global warming trend
from 1980 to 2002 is caused by Urban Heat Island.
Evidence:
Not_Enough_Info: McIntyre agreed, and made contact with University of Guelph economics profes-
sor Ross McKitrick, a senior fellow of the Fraser Institute which opposed the Kyoto treaty, and
co-author of Taken By Storm: The Troubled Science, Policy and Politics of Global Warming.
[wiki/Hockey_stick_controversy]
Not_Enough_Info: A 2002 article published in the journal Climate Research by Michaels and three other
scholars has predicted ""a warming range of 1.3–3.0◦ C, with a central value of 1.9◦ C"" over the 1990 to
2100 period, although he remarked that the ""temperature range and central values determined in our
study may be too great."" [wiki/Patrick_Michaels]
Not_Enough_Info: Until 2007 he was research professor of environmental sciences at the University of
Virginia, where he had worked from 1980. [wiki/Patrick_Michaels]
Not_Enough_Info: McKitrick has authored works about environmental economics and climate change
issues, including co-authoring the book Taken by Storm: The Troubled Science, Policy and Politics of
Global Warming, published in 2002. [wiki/Ross_McKitrick]
Supports: For example, Ross McKitrick and Patrick J. Michaels conducted a statistical study of surface-
temperature data regressed against socioeconomic indicators, and concluded that about half of the
observed warming trend (for 1979–2002) could be accounted for by the residual UHI effects in the
corrected temperature data set they studied—which had already been processed to remove the (modeled)
UHI contribution. [wiki/Urban_heat_island]
Verdict: Supports
D.2 Refuted claims
The following claims were all refuted by evidence sentences retrieved by the ecrs as labelled by the annotators.Preprint – climate-fever: A Dataset for Verification of Real-World Climate Claims 12
Example D.3
In this example, there is a high inter-annotator disagreement due to the second evidence sentence. We believe that
the reason for the disagreement is because some of the annotators were aware of the popular original statement that
specifically refers to the consensus among climate scientists (and not the US population which is the subject of the second
evidence sentence). Additionally, the percentages given differ to quite a large extent which might also have contributed to
the disagreement.
Votes : 4
Entropy: 0.85
Claim: 97% consensus on human-caused global warming has been disproven.
Evidence:
Not_Enough_Info: In the scientific literature, there is an overwhelming consensus that global surface
temperatures have increased in recent decades and that the trend is caused mainly by human-induced
emissions of greenhouse gases. [wiki/Global_warming]
Refutes: In a 2019 CBS poll, 64% of the US population said that climate change is a ""crisis"" or a ""serious
problem"", with 44% saying human activity was a significant contributor. [wiki/Global_warming]
Refutes: Of these, 97% agree, explicitly or implicitly, that global warming is happening and is human-caused.
[wiki/Scientific_consensus_on_climate_change]
Not_Enough_Info: It is extremely likely (95–100% probability) that human in-
fluence was the dominant cause of global warming between 1951–2010.
[wiki/Scientific_consensus_on_climate_change]
Refutes: 97% of the scientists surveyed agreed that global temperatures had increased during the
past 100 years; 84% said they personally believed human-induced warming was occurring,
and 74% agreed that ""currently available scientific evidence"" substantiated its occurrence.
[wiki/Scientific_consensus_on_climate_change]
Verdict: Refutes
Example D.4
Votes : 4
Entropy: 0.23
Claim: Extreme weather isn’t caused by global warming
Evidence:
Refutes: Extreme Weather Prompts Unprecedented Global Warming Alert. [wiki/Extreme_weather]
Refutes: Scientists attribute extreme weather to man-made climate change. [wiki/Extreme_weather]
Refutes: Researchers have for the first time attributed recent floods, droughts and heat waves, to human-
induced climate change. [wiki/Extreme_weather]
Refutes: Climate change is more accurate scientifically to describe the various effects of greenhouse gases
on the world because it includes extreme weather, storms and changes in rainfall patterns, ocean
acidification and sea level."". [wiki/Global_warming]
Refutes: The effects of global warming include rising sea levels, regional changes in precipitation, more fre-
quent extreme weather events such as heat waves, and expansion of deserts. [wiki/Global_warming]
Verdict: Refutes
D.3 Disputed claims
For the following claims contradictory evidence was found by the ecrs as labelled by the annotators. Such examples are
especially interesting since the original fever dataset does not contain such examples. We believe that in the future it is
important to extend the dataset with disputed examples, such that an end-to-end pipeline can also predict cases like these.Preprint – climate-fever: A Dataset for Verification of Real-World Climate Claims 13
Example D.5
Votes : 4
Entropy: 0.23
Claim: ""An article in Science magazine illustrated that a rise in carbon dioxide did not precede a rise in temperatures,
but actually lagged behind temperature rises by 200 to 1000 years.
Evidence:
Not_Enough_Info: In 2019 a paper published in the journal Science found the oceans are heating 40%
faster than the IPCC predicted just five years before. [wiki/Effects_of_global_warming]
Supports: Studies of the Vostok ice core show that at the ""beginning of the deglaciations, the CO
2 increase either was in phase or lagged by less than 1000 years with respect to the Antarc-
tic temperature, whereas it clearly lagged behind the temperature at the onset of the glaciations"".
[wiki/Global_warming_controversy]
Refutes: Recent warming is followed by carbon dioxide levels with only a 5 months delay.
[wiki/Global_warming_controversy]
Not_Enough_Info: Temperatures rose by 0.0◦ C–0.2◦ C from 1720–1800 to 1850–1900 (Hawkins et al.,
2017). [wiki/Global_warming]
Not_Enough_Info: Carbon dioxide concentrations were relatively stable for the past 10,000 years but then
began to increase rapidly about 150 years ago. . . as a result of fossil fuel consumption and land use
change. [wiki/Scientific_consensus_on_climate_change]
Verdict: Disputed
Example D.6
Votes : 4
Entropy: 0.66
Claim: Droughts and floods have not changed since we’ve been using fossil fuels
Evidence:
Not_Enough_Info: According to the WWF, the combination of climate change and deforestation increases
the drying effect of dead trees that fuels forest fires. [wiki/Drought]
Supports: However, other research suggests that there has been little change in drought over the past 60
years. [wiki/Effects_of_global_warming]
Refutes: Due to deforestation the rainforest is losing this ability, exacerbated by climate change which brings
more frequent droughts to the area. [wiki/Effects_of_global_warming]
Refutes: There may have been changes in other climate extremes (e.g., floods, droughts and tropical cyclones)
but these changes are more difficult to identify. [wiki/Effects_of_global_warming]
Refutes: The increased demands are contributing to increased environmental degradation and to global
warming, with resultant intensification of tropical cyclones, floods, droughts, forest fires, and incidence
of hyperthermia deaths. [wiki/History_of_the_world]
Verdict: Disputed
D.4 Subtle cases of claims and evidences
Here we list some interesting claims that showcase the challenges with real-life statements.Preprint – climate-fever: A Dataset for Verification of Real-World Climate Claims 14
Example D.7
Sometimes the decision if a sentence is supporting or refuting a claim is subtle as in this case. The quantification “six
metres” in the statement is not directly echoed in the evidence sentences (all evidence candidates mention 7 metres).
However, the general claim is still supported.
Votes : 1
Entropy: 0.0
Claim: The melting Greenland ice sheet is already a major contributor to rising sea level and if it was eventually lost
entirely, the oceans would rise by six metres around the world, flooding many of the world’s largest cities.
Evidence:
Supports: If the entire 2,850,000 km3 (684,000 cu mi) of ice were to melt, global sea levels would rise 7.2
m (24 ft). [wiki/Greenland_ice_sheet]
Supports: Ice sheet models project that such a warming would initiate the long-term melting of the ice sheet,
leading to a complete melting of the ice sheet (over centuries), resulting in a global sea level rise of
about 7 metres (23 ft). [wiki/Greenland_ice_sheet]
Supports: If the entire 2,850,000 cubic kilometres (684,000 cu mi) of ice were to melt, it would lead to a
global sea level rise of 7.2 m (24 ft). [wiki/Greenland_ice_sheet]
Supports: If the Greenland ice sheet were to melt away completely, the world’s sea level would rise by more
than 7 m (23 ft). [wiki/Greenland]
Supports: The Greenland ice sheet occupies about 82% of the surface of Greenland, and if melted would
cause sea levels to rise by 7.2 metres. [wiki/Ice_sheet]
Verdict: Supports
Example D.8
This is another example of the subtleties of interpreting evidence sentences with respect to the given claim. Here the claim
is clearly referring to polar ice, but a majority of the evidence sentences are talking about glacial retreat. However, the
later information is only discovered if one is careful enough to realize the Wikipedia article title from which the evidence
sentences are extracted (wiki/Retreat_of_glaciers_since_1850).
Votes : 1
Entropy: 0.0
Claim: Beginning in 2005, however, polar ice modestly receded for several years.
Evidence:
Refutes: Polar Discovery "Continued Sea Ice Decline in 2005". [wiki/Arctic_Ocean]
Not_Enough_Info: Ice cover decreased to 297 km2 (115 sq mi) by 1987–1988 and to 245 km2 (95 sq mi)
by 2005, 50% of the 1850 area. [wiki/Retreat_of_glaciers_since_1850]
Not_Enough_Info: The net loss in volume and hence sea level contribution of the Greenland Ice Sheet
(GIS) has doubled in recent years from 90 km3 (22 cu mi) per year in 1996 to 220 km3 (53 cu mi) per
year in 2005. [wiki/Retreat_of_glaciers_since_1850]
Not_Enough_Info: The Trift Glacier had the greatest recorded retreat, losing 350 m (1,150 ft) of its length
between the years 2003 and 2005. [wiki/Retreat_of_glaciers_since_1850]
Not_Enough_Info: This long-term average was markedly surpassed in recent years with
the glacier receding 30 m (98 ft) per year during the period between 1999–2005.
[wiki/Retreat_of_glaciers_since_1850]
Verdict: RefutesPreprint – climate-fever: A Dataset for Verification of Real-World Climate Claims 15
Table 2: Shows all 150 terms from the pruned dictionary sorted by document frequency (d.f.) for the 1,535
climate claims collected after Task-1.
token d.f. token d.f. token d.f.
global 303 datum 50 u.s. 25
climate 303 surface 49 percent 25
warming 296 solar 48 sun 24
temperature 222 weather 45 united 24
global_warming 189 energy 45 bad 24
change 189 low 45 activity 24
year 172 decade 45 review 24
co2 158 recent 43 sheet 24
ice 151 atmospheric 43 ice_sheet 24
level 143 long 42 cycle 24
warm 140 degree 41 long_term 24
climate_change 136 likely 41 go 23
sea 132 report 41 suggest 23
rise 129 cool 40 peer 23
carbon 128 predict 40 scientific 23
increase 125 new 40 accelerate 23
cause 118 mean 39 reduce 23
scientist 110 global_temperature 39 lead 23
human 105 sea_ice 38 air 23
emission 89 period 37 age 22
earth 82 term 37 ice_age 22
sea_level 82 event 36 co2_emission 22
dioxide 80 impact 36 significant 22
carbon_dioxide 80 occur 34 fast 22
ocean 79 cold 33 like 22
record 79 satellite 33 peer_review 22
greenhouse 72 extreme 32 continue 22
gas 72 great 31 cent 22
century 69 claim 31 coral 22
time 67 average 31 number 22
atmosphere 63 greenland 31 20th 22
trend 63 far 30 20th_century 22
past 62 research 29 fact 22
arctic 61 measurement 28 million 22
effect 60 melt 28 drive 21
model 59 antarctica 28 grow 21
ipcc 59 result 28 reef 21
study 58 come 28 ago 21
find 58 today 27 climate_scientist 21
level_rise 57 large 27 paper 21
world 57 climate_model 27 cloud 21
high 57 polar 26 hot 21
say 55 see 26 major 21
natural 55 rate 26 early 21
water 54 end 26 antarctic 20
heat 54 small 26 half 20
evidence 53 little 26 science 20
greenhouse_gas 53 accord 25 publish 20
planet 52 decline 25 man 20
show 51 cause_global 25 area 20Preprint – climate-fever: A Dataset for Verification of Real-World Climate Claims 16
Table 3: Shows an overview about the different clusters found in the 1,535 climate claims. The cluster
numbers correspond to the cluster numbers in Fig. 2. The first column denotes the cluster, second column
shows how many documents belong to said cluster. The last column lists the top-5 terms in the cluster as
measured with respect to term-frequency.
cluster size top_terms
4 550 co2, temperature, warm, year, increase
2 127 scientist, ipcc, climate, report, new
1 112 global_warming, warming, global, bad, year
3 106 ice, arctic, sea_ice, polar, sea
9 104 climate_change, change, climate, human, cause
6 78 carbon_dioxide, dioxide, carbon, atmosphere, emission
8 72 sea_level, level, sea, level_rise, rise
14 65 carbon, emission, u.s., accord, reduce
10 51 greenhouse_gas, gas, greenhouse, water, emission
16 50 global_warming, global, change, warming, increase
20 32 global_warming, cause_global, warming, global, cause
21 26 term, long_term, long, trend, cool
18 24 ice_sheet, sheet, ice, greenland, antarctica
11 21 extreme, event, weather, bad, change
13 21 review, peer_review, peer, paper, ipcc
7 19 reef, coral, great, world, year
19 19 20th, 20th_century, century, early, temperature
5 19 age, ice_age, ice, little, come
0 14 warming, time, event, trend, ice
12 9 like, temperature, degree, earth, warm
17 9 cloud, sun, predict, likely, global
15 7 large, decline, area, temperature, water
Table 4: Classification report with respect to the performance of the baseline claim validation pipeline
evaluated on climate-fever. These values are contrasted (in parentheses) with the reported values from the
evaluation on the original fever dev-set. All values are reported as percentages.
precision recall f1-score support
SUPPORTS 35.04 (81.34) 75.11 (86.32) 47.79 (83.76) 474 (6666)
REFUTES 39.93 (79.2) 43.87 (77.93) 41.81 (78.56) 253 (6666)
NOT ENOUGH INFO 78.41 (72.08) 10.53 (68.83) 18.57 (70.42) 655 (6666)
weighted avg 56.49 (77.54) 38.78 (77.69) 32.85 (77.58) 1382 (19998)
accuracy 38.78 (77.69) 1382 (19998)
Table 5: Normalized confusion matrix comparing classification performance of baseline claim validator
evaluated on climate-fever and original fever dev-set (in parentheses). Rows correspond to true labels,
columns correspond to predicted labels. All values are reported as percentages.
SUPPORTS REFUTES NOT ENOUGH INFO
SUPPORTS 10.5 (86.3) 9.2 (4.2) 80.3 (9.5)
REFUTES 3.2 (4.9) 43.9 (77.9) 53.0 (17.2)
NOT ENOUGH INFO 2.3 (14.9) 22.6 (16.2) 75.1 (68.8)You can also read