Chemical changes in soil with use of pelletized organomineral fertilizer made from biosolids and sugarcane filter cake
←
→
Page content transcription
If your browser does not render page correctly, please read the page content below
AJCS 15(01):67-72 (2021)                                                                                       ISSN:1835-2707
doi: 10.21475/ajcs.21.15.01.2645

Chemical changes in soil with use of pelletized organomineral fertilizer made from
biosolids and sugarcane filter cake
João George Moreira1, Julio Cesar Delvaux*2, Mara Lúcia Martins Magela1, Vanderley José Pereira1,
Reginaldo de Carmargo1, and Regina Maria Quintão Lana1

1
 Institute of Agrarian Sciences, Federal University of Uberlândia, Uberlândia, Minas Gerais, Brazil
2
 Federal Institute of Education, Science and Technology of Triângulo Mineiro, Ituiutaba Campus, Ituiutaba, Minas
Gerais, Brazil

Corresponding author: juliodelvaux@iftm.edu.br

Abstract

Soil fertility has become an interconnected aspect of modern agriculture, incorporating factors such as nutrient availability from
soil, and its revision has become necessary for ensuring sustainability. Therefore, to understand the solubility of nutrients from
organomineral fertilizers pelleted with biosolids and sugarcane filter cake, and to evaluate the resulting chemical changes in soil
from its use, an experiment was performed in a completely randomized design. The experiment was done with four replicates in a 3
× 5 +1 factorial scheme, using three fertilizer sources (mineral fertilizer, organomineral fertilizer pelletized with biosolids, and
organomineral fertilizer pelletized with the filter cake); five doses (60%, 80%, 100%, 120%, and 140% of the recommended dose of
fertilization for corn); and an additional control treatment (absence of fertilization). The formulation of the organomineral fertilizers
was 5-17-10 with 10% total organic carbon. All fertilizer sources were packed in a microfiber cloth positioned 1 cm below the
surface of the soil and incubated for 60 days. Subsequent evaluation of chemical attributes: pH H2O (1:2.5); pH SMP (Shoemaker-
McLean-Pratt); and the content of exchangeable aluminum, phosphorus, potassium, calcium, magnesium, silica, and organic matter
within the soil was done. Organomineral fertilizers pelleted with biosolids or filter cake do not acidify the soil, but they were found
to reduce aluminum saturation and promote a slow release of nutrients, which allowed a more balanced base in the soil. This then
ensured a better balance of nutrients, with greater cation exchange capacity, base sums, and base saturation. The use of these
fertilizers can contribute to stabilizing the pH of the soil with fewer applications of acidity correctives.

Keywords: Biofertilizer, sewage sludge, agro-industrial waste

Introduction

The management of soil fertility in agriculture is based on              biofertilizers, which could then be used as a promising
the availability of soil nutrients to crops. Modern soil science         alternative to commercial fertilizers. In this way, beneficial
postulates a connection between soil fertility and other                 use as a source of soil nutrients is garnered for the allocation
factors such as system sustainability, soil enrichment from              of the growing volume of material generated in sewage
organic matter, the solubility and dynamics of nutrient                  treatment plants (Quintana et al., 2011; Mota et al., 2018).
sources, and the residual effect of fertilizers (Lehmann and             There remain difficulties in the reuse of this material, which
Kleber, 2015). The generation of industrial and                          has a high pollutant potential, in Brazil; however, its use in
anthropogenic waste negatively affects springs, landfills, and           agriculture is indeed possible with appropriate sterilization
surrounding regions. Many of these residues do not have an               and stabilization techniques (Alves Filho et al., 2016).
appropriate destination, and agriculture is one of the most              The recent development of the pelletized organomineral
significant sectors contributing to this phenomenon (Pires               fertilizer industry has absorbed these by-products, adding
and Mattiazzo 2008; Rossol et al., 2012).                                wealth to environmental liabilities. However, agricultural
Residues such as sugarcane filter cake have consolidated                 research still has a long way to go regarding organic fertilizer
reuse processes, contributing to an increase in the                      sources, such as biosolids of varying composition.
sustainability of the production chain. This has contributed a           Provenance demonstrates the need for improved knowledge
proven reduction in the amount of mineral fertilizers that               of their properties such as solubility, the chemical and
need to be added to crops, and consequent reduction of                   physical changes that they bring about in the soil, and how
production costs (Nogueira and Garcia, 2013; Ramos et al.,               they relate to agricultural crops (Oliveira et al., 2017).
2015). Furthermore, the recent use of biosolids from sewage              The use of pelletized biofertilizers made from sugarcane
sludge has also gained interest as a component of                        filter cake and sewage sludge has provided good agronomic

                                                                   67
results in sugarcane crops (Teixeira et al., 2014), Brachiaria 2). This suggested greater phosphorus solubility in mineral
(Resende Junior et al., 2016), sorghum (Oliveira et al., 2017), fertilizer and indicated the gradual release of organomineral
and soy (Mota et al., 2018). However, little is known about fertilizers in the initial phase of incubation. Contrary to this,
the effects of these fertilizers on the chemical properties of Magela (2017) observed higher levels of phosphorus in the
the soil. Thus, the objective of this study was to evaluate the organic sources compared to 100% of the recommended
solubilization of nutrients, and assess the changes in the phosphorus dose in the mineral fertilizer treatment, 30 days
chemical properties of the soil due to the contribution of after incubation.
different doses of organomineral fertilizers pelleted from Organomineral fertilizers provide phosphorus in a controlled
biosolids and sugarcane filter cake. manner, with gradual solubilization throughout the crop.
This is owing to the presence of humic substances in the
Results and Discussion organic matter, which increase the amount of negative
charges near the site of phosphate release in these fertilizers
Effects on soil acidity (Teixeira et al., 2014). The results indicate the need for trials
of longer duration in order to verify the residual effect of
The use of biosolid fertilizer led to increased pH, while the phosphorus in organomineral sources.
pH observed when using the filter cake and mineral The application of organic fertilizers was effective at raising
fertilizers did not differ from that of the control (Table 1). For soil phosphorus levels. The application of organic residues
organomineral sources, higher pH stability was observed, also restores soil organic acids, which contribute to the
which was attributed to soil buffering promoted by organic reduced adsorption of soil phosphorus (Novais and Smyth,
matter. The organic matter presents high quantities of 1999). Thus, the use of organic sources favors the availability
carboxylic and phenolic radicals, which increase the CTC and of phosphorus in the soil.
the buffering power of the soil, thereby reducing the acidity When the potassium levels were evaluated, a positive effect
of the solution. This effect can be attributed to the presence of fertilization was observed with all results superior to the
of calcium oxides in the filter cake from the addition of the control (Table 2). Significant interactions were observed for
material in the broth clarification process (Prado et al., 2013) the higher fertilizer doses (100%, 120%, and 140%), and the
and in the biosolid from the need to eliminate pathogens results of phosphorus and potassium were most superior in
present in the waste (Alves Filho et al., 2016). the mineral source. A residual effect of organomineral
There was a difference in the potential acidity of the fertilizers is important for the maintenance of soil fertility
different fertilizers, with better results observed from using over time. Because potassium is monovalent, its retention in
the organomineral sources, especially that containing soil loads is lower because it is more easily replaced by other
biosolids (Table 1). A more acidic pH favored increased elements at the retention sites. Thus, the addition of organic
aluminum saturation, because the soil was not corrected. matter allows for the generation of more loads, in order to
Thus, the effect of fertilization is highly relevant and contain the leaching of this nutrient within the soil (Meurer,
treatment formulated with biosolid presented better results 2006). Notably, in sugarcane crops, the addition of filter cake
than the control. These results were also superior to those fertilizers may be partially or completely substituted for
from the filter cake (Table 1). potassium and phosphate mineral fertilization (Prado et al.,
2013; Teixeira et al., 2014).
Effects on nutrient content and aluminum saturation Calcium and magnesium are important for plant metabolism
and ionic soil balance. The organic base sources presented a
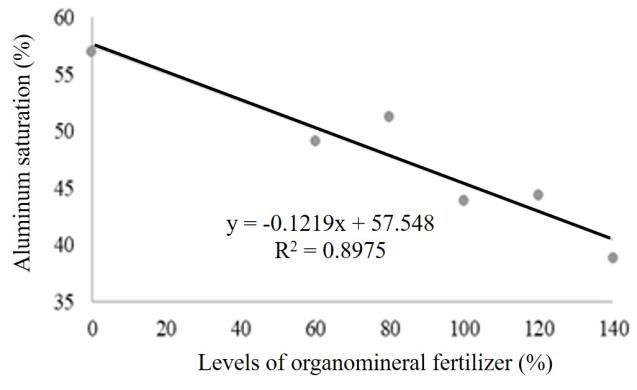
Nutrient release by the organomineral fertilizer improved small portion of calcium from the mineral, ulexite, used in its
the balance of the soil, allowing gradual reductions in composition. The results show that the nutrient content
aluminum saturation due to the mineralization of the organic remained low in all treatments, which is natural, owing to
sources. A 1% reduction in aluminum saturation was the low soil content studied and the low supply of fertilizer
observed for each 8.20% increase in fertilizer dose (Figure 1). added to the soil. Thus, it is necessary to evaluate these
The addition of filter cake to soil improves soil quality by nutrients in situ to understand how fertilization, with the
increasing macro- and micro-nutrient content, and by analyzed sources, interferes in the dynamics of soil ions,
reducing aluminum content (Almeida Júnior et al., 2011). their relations, and their availability.
Organomineral fertilizers made from filter cake and biosolids Superior results for the mineral source were observed for
allow the controlled release of nutrients, thereby favoring calcium (Table 2). However, magnesium content in biosolid
improved soil conditions for the development of plants treatments was significantly higher than that for other
(Oliveira et al., 2017). sources at all doses, with significant interaction between
The acidity results indicate a positive effect of the source and dose. This indicates the possible presence of
organomineral sources in relation to aluminum saturation, magnesium in the composition of the biosolid, favoring the
emphasizing the effect of organomineral sources in reducing supply of this nutrient to the soil.
exchangeable acidity. In general, the studied sources did not Silicon was evaluated to determine the dynamics of this
change the pH or the forms of acidity considerably; however, element when fertilizer was applied in the absence of an
it was noted that the mineral fertilizer promoted greater soil enriching component. The results revealed that the
acidification. organomineral source from biosolids presented higher
After 60 days of soil incubation, uniformity was observed quantities in the soil than the other treatments (Table 2).
between sources with the exception of the phosphorus Furthermore, results similar to those found in the potassium
content in the mineral source, which remained higher (Table evaluation were observed when the basal sum was
68Table 1. Relationship of factors affecting soil acidity. This table presents the pH in water, aluminum content, pH-dependent acidity, and potential
acidity (mmolcꞏdm-3), as well as the aluminum saturation, and aluminum and hydrogen ratios, with total CEC (%) of soil subjected to different doses
of organomineral fertilizer composed of biosolids or filter cake, and mineral fertilizer.
pH H2O Aluminum content pH-dependent acidity Potential acidity
Relative dose
Bio F.C. Min Bio F.C. Min Bio F.C. Min Bio F.C. Min
(%)
-------- pH -------- ------------------------- mmolcꞏdm-3 ---------------------------
0 4.19 4.40 22.8 27.2
60 4.85* 4.18s 4.20 3.25a 6.00b 6.50b 23.8b 20.0a 25.5b 27.0 26.0 32.0
80 4.30 4.23 4.18 6.25a 5.25a 6.50a 19.3a 21.0a 21.3a 25.5 26.3 27.8
100 4.53 4.25 4.25 5.00a 6.25a 5.25a 18.5a 21.8b 22.3b 23.5 28.0 27.5
120 4.15 4.15 4.30 5.25a 4.75a 6.00a 20.0a 23.5a 21.0a 25.3 28.3 27.0
140 4.25 4.25 4.20 4.25a 5.00a 6.25a 23.5a 23.0a 22.3a 27.8 28.0 28.5
Mean 4.42a 4.21b 4.23ab 0.48 5.45 6.10 21.0 21.9 22.5 25.8a 27.3ab 28.6b
Aluminum saturation t Al/T H/T
Relative dose
Bio F.C. Min Bio F.C. Min Bio F.C. Min
(%)
--------------------------------------------- % -------------------------------------------------
0 56.9 14.4 74.7
60 34.0* 59.5 53.9 9.7a* 19.9b 17.1b 71.2aª 66.5a* 68.3a
80 47.8* 51.5* 54.6 19.3a 16.8a 19.5a 59.9a* 67.1b 64.2b*
100 38.6* 47.7* 45.2* 15.9a 18.3a 15.4a 58.9a* 61.9b* 65.4b*
120 41.5* 46.3* 45.3* 16.1a 14.1a 17.5a 61.4a* 69.7b 60.6a*
140 29.0* 41.1* 46.3* 11.2a 14.5b 17.5b 61.4a* 65.5a* 62.2a*
Mean 38.2a 49.2b 49.0b 14.4 16.7 17.4 62.6 66.2 64.2
The asterisk (*) indicates values different from the control according to Dunnett’s test at 0.05. Averages followed by distinct letters in the line, differ from each other according to Tukey’s test at 0.05.
The superscript t (t) indicates data transformed by the log function (x + 1) to the model assumptions. Bio: organomineral fertilizer pelletized with biosolids; F.C.: organomineral fertilizer pelleted with
filter cake; Min: mineral fertilizer.
Fig 1. Regression model for aluminum saturation (%) at different doses.
Table 2. Levels of phosphorus and potassium (mgꞏdm-3), calcium and magnesium (mmolcꞏdm-3), silicon (mgꞏkg-1), sum of bases and total cation
exchange (mmolcꞏdm-3), basis saturation (%), and organic matter (gꞏkg-1) of soil subjected to different doses of organomineral fertilizer composed of
biosolids or filter cake, and mineral fertilizer.
Phosphorus Meh Potassium Meht Calcium Magnesium Silicon
Relative dose
Bio F.C. Min Bio F.C. Min Bio F.C. Min Bio F.C. Min Bio F.C. Min
(%)
--------------------- mgꞏdm-3 -------------------- ------------------- mmolcꞏdm-3 ---------------- ------- mgꞏkg-1 -------
0 0.73 12.9 2.06 0.79 3.05
60 1.18 1.05 3.23 37.0a* 41.2a* 38.0a* 3.56 2.20 3.57 2.08a* 1.18ab 0.89b 4.52* 4.35* 4.01*
80 1.98 1.53 3.48 43.5b* 48.5ab* 62.0a* 2.68 2.25 2.72 2.78a* 1.45b 0.95b 4.09* 4.04* 4.14*
100 2.90 3.13 9.38* 56.5b* 66.2b* 90.2a* 3.46 3.06 3.39 3.51a* 1.70b 1.09b 4.09* 4.02* 3.84*
120 3.18 4.88 6.53* 62.5b* 67.5b* 96.2a* 2.59 2.39 3.40 3.19a* 1.58b 1.97b* 3.81* 3.57* 3.51*
140 12.0* 7.8* 10.5* 68.2b* 86.5ab* 96.7a* 4.83 2.77 3.39 4.37a* 1.81b 1.33b 3.58* 3.36 3.23
Mean 4.3b 3.7b 6.62ª 53.5 62.0 76.6 3.42ª 2.5b 3.3ab 3.18 1.54 1.25 4.02a 3.87b 3.7b
Relative doseSum of bases Cation exchange capacity Basis saturation t Organic matter
(%) Bio F.C. Min Bio F.C. Min Bio F.C. Min Bio F.C. Min
----------------------- mmolcꞏdm-3 ------------------ -----------%------------ --------- gꞏkg-1 ----------
0 3.30 30.5 10.9 11.3
60 6.45* 4.05 5.45 33.5ab 30.1b 37.5a* 19.1* 13.5 14.6 16.7 14.8 8.0
80 6.63* 5.00 5.33 32.1a 31.3a 33.1a 20.8* 16.0 16.2 12.3 10.0 12.5
100 7.95* 6.93* 6.55* 31.5a 34.9a 34.1a 25.2* 19.8* 19.1 16.0 8.3 18.5
120 7.38* 5.45 7.75* 32.6a 33.7a 34.8a 22.5* 16.2 21.9* 26.0 29.0 16.3
140 10.50* 6.98* 7.25* 38.3a* 35.0a 35.8a 27.4* 20.0* 20.2* 16.5 20.3 8.7
Mean 7.78ª 5.68b 6.47b 33.6 33.0 35.0 23.0a 17.1b 18.4b 17.50 16.5 12.8
The asterisk (*) indicates values different from the control according to Dunnett’s test at 0.05. Averages followed by distinct letters in the line, differ from each other according to Tukey’s test at 0.05.
The superscript t (t) indicates data transformed by the log function (x + 1) to the model assumptions. Bio: organomineral fertilizer pelletized with biosolids, F.C.: organomineral fertilizer pelleted with
filter cake, Min: mineral fertilizer.
69Table 3. Chemical properties of the sewage sludge biosolid and the sugarcane filter cake.
Sources pHH2Oa COTa Na P2O5a K2Oa C/Na
------------------------- % ------------------------
Sewage sludge 12.65 19.8 1.0 2.8 0.30 28/1
Filter cake 6.81 24.0 1.0 1.1 0.27 14/1
aEvaluations proposed by Teixeira et al. (2017)
Table 4. Relationship between bases and base relationships with CEC. Total percentage of soil submitted to different doses of
organomineral fertilizer composed of biosolids or filter cake, and mineral fertilizer.
Relative
Ca/Mg Ca/K Mg/K Ca+Mg/K
dose (%)
Bio F.C. Min Bio F.C. Min Bio F.C. Min Bio F.C. Min
0 2.62 6.26 2.40 8.66
60 1.71 1.86 3.87 3.69* 2.09* 3.92* 2.19 1.13* 0.95* 5.88* 3.22* 4.87*
80 0.98* 1.55 2.86 2.39* 1.80* 1.81* 2.47 1.15* 0.63* 4.85* 2.95* 2.44*
100 0.98* 1.79 2.97 2.38* 1.80* 1.48* 2.42 1.01* 0.48* 4.80* 2.81* 1.96*
120 0.81* 1.52 2.27 1.61* 1.41* 1.58* 1.98 0.94* 1.03* 3.59* 2.35* 2.60*
140 1.10* 1.61 2.83 2.81* 1.27* 1.38* 2.52 0.85* 0.55* 5.33* 2.12* 1.93*
Mean 1.12c 1.67b 2.96a 2.57a 1.67b 2.03ab 2.32a 1.02b 0.73b 4.89a 2.69b 2.76b
Relative
Ca/T Mg/T K/T Ca+Mg/T
dose (%)
Bio F.C. Min Bio F.C. Min Bio F.C. Min Bio F.C. Min
------------------------------------------------------ % -----------------------------------------------------
0 7.11 2.73 1.08 9.85
60 12.28 7.58 12.31 7.17* 4.07 3.07 2.85ª 3.50a* 2.53ª 19.44 11.66 15.38
80 9.22 7.76 9.37 9.57* 4.98 3.28 3.48a* 4.03a* 4.85a* 18.79 12.74 12.66
100 11.93 10.54 11.70 12.10* 5.86 3.76 4.63b* 4.85b* 6.75a* 24.03 16.41 15.46
120 8.94 8.24 11.72 10.99* 5.46 6.78* 4.98b* 5.05b* 7.28a* 19.93 13.70 18.50
140 16.66* 9.55 11.67 15.05* 6.22 4.58 4.58b* 6.40a* 6.98a* 31.71 15.78 16.25
Mean 11.81a 8.73b 11.35ab 10.98a 5.32b 4.29b 4.10 4.77 5.68 22.78ª 14.05b 15.65b
The asterisk (*) indicates values different from the control according to Dunnett’s test at 0.05. Averages followed by distinct letters in the line, differ according to Tukey’s test at 0.05. Bio:
organomineral fertilizer pelletized with biosolids, F.C.: organomineral fertilizer pelleted with filter cake, Min: mineral fertilizer, T: CEC at pH 7.
Table 5. Chemical and textural characterization of the red Oxisol
pH P meh K+ Ca2+ Mg2+ Al3+ H+Al BS t T V m OM OC
- mgꞏdm - -3 ------------------- cmolcꞏdm-3 ------------------- -- % -- dagꞏkg-1
4.9 0.7 0.03 0.2 0.1 0.2 2.50 0.33 0.58 2.83 12 43 1.0 06
Coarse sand Fine sand Silt Clay
---------------------------------------------- gꞏkg-1 ----------------------------------------------
431 387 31 151
The pH in H2O; P, K: Mehlich−1 extractor; Ca, Mg, Al: KCl 1 mol L−1 extractor; H + Al: SMP at pH 7.5; BS: base sum; t: effective CEC; T: CEC at pH 7; V: base saturation; m: aluminum saturation; OM:
organic matter; OC: organic carbon. Methodologies based on Teixeira et al. (2017). Textural analysis was performed using the pipette method (Sheldrick and Wang, 1993).
evaluated (Table 2), and the result was attributed to the high (Table 2).
potassium levels provided by the mineral fertilizers. No differences were observed in organic matter content
among treatments (Table 2). It is important to note that
Effects on cation exchange capacity while the experiment evaluated the solubility of the
fertilizers, the cloth containing the fertilizer did not permit
The cation exchange capacity (CEC) is one of the most substantial contact between the organic materials of the
relevant soil components, representing the soil condition for organomineral sources and the soil. Variations in this
the movement of cations, such as calcium, magnesium, and variable were not expected.
potassium. Analysis of the results for each dose, as well as It is important to emphasize that the quality of the
the regression curve of the sources, indicate that the mineral compound used in the formulation of the organomineral
source released the greatest amount of these nutrients. fertilizer has a great influence on nitrogen availability in the
Moreover, there was a significant interaction among factors soil, whereby a very high C/N ratio can lead to nitrogen
(Table 2), and only two treatments differed from the control. immobilization (Jahnel et al., 1999). For this, it is necessary
There was a significant effect of fertilization on soil to promote the complete maturation of the compound,
saturation. However, it is important to note that while the ensuring the necessary degradation and stabilization of its
fertilizers surpassed the control, they did not increase the characteristics. In this study, the organic sources had
CEC to levels adequate for agricultural crops. Nevertheless, significantly different C/N ratios; 28 for the biosolid and 13
the values were generally higher for the biosolid source for the filter cake (Table 3).
70Differences were also observed in the Ca/Mg ratio, with the the Vale do Tijuco Sugar Mill (Table 3). Pelletized
highest values observed in treatments with mineral fertilizer organomineral fertilizer was produced by the balanced
(Table 4). This result was attributed to the increased addition of mineral components to the organic base until the
magnesium (Mg) content caused by the addition of organic NPK ratio was 5-17-10. Processing resulted in pellets 5 mm
fertilizers. However, fertilization did not cause great changes long and 0.8 mm in diameter, with hardness equal to 5
to the Ca/Mg ratio, noting that this relation is usually kgfꞏcm-3 and 10% moisture.
achieved by the addition of correctives to the soil. The incubation test using red sandy loam of loose texture
The relationships between bases and K were weak, as there (Table 5) was conducted using the method, "Solubility of
was no supply of calcium (Ca) and magnesium (Mg) in the Fertilizers Containing Silicon - Incubation Method," version
treatments (Table 4). Thus, potassium (K) being the 15.2010, with modifications (Korndörfer, 2004). Each
denominator caused almost all the treatments to present experimental plot consisted of a plastic container containing
results that were lower than the control results. However, 1 kg of fine dirt that was air dried (FDAD), plus fertilizer at
the Mg/K ratio of biosolid pelletized organomineral fertilizer the respective dose.
treatments did not differ from the control (Table 4), The fertilizers were packed in microfiber cloths positioned in
demonstrating that the nutrient supply was well balanced. 1 cm depths within the soil. This differed from the original
The relationships between CEC and nutrients followed a method, where the fertilizer was incorporated into the soil
similar pattern, explaining the effective contribution of K to by agitating them both in a plastic bag. The set was
the soil, whereas the results obtained for most treatments maintained with moisture close to 80% of the vessel’s
differed from those for the control (Table 4). It should be retention capacity, and the amount of water added was
noted that the Mg/K ratio with organomineral biosolids was determined by the difference in weight. The pots were
higher than that of the control and the other sources. The incubated for 60 days and samples were always taken from
base relations with the CEC confirmed the observed results. below the fertilizer-filled cloths. After collection, the samples
Moreover, the Mg/(CEC at pH 7[T]) ratio was higher than were dried, sieved, and analyzed to determine their chemical
that of the control in all doses of biosolid pelleted attributes.
organomineral fertilizer (Table 4). Generally, fertilization with
organomineral fertilizers promotes a good balance between Evaluation of soil chemical characteristics
soil nutrients and CEC, which is desirable with the
application of this type of fertilizer. The values of H2O (1:2.5), pH, SMP, and the content of
exchangeable aluminum, phosphorus, potassium, calcium,
Materials and Methods magnesium, silica, and organic matter in the soil were
evaluated (Teixeira et al., 2017) using methodology proposed
Formulation of the organomineral fertilizers and the by Korndörfer (2004).
experimental design
Statistical analyses
The experiment was conducted between 19/09 and 19/11 of
2016, in a greenhouse located at the Umuarama Campus of Data were tested for normality of residues (Kolmogorov-
the Federal University of Uberlândia (18°91′86″S, Smirnov) and homogeneity of variances (Levene). The data
48°27′72″W; 800 m above sea level). The experiment was were also submitted to an F test. All data were assessed at a
conducted in a completely randomized design, with four significance level of 0.01. Fertilizer sources were analyzed
replicates in the factorial scheme, 3 × 5 + 1. Three fertilizers using Tukey’s test, and fertilizer doses were analyzed by
were tested: organomineral fertilizers pelleted with biosolid regression to obtain the ideal statistical model. When the
or sugarcane filter cake (Table 3) (hereby referred to as regression models did not adjust (R2 ≥ 70%) they were
biosolid or filter cake), and mineral fertilizer. Five doses of omitted, and inferences were made on the differences
the three fertilizer sources (namely 60%, 80%, 100%, 120%, between the doses and the additional treatment (absence of
and 140% of the recommended dose of fertilizer for corn fertilization) by Dunnett’s test at a significance level of 0.05.
crops) were used, as well as a control, which undertook no
fertilization. For the mineral fertilizer, urea, triple Conclusions
superphosphate, and potassium chloride were used as
sources of nitrogen, phosphorus, and potassium, Pelletized organomineral fertilizers made from biosolids and
respectively. Fertilizer doses were defined based on the filter cake from sugarcane do not lead to acidification of the
recommended P2O5 content to be applied to soil (Soil soil, thereby reducing the quantity of soil correctives that
Fertility Commission of the State of Minas Gerais [CFSEMG], would usually be required. The contribution of these
1999). products stabilizes soil pH, reduces aluminum saturation,
The organomineral fertilizers were formulated at and promotes a better balance between soil bases.
concentrations of 5-17-10 (10% of total organic carbon
[TOC]). The sewage sludge used in the composition of the References
organomineral fertilizer came from the sewage treatment
plant of the Municipal Department of Water and Sewage Almeida Júnior AB, Nascimento CW, Sobral MF, Silva FB,
(DMAE), located in the city of Uberlândia-MG. The material Gomes WA (2011) Soil fertility and uptake of nutrients by
was sanitized with hydrated lime to eliminate pathogens, sugarcane fertilized with filter cake. Revista Brasileira de
reduce moisture, and for biological stabilization (Alves Filho Engenharia Agrícola e Ambiental, 15, 1004–1014.
et al., 2016). Additionally, the filter cake was obtained from
71Alves Filho A, Camargo R, Lana RMQ, Moraes MARB, Oliveira DP, de Camargo R, Lemes EM, Lana RMQ, Matos
Maldonado AICD, Atarasi RT (2016) Treatment of sewage ALIA, Magela MLM (2017) Organic matter sources in the
sludge with the use of solarization and sanitizing composition of pelletized organomineral fertilizers used in
productsfor agricultural purposes. African Journal of sorghum crops. African Journal of Agricultural Research,
Agricultural Research, 11, 184–191. 12, 2574–2581.
Comissão de Fertilidade do Solo do Estado de Minas Gerais Pires AMM, Mattiazzo ME (2008) Avaliação da viabilidade do
[CFSEMG]. (1999) Recomendações para o uso de corretivos uso de resíduos na agricultura. Embrapa Meio Ambiente.
e fertilizantes em Minas Gerais: 5ª aproximação. Circular Técnica.
Korndörfer GH (2004) Análise de silício: solo, planta e Prado RDM, Caione G, Campos CNS (2013) Filter cake and
fertilizante. Instituto de Ciências Agrárias, Universidade vinasse as fertilizers contributing to conservation
Federal de Uberlândia. agriculture. Applied and Environmental Soil Science, 2013.
Jahnel MC, Melloni R, Cardoso EJBN (1999) Urban solid Quintana NRG, Carmo MS, Melo WJ (2011) Sewage sludge as
waste maturity. Scientia Agricola, 56, 301–304. fertilizer: agricultural productivity and economic
Lehmann J, Kleber M (2015) The contentious nature of soil rentability. Nucleus, 8.
organic matter. Nature, 528, 60. Ramos LA, Lana RMQ, Korndorfer GH, Silva AS (2015) Effect
Magela MLM (2017) Sources of organic matter in the of organo-mineral fertilizer and poultry litter waste on
composition of pelletized organomineral fertilizers in sugarcane yield and some plant and soil chemical
maize (Master). Federal University of Uberlândia, properties. African Journal of Agricultural Research, 12,
Uberlândia, MG, Brazil. 20–27.
Meurer EJ (2006) Potassium. In Fernandes M, Mineral Resende Junior JC, Camargo R, Lana RMQ, Alves Filho A,
nutrition of plants (pp. 282–295). Viçosa, MG, Brazil: Matos ALA (2016) The effects of sewage sludge, mineral
Brazilian Society of Soil Science. and organic fertilizers on initial growth of Urochloa
Mota RP, Camargo R, Lemes EM, Lana RMQ, Almeida RF, brizantha cv Marandu (Hochst. ex A. Rich.) RD Webster.
Moraes ER (2018) Biosolid and sugarcane filter cake in the African Journal of Agricultural Research, 11, 3460–3470.
composition of organomineral fertilizer on soybean Rossol CD, Scalon Filho H, Berté LN, Jandrey PE, Schwantes
responses. International Journal of Recycling of Organic D, Gonçalves Jr AC (2012) Characterization, classification
Waste in Agriculture, 1–7. and disposal of waste in agriculture. Scientia Agraria
Nogueira MAFS, Garcia MS (2013) Gestão dos resíduos do Paranaensis, 11, 33–43.
setor industrial sucroenergético: estudo de caso de uma Sheldrick BH, Wang C (1993) Particle size distribution. p.
usina no município de Rio Brilhante, Mato Grosso do 499–512. MR Carter (ed.) Soil sampling and methods of
Sul. Revista Eletrônica em Gestão, Educação e Tecnologia analysis. Lewis Publ., Boca Raton, FL. Particle size
Ambiental, 17, 3275–3283. distribution. p. 499–511. In MR Carter (ed.) Soil sampling
Novais RF, Smyth TJ (1999) Fósforo em solo e planta em and methods of analysis. Lewis Publ., Boca Raton, FL.
condições tropicais (No. 631.422 N934). Universidade Teixeira WG, Sousa RTX, Korndörfer GH (2014) Response of
Federal de Vicosa, Vicosa, MG (Brasil). Departamento de sugarcane to doses of phosphorus provided by
Solos. organomineral fertilizer. Bioscience Journal, 30.
Teixeira PC, Donagemma GK, Fontana A, Teixeira WG (2017)
Manual de Métodos de Análise de Solo. Embrapa Solos-
Livro técnico (INFOTECA-E).
71
72You can also read