Chicago Transit Authority Service Standards - Transit Operations Division Planning & Development Service Planning PSP-x01005 July, 2001
←
→
Page content transcription
If your browser does not render page correctly, please read the page content below
Chicago Transit Authority
   Service Standards

     Transit Operations Division
      Planning & Development
          Service Planning
             PSP-x01005
              July, 2001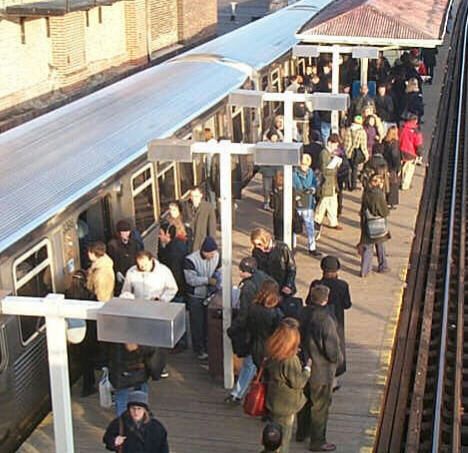
Table of Contents

EXECUTIVE SUMMARY ......................................................................................................................... 3

CHAPTER 1: OVERVIEW ....................................................................................................................... 5

CHAPTER 2: GOALS AND OBJECTIVES ............................................................................................. 7

CHAPTER 3: SERVICE DELIVERY GUIDELINES ................................................................................ 9
   TYPES OF CTA SERVICE ......................................................................................................................... 9
   SERVICE DESIGN MEASURES ................................................................................................................ 11
     Service coverage ............................................................................................................................ 12
     Span of service ............................................................................................................................... 13
     Frequency of service ...................................................................................................................... 18
     Passenger flow ............................................................................................................................... 19
     Minimum productivity ...................................................................................................................... 23
   FACILITIES & CUSTOMER AMENITIES MEASURES .................................................................................... 24
     Distribution of revenue equipment ……………………………………………………………………. 25
CHAPTER 4: SERVICE CHANGE PROCESS ..................................................................................... 26
   ANNUAL SERVICE BUDGET PROPOSAL ................................................................................................... 26
   SERVICE CHANGE PROCESS OVERVIEW ................................................................................................ 26
   SCREENING .......................................................................................................................................... 29
   EVALUATION PROCESS ......................................................................................................................... 29
   SEMI-ANNUAL REVIEW .......................................................................................................................... 31
CHAPTER 5: SERVICE MONITORING & REPORTING ..................................................................... 32
   MONITORING & DATA COLLECTION ........................................................................................................ 32
   REPORTING .......................................................................................................................................... 32
CHAPTER 6: PUBLIC PARTICIPATION PROCESS ........................................................................... 33
   OUTREACH TO CUSTOMERS .................................................................................................................. 33
   OUTREACH TO THE PUBLIC, COMMUNITIES AND ELECTED OFFICIALS ....................................................... 33
   PUBLIC MEETINGS AND HEARINGS ......................................................................................................... 34
APPENDIX A: BUS AND RAIL DESIGN GUIDELINES ....................................................................... 35

APPENDIX B: CALCULATING SERVICE COSTS .............................................................................. 41

APPENDIX C: SERVICE PROPOSAL EVALUATION WORKSHEETS .............................................. 43

APPENDIX D: NICHE MARKET SERVICES ........................................................................................ 51

BIBLIOGRAPHY ................................................................................................................................... 56

                          Service Standards                                                                                                       2
EXECUTIVE SUMMARY

The CTA’s mission is to deliver quality, affordable transit services that link people, jobs, and
communities. The Service Standards lay out a framework for achieving our mission.

The Chicago Transit Authority’s (CTA’s) service area is vast – 262 square miles – and its
resources are limited. The Service Standards document provides a framework for guiding
decisions on which services will best serve our customers’ varied travel needs while allowing
the CTA to remain within its budgetary limits.

The service standards provide a framework for a consistent and fair evaluation of both
existing and proposed services. Because markets, customer expectations and CTA’s
resources change over time, service standards are evolutionary by nature. CTA must be
responsive to these changes in order to retain current customers and achieve and sustain
ridership growth.

This document discusses the details of the standards and how they are used in decision-
making at the CTA.

THE STANDARDS

The dynamic nature of development and changing travel markets in the service area requires
constant review of new service, service expansion, or service reduction options. CTA must
be able to rationally evaluate service changes and make adjustments to service within the
constraints of budget and equipment availability. The Service standards are guidelines for
resource allocation decisions. Five key measures that have the greatest influence on service
design are discussed: coverage, span of service, frequency of service, customer flow, and
minimum productivity.       Each standard is summarized below, and the minimum or
maximum limits for each feature are cited.

CTA’s service coverage policy determines the average customer walk to get to a CTA bus stop
or rail station at certain times of the day. CTA’s service coverage standard is to provide a
maximum walk distance of ½ mile to the nearest route during most time periods.

Span of service, the hours and days a route operates, is based on a balance of market demand
and service coverage. For key routes, services are offered seven days a week, generally a
minimum of 16 hours. Support routes are market-driven.

Service frequency governs how long customers wait for service. The maximum interval
between buses and trains is 30 minutes.

Passenger flow determines how crowded the vehicle will be when it arrives at the busiest
location on a route. On the most crowded bus routes, an average of 60 customers per bus at

                Service Standards                                                          3
the busiest locations will be scheduled during peak periods. For rail services, an average of
90 customers per car will be the maximum planned load.

For bus service that runs every 30 minutes, the minimum productivity is 30 boarding
passengers per hour. Services that do not meet the minimum become candidates for
elimination.

The Service Standards document also contains guidelines for 1) stop spacing, 2) the
distribution of facilities and customer amenities at rail stations and bus stops, 3) calculating
service costs, and 4) the public participation process.

THE PROCESS

In support of the annual budget process, the Annual Service Budget Proposal is developed
that proposes major, moderate, and minor service changes, in accordance with CTA goals,
for the next year. Service proposals can only be implemented if they comply with the
budget.

Minor service changes are routine small changes to better align services with demand. These
include adjustments to intervals between buses or trains and running time, span of service
changes of ½ hour or less, and changes to bus stop locations.

Moderate changes are small changes to service with limited impact and modest costs. This
change type includes special event services, reroutes of less than one mile, and route
extensions of up to one mile.

Major service changes have a significant impact on customers and resources. These include
route changes affecting more than 25% of a route's passengers, route miles or vehicle miles
and changes requiring new facilities and/or capital expenditures of a cost level that requires
board approval.

Service proposals are received, screened, and evaluated throughout the year. Minor service
changes and most moderate changes are implemented throughout the year as schedules are
revised. Major changes and moderate changes that require Board approval are subject to a
semi-annual review where they are ranked in terms of financial performance against other
proposals. These changes are presented to the Board twice per year.

                Service Standards                                                          4
Chapter 1: Overview
A brief overview of the Chicago Transit Authority will illustrate the breadth
of services provided and the importance of having a set of tools to guide
service decisions.
CTA IN BRIEF
The Chicago Transit Authority (CTA) is the second largest transit
system in the country, providing 450 million rides each year. The CTA
service area consists of the City of Chicago and 38 surrounding Nearly 2,000 buses
suburbs, which have a total population of approximately 3.7 million average 200,000
persons. CTA provides approximately 1.5 million rides on an average miles per day.
weekday and plays an important part in keeping the regional economy
139 routes cover
running by providing about 560,000 work trips every weekday. 1,900 miles with
over 12,000 bus
Because many Chicagoans live within ¼ mile of CTA service, they stops.
have easy access to a service that provides extensive coverage to
1,190 rail cars
neighborhoods and many major attractions in the region. In fact, over
traverse 170,000
half of all trips taken on CTA are for school, shopping, socializing or miles per day over
entertainment. Eighty percent of transit trips in the region are taken on 289 miles of track.
CTA.
7 rail lines include
12 branches and
142 stations.
LINK TO OUR MISSION
CTA’s mission is to deliver quality, affordable transit services that link
people, jobs, and communities. It reflects issues that are important to
our customers, as expressed in the CTA's Customer Satisfaction
Surveys. Service standards guide the planning and design of transit
service in support of the CTA’s mission.
Affordability, for our customers and for the CTA, is always a concern.
We must provide services that are attractive enough to fill seats and
meet productivity needs. At the same time, we must keep fares
affordable. From a corporate standpoint, externally imposed funding
constraints affect the amount of service that we provide.
THE NEED FOR SERVICE STANDARDS
The major goal of the service standards is to provide a framework for a
consistent and fair evaluation of both existing and proposed services.
Service Standards 5Because markets, customer expectations and CTA’s resources change
over time, service standards are evolutionary by nature. CTA must be Service Standards:
responsive to these changes in order to retain current customers and
achieve and sustain ridership growth. Offer a level of
objectivity in
decisions for
The relationship between our service standards and our budget is distribution of
dynamic. The level of service CTA provides to our customers has a CTA resources
direct effect on our operating and capital budgets. In turn, our service throughout our
standards affect the amount of service that we put on the street. service area;
Furthermore, the amount of service must be provided within the Communicate
bounds of limited financial resources. the key
attributes of
Balancing customer expectations and budget constraints is a difficult CTA service
challenge. CTA’s existing services must be monitored and modified policy to the
public; and
continually to match service levels to demand and respond to
opportunities for new or improved services. Since the first Service
Describe the
Standards document was issued in 1990, it has formed the basis of the process for
service adjustments the CTA has made in response to changing considering
ridership trends. service
changes.
The dynamic nature of development and changing travel markets in
the service area requires constant review of new service, service
expansion, or service reduction options. CTA must be able to
rationally evaluate service changes and make adjustments to service
within the constraints of budget and equipment availability.
This Service Standards document has been developed to provide a
rational and consistent basis for the provision of CTA service by
directing the technical analyses of service productivity and the
evaluation of the merits of proposed services.
The remainder of the document is organized as follows:
The goals and objectives of the Service Standards, in Chapter 2;
A description of the service standards, in Chapter 3;
The service change process, in Chapter 4;
The methods for monitoring and reporting on service, in Chapter 5
A description of the public participation process, in Chapter 6.
The Appendices provide more discussion on selected policies and
standards presented in the body of the document.
Service Standards 6Chapter 2: Goals and Objectives
The purpose of the Service Standards is to ensure that service meets
customers’ needs and that CTA service is provided in a cost-effective manner.
The following fundamental goals and their objectives provide context
for the service guidelines:
1. Ensure the design of effective, efficient, and equitable transit
service.
OBJECTIVES
Design cost-effective transit service that supports both existing
and emergent origin-destination patterns.
Enhance the key bus and rail networks to ensure critical
regional mobility and to ensure that all neighborhoods have
access to CTA service.
Apply a cost-effectiveness standard while recognizing the
special needs of various customer groups.
Distribute services and customer amenities based on ridership,
equity, and geographic balance.
2. Provide a uniform and consistent methodology for planning,
designing, and evaluating transit services and proposals within
applicable laws and regulations.
OBJECTIVES
Develop a consistent, regular process for improving service in
those areas with demonstrated or potential demand.
Address customer and community service needs and requests
in a consistent, fair and thorough manner by better engaging
local communities in the service planning and delivery process.
Formulate a firm service evaluation process that addresses
reviewing, proposing, receiving, screening, evaluating,
recommending, and approving service changes.
Evaluate and implement services consistent with Title VI and
the Americans with Disabilities Act (ADA) requirements.
Service Standards 73. Provide mobility to our customers by responding to changing
travel patterns and new market opportunities.
OBJECTIVES
Encourage intermodal services and connections that maximize
the trip-making options available to customers.
Monitor the results of customer service and satisfaction surveys
to support service changes that will improve CTA’s overall
performance.
Develop sustainable service that supports the City’s and
region’s development plans and initiatives.
Service Standards 8Chapter 3: Service Delivery Guidelines
The Service Delivery Guidelines section describes service design guidelines and
procedures for service allocation, and customer amenities.
TYPES OF CTA SERVICE
The CTA operates an integrated transit system designed to provide both
maximum access to the downtown and comprehensive local service
throughout the service area.
The following types of CTA services are offered:
Bus
Rail (Rapid Transit)
Paratransit Service
Special Events Services
Niche Market Service
Flexible Services
Bus
The flat geography of Chicago has led to a grid arterial street pattern Two-thirds of all
and bus service that follows this arterial street pattern with a network of CTA rides are
long north-south and east-west routes. During most service periods, this taken on bus. Key
bus routes carry
grid configuration is the most efficient means of supplying convenient
almost half of all
bus service between the diverse origins and destinations throughout our CTA customers and
service area. It provides the maximum number of route combination are the primary
choices for the customer. The network relies on being able to transfer focus for service
between routes and services reliably and conveniently. changes on the bus
system.
“Key” routes and “support” routes define the bus system. Key routes
provide the backbone of CTA service. They include the most productive
bus routes, plus additional routes to provide basic geographic coverage.
Support routes are the remaining routes. They support the rail and key
bus network by serving a variety of important specialized functions that
enhance the quality of service and improve market share. Two-thirds of
all CTA rides are taken on the bus system. Key bus routes provide
nearly half (47%) of all CTA rides.
Rail (Rapid Transit)
Rail lines developed radially, aiming at the concentrated needs of the
downtown. With its high speed, rail is the preferred mode of travel to
the downtown, but also provides regional mobility.
The rail system consists of seven routes, with 12 branches, that operate
over track on largely grade-separated private right-of-way. Rail offers
Service Standards 9speedy service to persons generally needing to make longer trips in the
service area. About one-third of all CTA rides are taken on rail. About
50% of rail passengers also use a bus for part of their journey.
Paratransit Services
CTA’s paratransit program was initiated in 1981. The CTA currently
contracts with three carriers and many taxicab companies to provide
door-to-door service for customers with disabilities and their
companions. Special Services programs are highly regulated.
The Americans with Disabilities Act defines the standards for
paratransit. Service coverage is defined by the ADA as within 3/4 mile
of fixed route service. Span of service is the same as fixed route.
Frequency is on demand.
Special Events Services
CTA provides additional bus and/or rail service on regularly scheduled
routes for the City’s many special events to help reduce traffic
congestion. Because these services are temporary, and have atypical
operating characteristics, they may not follow regular service guidelines.
Niche Market Services
Niche market services are developed in response to a demonstrated
need for specialized transit services. These services are open to the
public and can include modifications to existing bus routes or new
routes for shift changes and other work purposes. Services can also be
tailored for large employment centers, universities, high schools,
medical centers, sports venues, industrial parks and other large traffic
generators.
In some instances, CTA will enter into a financial partnership with
organizations, such as museums, not-for-profit agencies, local
governments and businesses to provide these niche market services. In
these agreements, the partnering organization provides subsidy that, in
combination with the projected customer revenue, meets variable cost
for a particular service. (See Appendix D: Niche Market Services for more
detail.)
Flexible Services
Flexible service was proposed in the 1997 study1 by Booz-Allen and
Hamilton, a management-consulting firm, as a means to balance
customer needs with productivity goals. The routes proposed by Booz-
Allen for replacement with flexible service were poor performers, and
1
Chicago Transit Authority Service Restructuring Proposal, Booz-Allen and
Hamilton, May 1997. This proposal provided the underlying analysis for the Service
Restructuring adopted by the Board in July 1997 and the underlying basis for this
work was the Service Standards document of 1990.
Service Standards 10the consultants believed the service should be eliminated. However,
doing so would abandon all service in certain neighborhoods. Booz-
Allen recommended a compromise to service abandonment by
suggesting implementation of non-traditional, or flexible service.
Flexible services, generally provided by smaller vehicles than standard
buses, would supplement the key and support bus network and rail
systems. CTA and a consultant are currently studying the viability of
flexible service options in four demonstration areas. If found viable,
service standards and policies for flexible services will be added to the
Service Standards after the conclusion of the study.
SERVICE DESIGN MEASURES
There are five key measures that influence fixed route service design:
Service Coverage,
Span of Service,
Frequency of Service,
Passenger Flow, and
Minimum Productivity.
These measures enable CTA to determine appropriate levels of service to
meet current demand, while maximizing use of equipment and
manpower. Changes to any one of the guidelines affect the size and cost
of services and the attractiveness of the service to existing and potential
customers. Therefore each guideline is important and all are used in
conjunction to make service decisions. Appendix A: Bus and Rail Design
Guidelines has more detail about design considerations.
Service Standards 11Service Coverage
CTA’s service coverage policy is to provide a maximum walk distance of
½ mile to transit service during peak periods within the statutory service
area where CTA has franchise agreements in place. In the suburban
Cook County portion of the CTA’s service area, Pace and Metra services
overlap that of CTA. As Table 1 illustrates, the most intense service
grid, when routes are closest together, is supported during weekday
peak hours. As demand declines, the density of routes thins. Walk
distance increases as demand lowers along the fringes of the service area
and during low demand time periods.
Table 1.
Guideline for Bus Grid System
DISTANCE TYPICAL WALK
TIME PERIOD BETWEEN ROUTES DISTANCES
Weekday peak
High Density ½ mile ¼ mile
Low Density 1 mile ½ mile
Weekday Midday/Evening 1 mile ½ mile
Saturday and 1 mile ½ mile
Sunday/Holidays
Owl 2 miles 1 mile
This coverage policy is tied to the key route bus network. The 46 key Standard: CTA's
routes are primarily spaced 1 mile apart, which means for the standard for
minimum 16-hour period that they operate, the typical walk distance service coverage
through most of the network will be ½ mile. is to provide a
maximum walk of
1/2 mile during
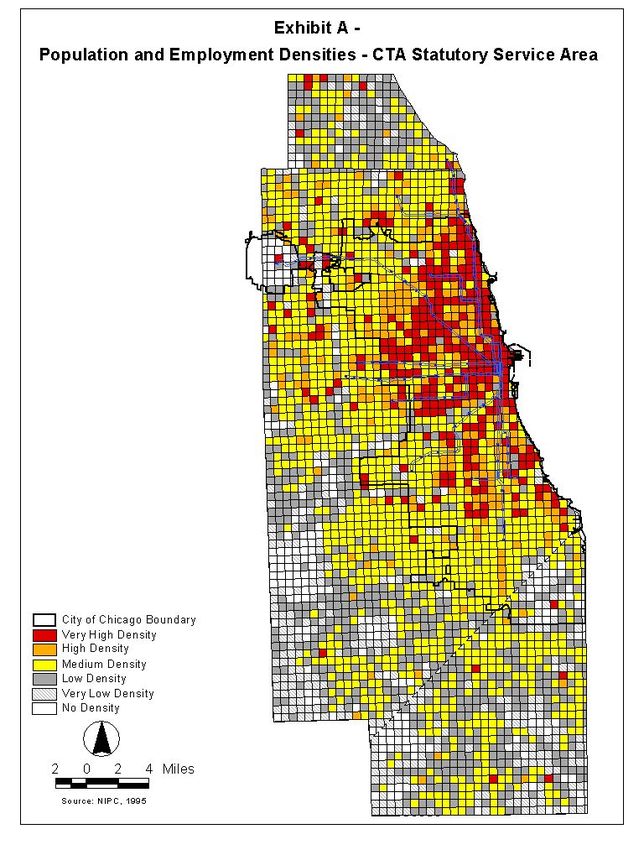
Due to population and employment shifts in the service area, CTA most periods.
regularly makes adjustments in its service to reflect changing markets.
Population and employment densities for CTA's statutory service area
are shown in Exhibit A, while Exhibit B illustrates the relationship
between population and employment density and peak services
offered by CTA, Pace and Metra. As this map shows, during the peak,
with few exceptions, the City of Chicago is very well served. As
densities decline, routes are spaced farther apart.
There are certain instances when the coverage policy cannot be rigidly
followed. These instances include the following:
Topographical and street network restrictions may cause some
gaps in service.
Service Standards 12 In suburban areas, bus coverage is shared with Pace Suburban Bus.
In these areas, the combined CTA/Pace service provides coverage
appropriate for the area's density and ridership demand.
The specific alignment of routes is selected to serve known demand
and more dense areas of the coverage area. In this case, ideal
spacing can be lost.
It may be infeasible to modify existing routes without hurting
established and productive markets.
Routes are designed to operate as directly as possible. However, there
are times when a route deviation is recommended to bring service
closer to a major trip generator such as an employer. The decision to
deviate a route must balance the effect on existing on-board customers
with any potential gain in new customers. (See Appendix A: Bus and
Rail Design Guidelines.)
Service coverage is a consideration for all customers, but especially for
persons with disabilities. With both bus routes and rail stations, CTA
works with the ADA Advisory Committee to determine routes and
stations which will be designated accessible. All new rail stations are
built as accessible stations and CTA follows all applicable
requirements of the ADA and the Illinois Accessibility Code when
renovating or rebuilding stations. It is CTA’s policy that when a bus
route is designated as accessible, all buses assigned to the route are
accessible.
Service Standards 1314 Service Standards
Span of Service
Span of service refers to the hours that service is provided and defines   Standard: For
the minimum period of time that service will operate at any point in       the 46 key routes,
                                                                           services are
the system. This provides customers with the confidence that direct        offered seven days
and connecting service will be provided during the span hours.             a week, generally
                                                                           for a minimum of
For the 46 key routes, services are offered every day, usually for at      16 hours.
least 16 hours. Span of service for support routes is determined by        Support routes
                                                                           are market-
demand. Key and support routes are illustrated in Exhibit C and
                                                                           driven and
Exhibit D and are listed in the Tables 2 and 3 below.                      justified by
                                                                           demand.
Span of service standards govern when service will be operated by
time of day and day of week based on passenger boardings for bus
and passenger entries for rail stations. Data from automated fare
collection (AFC) equipment is used. For existing bus routes, time
periods during which the number of boardings per vehicle hour fall
below an established minimum would be candidates for elimination in
that period, as explained below in Minimum productivity.

Table 2.
                           CTA Key Routes
3    King Drive         49    Western               77 Belmont
4    Cottage Grove      49B   North Western         79 79th
6    Jeffery            52A   South Kedzie          80 Irving Park
8    Halsted            53    Pulaski               81 Lawrence
9    Ashland            53A   South Pulaski         82 Kimball/Homan
12   Roosevelt          54    Cicero                84 Peterson
20   Madison            54B   South Cicero          85 Central
21   Cermak             55    Garfield              87 87th
22   Clark              60    Blue Island/26th      90 Harlem
28   Stony Island       62    Archer                95E 93rd/95th
29   State              63    63rd                  95W 95th
34   South Michigan     66    Chicago               119 119th
35   35th               67    67th/69th/71st        151 Sheridan
36   Broadway           71    71st                  155 Devon
39   Pershing           72    North
47   47th               74    Fullerton

                Service Standards                                                   15
Table 3.
CTA Support Routes
1 Indiana/Hyde Park 56 Milwaukee 108 Halsted/95th
2 Hyde Park Express 56A North Milwaukee 111 Pullman 111th/115
3L King Drive Limited 57 Laramie 112 Vincennes/111th
N5 South Shore Night 59 59th/61st 120 N. Western/Wacker
7 Harrison 62H Archer/Harlem 121 Union/Wacker
8A South Halsted 63W West 63rd 122 IL Center/N. Wester
11 Lincoln 64 Foster-Canfield 123 IL Center/Union
14 South Lake Shore 65 Grand 125 Water Tower
17 Westchester 68 Northwest Highway 126 Jackson
18 16th/18th 69 Cumberland/E. Riv 127 NW/Madison
X21 Cermak Express 70 Division 129 W. Loop/So. Loop
24 Wentworth 73 Armitage 135 Wilson/LaSalle
25 West Cermak 75 74th-75th 136 Sheridan/LaSalle
27 South Deering 76 Diversey 145 Wilson/Michigan
30 South Chicago 78 Montrose 146 Marine Michigan
33 Mag Mile Express 81W West Lawrence 147 Outer Drive
37 Sedgwick/Ogden 85A North Central 152 Addison
43 43rd 86 Narragansett/Ridge 156 LaSalle
44 Wallace-Racine 88 Higgins 157 Streeterville
48 South Damen 90N North Harlem 165 W. 65th
49A South Western 91 Austin 169 69th /UPS
X49 Western Express 92 Foster 170 U of C Midway
50 Damen 93 N. California 171 U of C Hyde Park
51 51st 94 S. California 172 U of C Kenwood
52 Kedzie/California 96 Lunt 173 U of C Lakeview
53AL S. Pulaski Limited 97 Skokie 201 Central/Sherman
54A N. Cicero/Skokie 100 Jeffery Manor Exp. 202 Main/Emerson
55A 55th/Austin 103 West 103rd 203 Ridge/Grant
55N 55th/Narragansett 106 East 103rd 204 Dodge
Part Time / Seasonal Routes
10 Museum of Science 124 Navy Pier Exp. 130 Grant Park Treas.
19 United Center Exp. 128 Soldier Field Exp. 154 Wrigley Field Exp.
Span of service extensions are considered when:
The hour immediately before the end of the current service or after the
beginning of the current service shows productivity greater than the
average system productivity (bus or rail) for that hour.
New or revised employee shift changes or extension of business hours
create a demand for service.
Span of service, when provided during the Owl period, is primarily market
driven with consideration given to coverage and equitable service
distribution. Owl service is provided to protect work trips in the strongest
markets and to maintain some coverage in those markets at all times.
Service Standards 16Exhibit C Exhibit D
Support
Key
Bus Routes
Bus Routes
Service Standards 17Frequency of Service
Service frequency is established to provide a sufficient number of Standard: The
vehicles to accommodate passenger volume, at the most crowded maximum
interval for the
location(s), during a given time period. On heavily traveled lines and
mainline portion
routes, the frequency of service provided is a function of demand and of bus and rail
peak period loading levels (described in passenger flow section). service is 30
minutes.
This document establishes minimum levels of service that will dictate
the frequency of service. This is intended to maintain basic mobility for
the region at all times.
The longest policy interval for buses and for trains is 30 minutes.
Because CTA service is interconnected, 30-minute service is considered
a minimally usable level of service for bus and rail. This minimum
provides service reliability for transferring passengers and is for the
mainline portion of services. Where a rail line or bus route splits into
branches, there is a possibility that due to low levels of demand, the
branches may have service intervals of longer than 30 minutes.
Service Standards 18Passenger Flow
Service frequency and passenger flow are very closely related. Above Standard: A
the minimum service levels, service frequency is determined by scheduled
customer demand. Each bus and rail service is evaluated in terms of capacity of 60
passenger flow, which is defined as the number of passengers on buses passengers per
or rail cars, at the busiest location(s) along the route, called maximum bus at the busiest
locations will be
load point(s). Table 4 shows the relationship between passenger flow used for
and service frequency for peak period service. scheduling bus
frequency during
peak periods. For
Table 4. rail, a scheduled
Passenger flow Interval Avg. # of Train capacity of 90
passengers per
Mode per ½ hr* between passengers length
car will be used.
vehicles per bus/car
Bus 300-360 5 minutes 50-60 --
Rail 3840-4680 4.5 minutes 75-90 8
Rail 3510-4050 4 minutes 75-90 6
*In one direction.
For the level of service illustrated in the table, the typical bus will have
between 50 and 60 passengers on board, which includes 10 to 20
standees. On less well-utilized routes and in non-peak times, shorter
intervals between buses are scheduled when justified by demand. For
peak period rail services, the typical car will have between 75 and 90
persons on board or 35-50 people standing.
For articulated buses, the maximum scheduled passenger flow is 93
persons, accommodating up to 28 standees. At this level of passenger
flow, service frequency for artics is about every five minutes.
Passenger flow standards will be revisited, as needed, particularly
when new vehicles with different seating configurations are purchased.
Rail frequency guidelines determine appropriate service levels for a
given level of demand (passengers per half-hour at the maximum load
point). The level of service is expressed in terms of the number of cars
per half-hour and the resultant trips per half-hour and interval for a
given maximum train length. The Brown, Purple, and Green Lines
operate at a maximum train length of six-cars, while the Yellow Line is
a shuttle limited to two-car trains. All other routes operate eight-car
trains in the peak.
The guidelines allow for a scheduled load of no more than 90
passengers per rail car.
Table 5, Table 6 and Table 7 show service levels for bus for peak and off
peak time periods.
Service Standards 19Table 5.
Standard Buses
Bus Service Levels for 60 Passenger Maximum Load
(Peak Periods)
Passenger flow per ½ hr Service Interval Passengers on Bus
(Minutes) (Average for period)
< 30 30 < 30
30-60 20 20-40
60-90 15 30-45
90-125 12 35-50
125-165 10 40-55
165-240 7.5 40-60
240-300 6 45-60
300-360 5 50-60
> 360 560 210 < 10 30-40
Evening (Everyday < 40 30 < 20
between 7 p.m. and 40-60 20 13-20
midnight) 60-100 15 15-25
100-125 12 20-25
>125 < 10 21-30
Owl (Everyday < 30 30 < 15
between midnight and 30-60 20 10-20
5 a.m.) > 60Table 8 and Table 9 illustrates the rail service levels for peak and off-peak time periods.
CTA RAIL SYSTEM
Table 8. Peak Period Service (Weekdays 6:00am-9:00am and 3:00pm-7:00pm)
Every Half-Hour at Most Crowded Location 8-Car Trains 6-Car Trains 4-Car Trains 2-Car Trains
Passengers Cars Avg. per Car Trips Interval Trips Interval Trips Interval Trips Interval
6,121 - 7,200 80 77 - 90 10.0 3.0
5,401 - 6,120 68 79 - 90 8.5 3.5
4,681 - 5,400 60 78 - 90 7.5 4.0
4,591 - 5,400 60 77 - 90 10.0 3.0
3,841 - 4,680 52 74 - 90 6.5 4.5
4,051 - 4,590 51 79 - 90 8.5 3.5
3,511 - 4,050 45 78 - 90 7.5 4.0
3,521 - 3,840 48 73 - 80 6.0 5.0
2,801 - 3,520 44 64 - 80 5.5 5.5
2,881 - 3,510 39 74 - 90 6.5 4.5
2,641 - 2,880 36 73 - 80 6.0 5.0
2,521 - 2,800 40 63 - 70 5.0 6.0
2,101 - 2,640 33 64 - 80 5.5 5.5
2,381 - 2,520 36 66 - 70 4.5 6.5
1,891 - 2,100 30 63 - 70 5.0 6.0
1,921 - 2,380 34 57 - 70 4.3 7.0
1,681 - 1,920 32 53 - 60 4.0 7.5 8.0 3.8
1,751 - 1,890 27 65 - 70 4.5 6.5
1,441 - 1,680 28 51 - 60 3.5 8.5 7.0 4.3
1,441 - 1,750 25 58 - 70 4.2 7.0
1,201 - 1,440 24 50 - 60 3.0 10.0
1261 - 1440 24 52.5 - 60 4.0 7.5 6.0 5.0
1081 - 1260 21 51.5 - 60 3.5 8.5
961 - 1200 20 48.1 - 60 5.0 6.0
901 - 1080 18 50.1 - 60 3.0 10.0
841 - 960 16 52.6 - 60 4.0 7.5
721 - 900 15 48.1 - 60 2.5 12.0
721 - 840 14 51.5 - 60 3.5 8.6
551 - 720 12 45.9 - 60 2.0 15.0 3.0 10.0
441 - 550 10 44.1 - 55 2.5 12.0 5.0 6.0
331 - 440 8 41.4 - 55 2.0 15.0 4.0 7.5
276 - 330 6 46.0 - 55 3.0 10.0
201 - 275 5 40.2 - 55 2.5 12.0
151 - 200 4 37.8 - 50 2.0 15.0
Service Standards 21Table 9.
CTA RAIL SYSTEM
Frequency of Service Guidelines
Off-Peak Period Service
Every Hour at Most Crowded Location 8-Car Trains 6-Car Trains 4-Car Trains 2-Car Trains
Passengers Cars Avg. per Car Trips Interval Trips Interval Trips Interval Trips Interval
2,561 - 3,200 80 32 - 40 10.0 6.0
2,401 - 2,560 64 38 - 40 8.0 7.5
1,921 - 2,400 60 32 - 40 7.5 8.0 10.0 6.0 15.0 4.0
1,601 - 1,920 48 33 - 40 6.0 10.0 8.0 7.5 12.0 5.0
1,441 - 1,600 40 36 - 40 5.0 12.0 10.0 6.0
1,281 - 1,440 36 36 - 40 6.0 10.0
1,051 - 1,280 32 33 - 40 4.0 15.0 8.0 7.5
841 - 1,050 30 28 - 35 5.0 12.0 7.5 8.0
701 - 840 24 29 - 35 4.0 15.0 6.0 10.0 12.0 5.0
561 - 700 20 28 - 35 5.0 12.0 10.0 6.0
421 - 560 16 26 - 35 4.0 15.0 8.0 7.5
301 - 420 12 25 - 35 6.0 10.0
241 - 300 10 24 - 30 5.0 12.0
181 - 240 8 23 - 30 4.0 15.0
121 - 180 6 20 - 30 3.0 20.0
61 - 120 4 15 - 30 2.0 30.0
0 - 60 2 0 - 30 1.0 60.0
Service Standards 22Minimum productivity
CTA tracks and regularly reports ridership and productivity. For bus,
ridership and productivity are reported by route for Weekday, Saturday Standard: For
and Sunday/holiday service. Bus route productivity is reported in terms bus, minimum
of passengers boarding per bus hour. The standard is 30 boardings per productivity is 30
bus hour when the service interval is 30 minutes. Services that do not passengers
boarding per bus
meet the standard become candidates for elimination.
hour, when the
service interval is
Rail station productivity is measured by line and by station. Station 30 minutes.
productivity is measured by looking at passenger entries per station and
costs of operating the station. Line productivity is measured by
comparing the total entries at all stations on the line and dividing by the
total operating costs of the line.
In its reporting of productivity, staff will provide performance targets,
such as productivity requirements for variable cost break-even, system
average productivity and others based on the fare structure and cost
structure. See Appendix B: Calculating Service Costs for more information.
Particular focus is given to the change in ridership and productivity over
time for each service. Significant changes are further evaluated for each
hour of service in order to identify opportunities to improve service and
service productivity.
Service Standards 23FACILITIES & CUSTOMER AMENITIES MEASURES
Bus
Stop spacing
Bus stops are normally located at major cross-street intersections and/or
traffic generators. In most instances, stops will be about ⅛ mile apart (a
standard Chicago block), depending on the neighborhood density. For
limited-stop service, stops are made at widely spaced stops, with the
local route making all stops.
Amenities
Bus customer shelters, benches, future electronic travel information signs
and other features make CTA service more comfortable, safe and
friendly. These amenities are distributed by factors that consider equity
in distribution throughout the service area, the utility of the benefit to
the user and site-related constraints. Additionally, high consideration is
given to stops on key bus routes due to a generally higher level of
demand.
Priority for amenities is given to stops that have:
Large numbers of passengers who board at the location,
Lengthy wait times between buses,
High percentage of transfer passengers, and
High percentage of seniors or disabled persons using it.
Rail
Investment considerations
Unlike bus stops, stations are major facilities that have their own
operating costs (customer assistants, security and maintenance) and are
a considerable capital asset to build, maintain and, often, to rebuild.
Station changes are generally considered at the time of investment or
reinvestment in the asset. In addition to the physical condition of the
station, of great importance to a CTA investment decision is the future
customer market for the station, relative to the size of the investment
and the associated operating cost. Priority is given to stations where
growth is expected to occur.
Investment decisions are based on:
Passenger entries at that station,
Station operating cost per passenger,
Station spacing (described below),
Land development around the station and
Ridership on the line and branch that the station will serve.
Service Standards 24Station spacing
Station spacing is based on demand and also differs based on the
purpose of the rail segment. Line-haul segments should have wider
station spacing as competitive speeds are maintained, while collector
and distributive segments may have closer station spacing to reduce
walk times. Station spacing is considered both for the impact on
passengers on trains that may be delayed, and on the impact of the new
facility on the markets of adjacent stations.
See Appendix A: Bus and Rail Design Guidelines for more information.
Distribution of Revenue Equipment
There are several factors to consider when distributing revenue
equipment. When assigning or reallocating revenue equipment, the
following criteria are used:
Accessibility – Our first priority is to make all routes accessible. As
older, non-accessible buses are retired and new accessible buses
replace them, the fleet will eventually become 100% accessible.
CTA’s Planning and Development Department and ADA
Compliance Officer are continuing to work with the ADA Advisory
Committee to determine how to deploy new buses until the fleet is
100% accessible.
Air Conditioning – The geographic allocation of air-conditioned
buses is a high concern for our customers. When distributing buses,
each garage should have roughly the same percentage of air-
conditioned buses. Again, as older, non air-conditioned buses are
replaced with new air-conditioned buses the fleet will eventually be
100% air-conditioned.
Average Age – There is a wide range of older and newer buses in
CTA's fleet. The average age at each garage should be roughly equal.
As we acquire new buses our average fleet age will decrease.
Number of Bus Types at Each Garage – In order to maximize
maintenance performance and maintain adequate stockroom space
for maintenance parts at each garage, the number of bus types at
each garage should be kept to a maximum of four, optimally three.
Service Standards 25Chapter 4: Service Change Process
The CTA has a structured process for evaluating services and proposed changes
that is tied to the annual budget, yet is responsive to small market changes
throughout the year.
As part of the on-going review of the performance of all routes and
services and consideration of service change proposals, moderate and
major service changes are to be brought to the Board for approval twice
a year. Minor service changes are analyzed on an ongoing basis and can
be implemented at each section pick (the occasion when schedules are
updated and operators can pick their work).
This process includes the following features:
Development of an Annual Service Budget Proposal,
A transparent process for evaluating service changes,
Accountability and flexibility in minor and major service change
decisions, and
A semi-annual comparative evaluation for major changes.
ANNUAL SERVICE BUDGET PROPOSAL
In support of the annual budget process, Planning & Development
develops an Annual Service Budget Proposal that identifies budget
needs for each service change type for the next year's budget. This
proposal is based on a review of the performance of all routes and the
service change proposals received.
Once adopted, the Annual Service Change Budget guides the service
changes that will be evaluated and implemented over the budget year.
The Service Change Budget contains allotments for various
classifications of service changes such as improvements, reductions and
major, moderate, and minor service changes.
SERVICE CHANGE PROCESS OVERVIEW
Requests for service changes and new services can be proposed by
anyone – private citizens, elected officials, CTA employees, employers,
etc. They can also be the result of ongoing monitoring and data
collection.
Service Standards 26The Bus and Rail Service Committees have an advisory role for service
changes. These are internal committees that meet monthly, or as needed,
to:
Identify issues, opportunities and concerns,
Ensure that proposed service changes can be operated reliably and
safely, and
Identify the actions that may be needed to implement changes.
All proposals must be reviewed and analyzed by Planning and
Development staff. In order to efficiently screen, analyze, and evaluate
the merits of service change proposals, the Service Change Committee
was established within Planning and Development.
The process for evaluating and implementing service change proposals
is dependent upon the magnitude of the change. Table 10 defines the
different types of service change. Table 11 provides the timeline for the
service change process.
Table 10.
Service Change Types
TYPE DEFINITION EXAMPLES
Minor Routine small Running time adjustments
changes to Departure time adjustments
better align Span of service changes of ½ hour or
services with less
demand Bus reroutes due to street or bridge
detours
Service interval changes to match
service levels with ridership
Train length changes to match service
levels with ridership
Changes to bus stop locations
Moderate Small changes Bus reroutes of less than 1 mile
to routes or Route extensions of 1 mile or less
service Service changes to reflect changes in
configurations street patterns
with limited
impact &
modest costs
Major Changes that Route changes that affect more than
will have 25% of a route’s passenger route
significant miles or vehicle miles
impacts on Changes requiring new facilities
customers and and/or capital expenditures at a cost
resources. level that requires Board approval
Service Standards 27Table 11.
SERVICE CHANGE PROCESS
Process Element Jul Aug Sept Oct Nov Dec Jan Feb Mar Apr May Jun Jul Aug Sept Oct Nov Dec
BUDGET PHASE (prior year)
Proposal Intake & Screening
Service Change Proposal Submit
Budget/Exec Review & Modification
President's Approval
Board Approval
MID-YEAR CHANGE PROGRAM
Proposal Screening
Proposal Evaluation
Executive Review
Board Approval
Implementation
YEAR-END CHANGE PROGRAM
Proposal Screening
Proposal Evaluation
Executive Review
Board Approval
Implementation
MINOR/MODERATE CHANGE PROGRAM
Implementation
Proposal intake and service monitoring/data collection are continuous throughout the year.
Service Standards 28Minor and moderate changes are evaluated within Planning and
Development through the Service Change Committee and can be
implemented throughout the year, in accordance with section
picks, except when Board approval is required. These are generally
changes that have little or no impact on the budget or vehicle
allocation.
Major service changes must undergo a Semi-annual Review and
may be implemented only twice a year. These changes do impact
the budget and vehicle requirements. Further, they require Board
approval before they can be implemented.
SCREENING
Once the Service Change Committee receives a proposal, it is
screened to see if it warrants further study or rejection. This
screening requires a brief analysis that includes the criteria listed in
Table 12.
Table 12.
SCREENING CRITERIA
• Urgency
• Ease of implementation
• Readiness for implementation
• Level of interest (internal & external)
• Feasibility
• Capital and/or land acquisition required
• Costs involved (preliminary estimate)
After the committee has determined if the proposal should proceed
to the next level of analysis or be declined, the sponsor of the
proposal is notified of the decision. This notification may come
after approval to do full analysis for those projects that move
forward.
EVALUATION PROCESS
Approval for full analysis is required from senior management For service
before proposals can proceed. Depending on the level of improvements, the
complexity, this higher level analysis generally takes up to two economic factor is
cost per new
months to complete, but may extend to as much as 12 months for passenger. For
some improvements. service reductions,
it is savings per
At this time, the committee also determines what type of service passenger lost.
change the proposal is. If it is a minor or moderate change, the full
Service Standards 29analysis and implementation can take place any time the resources
permit. If it is a major change, it must be deferred until time for the
Semi-annual Review (described below). Minor service changes, in
effect, tweak the system and require a less rigorous analysis than
moderate or major service changes.
Service analyses will be conducted using a consistent set of
evaluation criteria (listed in Table 13), based on whether the change
is a service improvement or service reduction. The economic factor
for service improvements is cost per new passenger. For service
reductions, it is savings relative to passengers lost.
Table 13.
Evaluation Criteria
Service Improvement Service Reduction
Primary Primary
Net cost per new passenger Net savings per passenger lost
Available budget The rationale for the change
The rationale for the change Existing and projected ridership
Existing and projected ridership Existing operating costs
The number of new passengers Existing fare revenue
Existing and projected operating Implications to service
costs coverage
Existing and projected fare
revenue
Implications to service coverage
Secondary Secondary
Market change, past, present Market change, past, present
and projected and projected
The change in travel time for The change in travel time for
existing passengers existing passengers
Key characteristics and Key characteristics and
demographics of the market demographics of the market
Contribution to the achievement Contribution to the achievement
of policy objectives of policy objectives
Other factors, as appropriate Impact on accessibility
Other factors, as appropriate
Primary evaluation criteria are used to determine the economic
viability and sustainability of service changes. The secondary
criteria are included to provide a complete picture of the impacts of
the change and to determine whether there are special
circumstances related to the change. Staff evaluates each project
using the worksheets in Appendix C: Service Proposal Evaluation
Worksheets.
Service Standards 30SEMI-ANNUAL REVIEW
Major service changes are evaluated twice a year and may only be
implemented two times each year, as the budget allows. For this
type of change, the Semi-annual Review is required to determine
how best to allocate CTA's limited resources for services.
The Semi-annual Review ranks major qualified service changes
accumulated during a six to twelve month period. This ranking
determines CTA's best investment, and is used as a starting point in
decision-making for the following year's budget preparation.
Once approval of the full analysis is granted, Service Change
Committee members divide the work according to their sections'
responsibilities within the organization. The committee evaluates
the proposal again at the conclusion of the analysis. Proposals are
ranked against other proposals and compared to the productivity
levels of existing services to determine which proposals should be
implemented.
The Board will be provided with the recommended service changes
and a ranked list of all other proposals evaluated with their relative
rankings. These will be compared to the system average
performance. Additionally, the Board will receive a description of
the change, its justification, and cost and ridership implications.
Experimental Services
Some service changes may be implemented as experimental
services. Experimental services have a six-month evaluation period.
During that time the CTA Board may cancel or adjust the service if
it becomes apparent that the service is not meeting expectations. If
the service is approved by the Board as a permanent route, it will
be folded into CTA’s regular budget. Status reports will be
provided regularly to the CTA Board during the experimental
period.
Service Standards 31Chapter 5: Service Monitoring & Reporting
Service monitoring and data collection are key elements of the service
evaluation process. All services and routes are routinely reviewed to assess
their performance and effectiveness.
MONITORING & DATA COLLECTION
The two broad categories of service monitoring activities are
ridership monitoring and route/branch performance monitoring.
Ridership monitoring ensures that service frequency is appropriate
to passenger demand. Data collection and analysis activities for
this type of monitoring include point checks, ride checks, and
analysis of AFC data to determine passengers boardings on bus
and passenger entries at rail stations. Ridership monitoring
permits quick response to demand changes.
Route/branch performance monitoring ensures the effectiveness of
existing services with respect to their variable operating costs and
usage. Data collection and analysis activities for performance
monitoring include running time checks, point checks, bus
productivity analysis, and analysis of AFC data.
REPORTING
Planning and Development reports bus ridership and passenger
entries at rail stations monthly. Bus routes are ranked using
passengers per vehicle hour to highlight productivity. Passenger
entries are used to rank performance of rail stations and branches.
This ranking gauges the performance of individual routes, stations,
and branches and the system as a whole and serves as an initial
screening process for investigating service improvements and their
costs.
These rankings will be reported to the Board quarterly. The report
will include recommended strategies for meeting performance
objectives and a summary of the results of service proposal
evaluations conducted during the previous quarter.
Service Standards 32Chapter 6: Public Participation Process
The focus of the public participation process is an on-going, regular
dialogue with communities, citizens and their elected officials regarding
service needs. It is also intended to familiarize stakeholders with the CTA
service planning process, and to engage them in the process of allocating
finite resources in an equitable fashion.
The public participation process is comprised of three integrated
steps:
Outreach to customers
Outreach to the public, communities and elected officials
Public meetings and hearings on major changes
OUTREACH TO CUSTOMERS
Direct feedback from customers is an important part of the public
participation process. Regular customer surveys measure levels of
satisfaction on a variety of attributes, such as service reliability and
cleanliness. Specific market and route-based surveys may also be
conducted for a route or service undergoing a major change.
Additionally, CTA will sometimes solicit “public comment”,
involving phone calls and letters, as input for the evaluation
process. Customer evaluations received by the CTA are valuable
input to the route evaluation process.
The 1995, 1997, and 1999 Customer Satisfaction Surveys are
examples of CTA’s commitment to learning more about our
customers’ needs and concerns. These surveys provided invaluable
information on perceptions of CTA, gave us some indication of
customer loyalty, and told us where improvements were needed.
The results of the Customer Satisfaction Surveys feed into decisions
made about service changes and other resource allocations.
OUTREACH TO THE PUBLIC, COMMUNITIES AND
ELECTED OFFICIALS
Outreach efforts are intended to provide individuals and groups
the opportunity to formally submit service requests to CTA for
consideration. CTA is developing a series of documents to describe
to the public the service planning process and elicit their proposals.
These documents, as well as route performance reports, will be
made available on the CTA website, www.transitchicago.com.
Service Standards 33PUBLIC MEETINGS AND HEARINGS
Staff attends public meetings on request. These meetings are
generally in conjunction with community groups, CAPS
(Community Area Policing Strategy) units, or elected officials.
Through these meetings, staff learns valuable information
regarding changes in the community, customer suggestions, and
customer needs. Feedback from these meetings is entered into the
minutes of the next Service Change Committee meeting.
Public hearings are an important part of the planning process for
major service changes. Improvements to service do not require
public hearings. However, route changes that reduce more than
25% of a route’s route miles, vehicle miles or ridership require a
formal public hearing prior to final Board action. The Board
considers the public comments prior to making a final
determination on the proposed service reduction. Public hearing
requirements are set by ordinance, which may be amended from
time to time.
As a public service, customer input and feedback are vital to
ensuring that CTA meets the needs of our customers.
Service Standards 34Appendix A: Bus and Rail Design Guidelines
The Authority has developed a set of design guidelines that are to be used for both ongoing
evaluation and modification of existing bus and rail service, and in preliminary evaluation
and design of proposed new services.
BUS SERVICE
In designing routes and making changes to existing routes, a balance is attempted between
ease of access and minimizing travel time. A goal is to control and minimize door-to-door
travel time for all potential customers as much as possible. Transit travel time components
for an individual trip consist of four components:
1) Walk access - time from leaving origin to boarding point. This is a function of distance
from route, presence of obstacles, and stop spacing.
2) Wait for service - time at boarding point, ready to board, until bus departs with customer
on board.
3) On-board - time traveling on bus, including delays. This is a function of distance,
directness of service (lack of deviation), attainable speeds, presence or lack of congestion,
number of intervening stops, and number of other passengers boarding/alighting.
4) Walk distribution - time from departing transit at alighting point to destination. This is a
function of distance from route, presence of obstacles, and stop spacing.
For transfers, steps one through three are repeated. Research has shown that customers are
most sensitive to waits for service and delays, followed by time walking to/from service and
least sensitive to time on bus or train while moving. Demand for a service can be
determined by using these factors plus fares along with coefficients. Most travel time
reductions involve tradeoffs. Transit demand gains and losses from changes in travel time
can be estimated using pivot-point forecasting methodologies.
Relationship Between Bus and Rail
When planning new bus routes or restructuring existing bus routes, emphasis should be
given to feeding rail stations as much as possible. In some cases, there may be apparent
geographic overlap of service because a bus route provides local service, while rail service
makes widely spaced stops. Additionally, density of demand may be high enough to
warrant express bus service in the same corridor as rail. These express bus routes increase
market penetration and help reduce overloading on the rail lines.
Duplication of Service
It is the Authority’s policy to operate only one local bus route on a major arterial street.
However, it may be necessary to duplicate service in certain cases; 1) where routes merge to
feed a rail station or a major traffic generator such as downtown, 2) when branches of routes
share a common headway on the mainline portion of the route, and 3) when a route provides
local service in the same corridor as rail service.
Service Standards 35You can also read