China Nationally Determined Contribution (NDC) and Domestic 14th Power Five-Year-Plan (FYP)
←
→
Page content transcription
If your browser does not render page correctly, please read the page content below

Energy Planning and Climate Policy Special Report

                        China Nationally Determined Contribution (NDC)
                         and Domestic 14th Power Five-Year-Plan (FYP)

                                 Draworld Environmental Research Center
                                Centre for Research on Energy and Clean Air

                                              2020 November
©Simon Lim/Greenpeace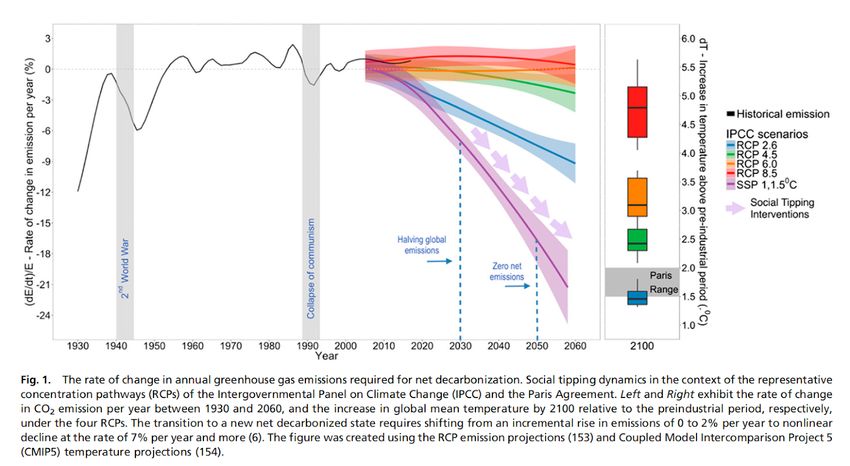
About us
Draworld Environment Research Center (Draworld)
Draworld Center was founded in 2012, and comprises a small team working on applied
research and policy consulting on China’s energy and environment issues, and sectoral
dynamics. In a more fragmented and less rule-based international regime, our recent work
focuses on how China would interact with big players, such as those in the United States and
the European Union in the energy and climate industries.

www.draworld.org

Centre for Research on Energy and Clean Air (CREA)
CREA is a new independent research organisation focused on understanding the trends,
causes, health impacts and solutions to air pollution. CREA uses scientific data, research and
evidence to support the efforts of governments, companies and campaigning organizations
worldwide in their efforts to move towards clean energy and clean air, believing that effective
research and communication are the key to successful policies, investment decisions and
advocacy efforts. CREA was founded in December 2019 in Helsinki and has staff in several
Asian and European countries.

www.energyandcleanair.org

China Nationally Determined Contribution (NDC) and Domestic 14th Power Five-Year-Plan (FYP)       1
Executive Summary
Background
Responses to the coronavirus pandemic took centre stage in most countries throughout 2020.
While we hope that this damaging health and economic crisis will be alleviated and soon
disappear from the headlines of the newspapers, the urgency of another defining global
challenge – climate change – has not diminished.

One prerequisite to achieve climate security is the rapid decarbonisation of the energy sector
to meet zero-emissions around the middle of this century and then decline to negative
territory. To achieve the Paris Agreement target to limit the average global temperature rise
this century to below 2 oC, emissions from the energy sector would need to peak as soon as
possible and show a clear decline by 2030.

Comparing these global emissions guideposts with the current nationally determined
contributions (NDCs) of countries, there are still obvious gaps. The upcoming years till 2023
provide a time window to increase the ambition with updated NDCs and to peer-review the
national submissions.

China’s pledge to aim for carbon neutrality by 2060 will inject much-needed momentum to
the new international climate negotiations. One way to measure the potential for China’s
long-term vision to reduce carbon dioxide (CO2) emissions is to analyse changes to the
country’s policy actions over the next five years, that is, the 14th five-year-plan (FYP) and/or
ten-year plan. The energy and emissions pathway set out in the 14th FYP will be an indicator of
China’s commitment to a carbon-neutral vision. To achieve net-zero emissions, China will need
to implement stringent measures as early as possible. The country’s efforts will be closely
monitored by international peers.

The purpose of the report
China will finalise its 14th economic, energy and electric power FYP (2021–2025) around the
end of 2021. Therefore, the next 1-2 years will be important for China to formulate its domestic
FYP and international NDC.

This report aims to contribute to the planning process, analysing the implementation of the
NDCs and the long-term vision.

This report tracks China’s progress and achievements towards its Climate Pledge 2020, made
at the Copenhagen Conference of the Parties climate change meeting, and its NDC 2030. This

   China Nationally Determined Contribution (NDC) and Domestic 14th Power Five-Year-Plan (FYP)
                                                                                             2
report also includes an empirical study on how the 14th FYP and NDC documents were
prepared by government agencies and the changes expected in the new round 2020–2021.

This report discusses China’s emissions constraints under the explicit effort-sharing approach.
The so-called ‘Compatible China Coal Power Pathway 2020–2030’ was developed to reflect the
emissions constraint for the coal power sector, which will need to be incorporated into the
domestic FYP if China is to meet its zero emissions target.

The report’s analysis focuses on renewable energy and coal power and quantifies their roles
and pace before 2030, based on identifying the optimal power mix that minimizes system
costs (using the screening curve approach) under constraints, with and without carbon
pricing.

The final section provides reflections and key recommendations in terms of government
operation so that the international NDC and domestic FYP can be fully aligned.

Main findings
The analysis shows that:

           ●   Based on progress up to the end of 2019, China can overshoot the targets set in
               the Copenhagen COP meeting, i.e. the 15% non-fossil fuel and 40-45% carbon
               intensity decline targets. Connecting with the 13th FYP on energy and power, the
               renewable energy capacity and generation targets will be met or exceeded (esp.
               solar PV), while the targets for nuclear and gas are falling short. The targeted
               decline of the share of coal in the energy mix will also be exceeded.

           ●   China's share of global emissions increased from less than 20% in 2010 to around
               26% in 2019. Coal-fired power plants are China’s single largest CO2-emitting
               sector. The targets and development of coal power capacity will be seen as a key
               litmus test for the peaking target. China currently has approximately 130GW of
               excess coal-fired capacity, out of a total capacity of 1100 GW. In the absence of a
               carbon price signal, we project that the lowest cost capacity mix for 2030 would
               include 1020GW of coal, a small reduction from 2020. Stakeholders' expectations
               for coal power in 2030 have been 1300 GW or higher, which imply a life-cycle loss
               because of stranded assets over 2000 billion RMB. This issue requires the public
               attention and deliberations of the whole society. Furthermore, taking into
               account the CO2 peaking target and the reasonable contribution of the power
               sector, a capacity level of 680GW would be optimal in 2030. This goal requires
               effective and additional carbon pricing, at the level of around 200 RMB per ton to
               achieve in a standard absolute-cap ETS system. In China’s forthcoming “tradable

   China Nationally Determined Contribution (NDC) and Domestic 14th Power Five-Year-Plan (FYP)
                                                                                             3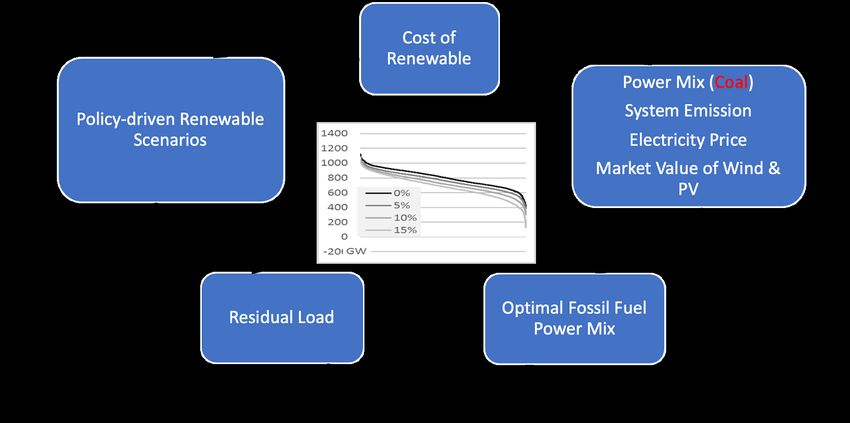
efficiency standard” system, the price should be higher to achieve the targeted
             emission.

         ●   To achieve China's non-fossil power target of 50% by 2030, the growth of wind
             power and solar PV needs to be doubled in comparison to the average over the
             past 10 years to achieve a share of more than 20% of all power generation by 2030.
             To compensate for the large probability of deceleration of hydro and nuclear
             power, 25% is a more robust figure.

         ●   Based on data analysis, the report makes policy recommendations for China’s
             updated NDC, which includes a moratorium or ban of new coal-fired power
             plants; the launch of a policy agenda to phase out coal-fired power plants, the
             introduction of a carbon market floor price and strict intensity benchmarks. These
             specific actions would help China to achieve peak emissions from the energy
             sector sooner than 2030 and contribute to the overall carbon neutrality target.

         ●   Improved coordination on the level of implementing policies is needed to ensure
             the success of collective actions. The climate policy think tank, national climate
             strategy centre and its ministerial supervisor, China’s Ministry of Ecology and
             Environment, should be more visible and exert influence in the preparation
             process of all kinds of FYP and sub-FYP in the energy domain. There is still room
             to improve in terms of the harmonisation in the work layer and on the
             operational issues.

Reflections
China has already set the long-term vision of carbon neutrality by 2060. This is a big step to
define specifically how low is low carbon in China’s widely-agreed energy strategy: building an
energy system characterised by cleanness, low carbon, security and high efficiency. There is no
leeway to construct new long-lived fossil fuel infrastructure such as coal power, which would
need premature retirement to meet China’s vision to achieve net-zero emissions.

   China Nationally Determined Contribution (NDC) and Domestic 14th Power Five-Year-Plan (FYP)
                                                                                             4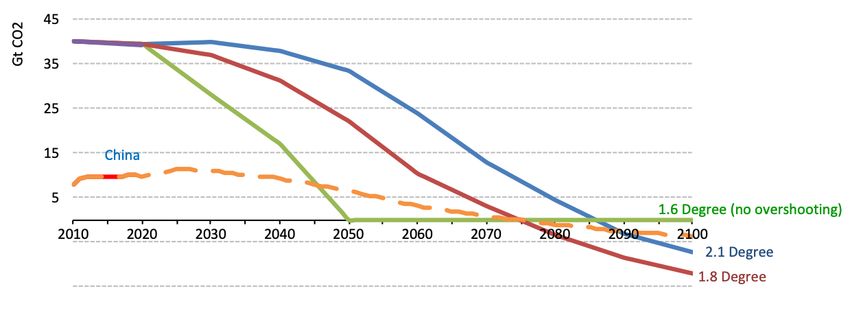
Contents
About us                                                                                    1

Executive Summary                                                                           2

Glossary                                                                                    6

Acknowledgements                                                                            7

Chapter 1
Paris Agreement & China’s NDC progress                                                      8
   1.1 Paris Agreement & China’s climate commitment                                         8
   1.2 China 2019/2020 progress                                                            10

Chapter 2
China’s Five Year Plan and International Commitments                                       12
   2.1 China’s Five Year Plan                                                               12
   2.2 Coordinating energy planning with climate targets                                    12

Chapter 3
China: Sharing responsibility on emission reduction and restricting coal power             13
   3.1 The Paris Agreement and its implications for global emission reduction targets       13
   3.2 China in the World: Sharing Emission Reduction Responsibilities                     14
   3.3 Considering climate for coal power: emission reduction based on efficiency           16

Chapter 4
Focusing development of coal power and renewable energy                                    19
   4.1 Roadmap of renewable energy towards 50% non-fossil electricity target by 2030        19
   4.2 Coal Power overcapacity: A long lasting problem                                     20
   4.3 Recommendations for China’s 2030 NDC updates                                        23

Chapter 5
Summary and Recommendations                                                                26
   5.1 Fulfill an ambitious 2030 NDC                                                        26
   5.2 Recommendations on the policy process                                               27

References                                                                                 29

Appendix                                                                                   32

   China Nationally Determined Contribution (NDC) and Domestic 14th Power Five-Year-Plan (FYP)
                                                                                             5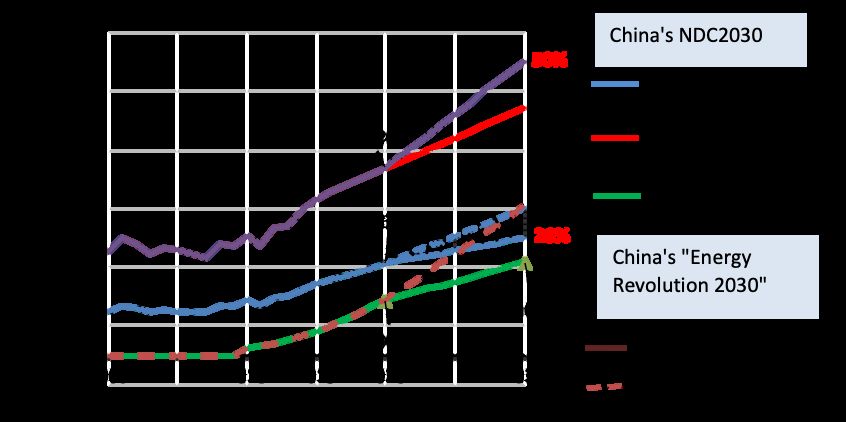
Glossary
Term                          Interpretation / Reference

UNFCCC                        United Nations Framework Convention on Climate Change
                              (www.unfccc.int)

Nationally Determined         Core emission reduction paradigm from Paris Agreement: A
Contribution, NDC             voluntary determined emission reduction target by all
                              countries and subject to collective review and updates.

FYP                           Five-year Plan

Energy Transition             Structural change of the energy system, mainly the
                              substitution of fossil fuel energy with renewable energy, and
                              related issues regarding technology, economy, policy and
                              politics

Two “up and down flow” of      A vertical coordination mechanism between central and
the plan system               provincial governments
harmonisation

Downscaling                   Derive individual/subgroup (e.g. sector or national) constraints
                              from overall (e.g. global) constraints

Optimal power mix             energy mix structure optimized to minimize system cost using
                              Screening Curve without considering incumbent power
                              generation units

Carbon pricing                Set price for carbon emission with theoretical implementations
                              of carbon tax or carbon emission trading market, which are
                              equivalent under certain circumstances

Non-fossil energy             Renewable energy + nuclear power in primary energy
                              consumption

Non-fossil electricity        electricity generated with renewable energy (hydro, wind and
                              solar PV) + nuclear power

Efforts-sharing approach      Shared responsibility of emission reduction or emission budget
                              by country under a global target (budget)

Screening curve               A method to determine optimal system capacity structure
                              based on cost structure of various power generation
                              technology

   China Nationally Determined Contribution (NDC) and Domestic 14th Power Five-Year-Plan (FYP)
                                                                                             6
Acknowledgements
This report was written by the Draworld Environmental Research Center team. The main
contributors are:
Shuwei Zhang, drafted the chapter on emission reduction responsibility and an overall
coordination,
Jia Liu, the 14th Five-Year Plan process and manuscript writing,
Guangzhi Yin, Screening Curve methodology and chapter of coal power,
Yunqing Bi, chapter on renewable energy and proofreading the English draft.
Jin Qiao and Ying Ji provided necessary support in data and information verification, chart
production, text editing, and expert opinion consultation.
The first draft of the project research report was revised based on the opinions solicited from
several experts in the power and renewable energy related industries. Special thanks to Dr.
Xiusheng Zhao from the Institute of Energy, Economics and Environment of Tsinghua
University for reviewing this report.
The project research was funded by the Center for Research on Energy and Clean Air (CREA),
with support and coordination of the lead analyst Mr. Lauri Myllyvirta, the director Mr.
Nandikesh Sivalingam, Ms. Shen Xinyi and Mr. Dong Liansai. We would like to express our
gratitude to the aforementioned collaborators. In the public communication and policy
briefing of the project, We would also like to thank Ms. Zhe Yao and Ms. Yixiu Wu of China
Dialogue for their technical support and outstanding work.
In the process of the project research, we would like to express our gratitude to the following
colleagues and friends because of their selfless sharing and assistance in terms of insights
and methodology.
Songxu Xin, China Renewable Energy Engineering Institute (CREEI).
Qimin Chai, National Center for Climate Change Strategy and International Cooperation
(NCSC).
Xuewan Chen, Energy Correspondent of Caixin, China.
Disclaimer: The author, Draworld Environmental Research Center (Beijing), is exclusively
responsible for the information accuracy and stated opinions in this report.
China Nationally Determined Contribution (NDC) and Domestic 14th Power Five-Year-Plan (FYP)
7Chapter 1
Paris Agreement & China’s NDC
progress
1.1 Paris Agreement & China’s climate commitment
Climate change is one of the most important and long-lasting global challenges. The IPCC’s
Fifth Assessment Report, published in 2014, concluded that cumulative global emissions must
be limited to about 1,000 Gt CO2eq (gigatonnes of carbon dioxide equivalent), an amount that
will be exceeded in just 20 years unless emissions start to decline substantially.
The Paris Agreement, adopted in 2015, recommended the maximum global average annual
temperature increase to be no more than 1.5°C above pre-industrial levels. In later reports, 1.5oC
was interpreted as a collective target for all countries around the globe to act with rapid and
deep energy transition.
The 1.5°C target is stringent enough to be interpreted with the obvious response actions: peak
emissions sooner followed by rapid drop, reach a zero-emission within 20-30 years, and even
reclaim carbon with negative emission technology.
China submitted its NDC in 2015 to the UNFCCC to pledge the following goals1:
● To achieve the peaking of carbon dioxide emissions around 2030 and making best
efforts to peak early;
● To lower carbon dioxide emissions per unit of GDP by 60% to 65% from the 2005 level;
● To increase the share of non-fossil fuels in primary energy consumption to around 20%;
● To increase the forest stock volume by around 4.5 billion cubic meters on the 2005 level;
and
● Continue to proactively adapt to climate change … and progressively strengthen early
warning and emergency response systems and disaster prevention and reduction
mechanisms.
1 http://www.scio.gov.cn/xwfbh/xwbfbh/wqfbh/33978/35364/xgzc35370/Document/1514539/1514539.htm
China Nationally Determined Contribution (NDC) and Domestic 14th Power Five-Year-Plan (FYP)
8This report analyses factors contributing to carbon dioxide emissions and assesses the
credibility of a roadmap towards peak emissions in 2030:
● Peak emissions will require a decrease in fossil fuel consumption. With continued
growth in demand for natural gas for heating and household fuel, and growth of
petroleum consumption in transportation, peak emissions will be largely dependent on
decreased coal consumption.
● Peak emissions will require that the rate of decrease of carbon intensity of energy
exceeds the growth of energy consumption.
● Peak emissions will require that the rate of decrease of carbon intensity of GDP
exceeds the growth rate of GDP, whereas the energy intensity of GDP is highly
correlated with the industrial structure.
E mission = E coal + E oil + E gas
E mission = Energy × Carbon I ntensity of Energy
E mission = GDP × Carbon I ntensity of GDP
Figure 1-1. Identity on carbon emission determination
The carbon intensity of energy or of GDP is affected by the share of non-fossil fuel energy
within the energy mix. In most scenarios, the non-fossil fuel target is the prerequisite of
other targets, and is also the one of the hardest to achieve.
China Nationally Determined Contribution (NDC) and Domestic 14th Power Five-Year-Plan (FYP)
91.2 China 2019/2020 progress
China has been making rapid progress towards its Copenhagen and Paris targets. In He
Jiankun’s assessment (2019), CO2 intensity of GDP has dropped 48% compared to the level in
2005, and is predicted to decline by more than 50% in 2020. The Ministry of Ecology and
Environment also released calculations that carbon intensity has dropped 45.8% and 48.1% in
2018 and 2019, respectively.
The estimation made in this report suggests that CO2 intensity of GDP in the energy sector
has dropped 47.2% and 49%, respectively.
The use of renewable energy has expanded. Wind power capacity grew by an average of
20GW per year during the 13th FYP period (2015-2020), while solar power reached an
installation of over 200GW. Non-fossil fuel energy (renewable + nuclear power) has taken 15.7%
of primary energy consumption, while solar and power together generated more than 8.5% of
total electricity.
Table 1-1. Economic, social and energy parameters
2005 2010 2015 2019
GDP (2005 constant price, 100 million Yuan) 185896 317682 463889 596778
Electricity demand (TWh) 2494 4194 5802 7325
Total energy consumption (10,000 tce) 261369 360648 429905 486000
GDP energy Intensity (tce/10,000 Yuan) 1.41 1.14 0.93 0.81
GDP CO2 Emission intensity (tCO2/10,000
Yuan) 3.2 2.5 2.0 1.6
Proportion of non fossil fuel in primary
energy mix 7.4% 9.4% 12.1% 15.7%
Proportion of non fossil fuel electricity 18.0% 20.5% 26.7% 30.5%
Proportion of wind and solar in power mix 0.0% 1.1% 3.9% 8.6%
Source: China Statistical Yearbook (2019), China Statistical Report(2019),
China Energy Statistical Yearbook, China Electric Power Yearbook, etc.
China Nationally Determined Contribution (NDC) and Domestic 14th Power Five-Year-Plan (FYP)
10The progress made by 2019 is sufficient for China to claim an achievement for its commitment
from 2009’s Copahagen climate summit ahead of time: reduction of carbon intensity of GDP
and share of non-fossil fuel in the energy mix.
Although China is making progress well in reducing its carbon intensity, CO2 emissions are
increasing and are responsible for at least one-quarter of the world’s total emissions.
China has set a domestic goal of reaching 50% non-fossil electricity in its power mix by 2030,
which sets one more stringent constraint than the current NDC for energy transition roadmap.
The implications of this target for the period of 2020-2030 are analyzed in Chapter 4.
China Nationally Determined Contribution (NDC) and Domestic 14th Power Five-Year-Plan (FYP)
11Chapter 2
China’s Five Year Plan and
International Commitments
2.1 China’s Five Year Plan
The Five-Year Plan (FYP) is being used by China as a periodic planning tool to set goals and
visions for economic and social development. The drafting of the 14th FYP was started in 2019.
The Central Committee has suggested overarching goals and guidelines in October, 2020 for
economic and social development during 2020-2035, despite vague qualitative statements.
Moreover, a climate-specific FYP and a corresponding action plan will be announced in the
second half of 2021.
Once released, the FYP will become the main reference for any subsequent energy and
climate policy targets.
2.2 Coordinating energy planning with climate targets
Electricity development planning is coordinated by China’s National Energy Administration
(NEA), whereas climate policy planning is led by the Ministry of Ecology and Environment
(MEE).
Government agencies usually delegate the planning task to a research institute or think tank,
which would enable the participation of various stakeholders.
Historically, this has brought several challenges into the planning process:
● Planning a specialized sector with fewer stakeholders is often developed by one
institute with limited iterations.
● The author who drafted the plan may not clearly illustrate the criteria, objectives or
substantiation for key targets or measures.
● As China’s climate policy-making is reorganized under MEE, it is still unclear how MEE
will be involved in the energy or electricity development planning led by the National
Energy Administration.
China Nationally Determined Contribution (NDC) and Domestic 14th Power Five-Year-Plan (FYP)
12Chapter 3
China: Sharing responsibility on
emission reduction and restricting
coal power
3.1 The Paris Agreement and its implications for global
emission reduction targets
Achieving the commitment from the Paris Agreement is a difficult task. Roelfsema et al.
(2020) showed that the optimal path to achieve the 2°C goal of the Paris Agreement implies a
30%-60% reduction compared to the 2010 level by 2030. If the NDCs are fully implemented,
there is still a gap of emission reduction of 7-10 Gt CO2eq between the NDC goal and the
optimal emission reduction path.
Fig 3-1. The unprecedented challenge of ensuring climate security
Source:Otto et al. (2020)
China Nationally Determined Contribution (NDC) and Domestic 14th Power Five-Year-Plan (FYP)
133.2 China in the World: Sharing Emission Reduction
Responsibilities
Setting China's emission budget involves subjective judgments and various value standards
which should include the allocation of rights of emission or obligations of reduction (Lyer et al.,
2017), which could be explicit or implicit. We need to emphasize that the region where
emission reductions occur may not necessarily be the region that bears the cost of emission
reductions.
In this report, we assess the feasibility of China’s emission reduction roadmap and associated
risks. The simulation of Molina et al. (2020) shows that if China takes proactive actions, it may
push other stakeholders for more actions and leans toward matching the commitment
agreements. To derive the constraints of China's power industry from the perspective of risk
management, we implement a top-down strategy: we downscaled the coal power pathways
from the total amount to a year-by-year breakdown, from the world to China, from the entire
economy to a single power sector. Through this process, we derived and named it as
Compatible China Coal Power Pathways 2020-2030 to set a constraint for the development of
coal power.
Fig 3-2 Downscaling from the global target to power sector constraints
Among the five stages of the downscaling process, the 1st and 2nd stages are covered by
plenty of global scope studies based on the large-scale integrated assessment model (IAM),
most of which set the objective as "economic efficient" and/or "best time path" with varied
settings such as whether to allow over-shooting, whether to have CCS and to what extent. We
China Nationally Determined Contribution (NDC) and Domestic 14th Power Five-Year-Plan (FYP)
14have selected a representative emission trajectory from Rogelj et al. (2020), which is based on
the IPCC AR5 database2.
Fig 3-3 World and China’s emission budget, 2018-2100
Source: Global budget from Rogelj et al. (2019), China constraints from this report
The derivation from step 2 to step 3 is politically sensitive and difficult, even in previous
discussions at the COP meetings. It often involves the interpretation of equity, fairness, and
common-but-differentiated principles.
Regarding China’s international commitments and peer pressure, there are three questions to
be answered:
● Will China achieve peak emissions by 2030?
● After increasing its share of global emissions from less than 20% in 2010, to more than
25% at the moment, is China's share going to increase further?
● Will China be able to drop its emissions level after 2030 sharply to keep in line with the
2°C target trajectory, and credibly achieve the 2060 carbon neutrality promise?
Our preliminary analysis shows that by 2019, China's annual CO2 emissions from fossil fuel
accounts for about 26% of the world's total. We base the analysis on the judgment that China
should not exceed 30% of the world’s total emissions at any point in time. This is a subjective
2 https://iiasa.ac.at/web/home/research/researchPrograms/Energy/IPCC_AR5_Database.html。
China Nationally Determined Contribution (NDC) and Domestic 14th Power Five-Year-Plan (FYP)
15setting that could potentially shed light on the three questions above. In this setting, China will
have a CO2 budget of 493Gt and 125Gt for 2020-2100 and 2020-2030.
If China follows a path to achieve carbon neutrality by 2060, then there is no doubt that China
will lead the world in climate governance.
Fig 3-4 Representative best available emission reduction pathways: World vs China
Source:
https://www.carbonbrief.org/analysis-global-fossil-fuel-emissions-up-zero-point-six-per-cent-in-2019-due
-to-china for the historic data on CO2 emission from fossil fuel.
3.3 Considering climate for coal power: emission
reduction based on efficiency
This section aims to discuss the climate obligations of China's power industry in the next
decade (2020-2030) based on the budget set above.
Chart 3-1 Carbon emission constraints setting
2000 2010 2019 2020 2025 2030 2050 2070 2100
2.1 degree Global - 40.0 - 39.4 39.6 39.8 33.3 12.8 -7.4
scenario emission (Billion
tone)
China Nationally Determined Contribution (NDC) and Domestic 14th Power Five-Year-Plan (FYP)
16China fossil fuel CO2 3.4 8.2 10.3 9.8 11.4 11.0 6.6 0.9 -3.6
emission (Billion tone)
Power sector - coal 1.2 3.2 4.0 3.7 3.1 2.5 0.0 0.0 0.0
power industry (Billion
tone)
Ratio of coal power 36% 39% 39% 38% 27% 22% 0% - -
emission to fossil fuel
emission
Source: China’s historical emission data
https://www.carbonbrief.org/analysis-global-fossil-fuel-emissions-up-zero-point-six-per-cent-in-2019-due
-to-china;https://www.carbonbrief.org/in-depth-bp-data-reveals-clean-electricity-matched-coal-for-the-
first-time-in-2019
Typical trajectory under 2.1 degree climate target emission budget,Rogelj et al. (2019b).
Historical emissions from coal power in the power sector: author’s calculation and Zhang & Qin (2016)
The power sector often accounts for more than 40% of all-sector emissions, and has a variety of
low/zero carbon technology options (Ang and Su, 2016) such as wind and solar power which
are increasingly cost-competitive. Compared with transportation and building, the power
sector tends to have lower emissions reduction costs. Given that China has set the goal of
carbon neutrality by 2060, the power sector needs to achieve zero emissions as soon as
possible. In particular, coal power should be phased out more rapidly in a cost-effective
manner, to lay a realistic foundation to eliminate all coal power and achieve zero emissions by
the middle of this century.
The term “rapid” isn’t well defined, so we use a “linear decline” path from the peak in 2020 to
zero emissions by 2050. By 2030, annual emissions from coal power need to be restricted to
around 2.5Gt CO2 to anticipate zero emissions by 2050 and a further goal of carbon neutrality.
China Nationally Determined Contribution (NDC) and Domestic 14th Power Five-Year-Plan (FYP)
17Fig 3-5 Emission reduction pathways for coal power (2020-2050)
Source: Historical emission from the coal power sector: updated based on Zhang and Qin (2016).
China Nationally Determined Contribution (NDC) and Domestic 14th Power Five-Year-Plan (FYP)
18Chapter 4
Focusing development of coal power
and renewable energy
4.1 Roadmap of renewable energy towards 50%
non-fossil electricity target by 2030
After submitting the 2015 climate NDC, China announced its Energy Production and
Consumption Revolution Strategy (2016-2030) in 2016, which set a goal that "by 2030, the ratio
of non-fossil power generation to total should reach 50%." With a current share of 32%, the
non-fossil sector needs to expand more rapidly than traditional energy sources. Zhang et al.
(2018) suggested that the 50% non-fossil target is more stringent than the various targets of
the climate NDC.
Nuclear power and large hydropower are inevitably slowing down in China. The security costs
of nuclear power are increasing, the fixed investment is huge, and the site selection is difficult.
The actual progress is much lower than the expectations set before the Fukushima accident in
Japan. The cost of investing in hydropower is rising so rapidly that building a cheap
hydropower plant is no longer valid. Also, hydropower units are often located in remote areas
where transmission costs greatly reduce their economic value.
Under such conditions, the growth of wind and solar power needs to at least double by 2030,
and the annual installed capacity of new wind and solar power should reach 100GW, sharing
20%-25% of all power generation. Then it might be robust to achieve the goal of 50% non-fossil
electricity in 2030 in an uncertain future.
China Nationally Determined Contribution (NDC) and Domestic 14th Power Five-Year-Plan (FYP)
19Fig 4-1 China’s Climate NDC target and domestic 50% non-fossil power target
Source: revised based on Zhang, et al. (2018) , updated with 2018-2019 data using data from National
Bureau of Statistics and China Electricity Council.
4.2 Coal Power overcapacity: A long lasting problem
Modeled as "ballast stone" and "stabilizer", coal power still occupies a significant share in
China's power mix3. Although this metaphor is not necessarily legitimate4, it reflects the status
quo of China's energy structure, management system and thinking pattern.
The local government and plant owners have exhausted their excuses for obtaining project
and/or construction approval, even with the severe overcapacity and regulatory restriction
policies. Coal power capacity exceeded 1,000GW by 2019, more than 50% of the total installed
capacity. Despite an average increase of 35GW per year during 2016-2019, equal to the entire
coal-fired capacity of South Korea or Poland every year, there are still a plethora of projects
under planning or construction.
Due to the overcapacity, the average utilized hours per year of coal power units was only 4,200
hours during the 13th FYP period, down from 5,000 hours in the 12th FYP period. At present,
the weighted average age of coal power units is about 15 years old, whereas the technical life
expectancy is 30-60 years. This implies that most coal power units are still at the start or
3 https://www.china5e.com/news/news-1062879-1.html
4 Users don’t use electricity for free, rather, they pay with a price. Coal power already profits from such
trading. Given the surge in building new power generation units, such profit is able to offset the total cost
without an external motivation.
China Nationally Determined Contribution (NDC) and Domestic 14th Power Five-Year-Plan (FYP)
20middle part of their conventionally assumed service lives, meaning that they will still generate
an enormous amount of emissions over their remaining years of operation, unless they are
retired early.
The real-time balance and storage difficulties of the power system renders different roles for
each type of power generation unit. Power sources with large fixed costs and low operation
costs (e.g. renewable and nuclear power) bear the base load, while some small fixed cost
power sources with high operation costs (e.g. open cycle natural gas or flywheel energy
storage) bear the peak load. This variety of roles in the power system requires a diversified
optimal structure. The level of coal power surplus in such a system is the actual surplus, which
is much more severe than the surplus estimated from the supply and demand figures.
The desired capacity of coal power can be calculated by combining the Residual Load
Duration Curve (the total load minus the renewable energy that needs to be dispatched firstly)
and the Screening Curve, with the carbon constraint. By applying this methodology (See
Appendix 1), we calculated a typical 8760-hour load curve as well as the power supply
structure, technical and economic parameters for 2019/2020. Without carbon pricing, the
current coal power overcapacity is about 130GW, about 12% of the total coal power installed
capacity.
Even considering the increase of the demand, coal power is expected to take a lower share
due to the expansion of renewable energy in the optimal energy mix, without explicit carbon
pricing. By 2030, coal-fired power will only need to remain at the level of 1,020 GW, which is 280
GW smaller than current expectations from the main stakeholders5 in the system. A coal
power surplus of this magnitude will inevitably depress the entire industry’s return on assets
and lead to a stranded asset of more than 2 trillion RMB (around 300 billion USD).
5 See a summary from main stakeholders
https://www.carbonbrief.org/analysis-will-china-build-hundreds-of-new-coal-plants-in-the-2020s
China Nationally Determined Contribution (NDC) and Domestic 14th Power Five-Year-Plan (FYP)
21Fig 4-2 Share of coal power in the optimal power mix, without carbon price, 2020-2030
The next question is whether it is compatible with the goal to peak the emissions at 2.5Gt CO2
for the power sector by 2030, which is set out in Chapter 3. The 1020GW coal power plants
generated 4930TWh, and the annual equivalent hours are 4200 hours. If by 2030, the overall
average coal consumption for power generation is 300 gce/kWh, which is equivalent to a
thermal efficiency of 41%, then its coal power emissions will be 3.6Gt CO2 – which is almost no
reduction compared to the level in 2019-2020.
The Screening Curve was used to simulate how to achieve 2.5Gt of coal-fired power emissions
in the presence of a carbon tax. The results show that with a carbon price of 200 yuan per ton
(approx. 28 US dollars), the optimal share of coal power further drops to 680GW with emissions
approximately equal to 2.5Gt CO2, which complies with the emissions constraints set for the
power sector in Chapter 3. Therefore, the suggestion based on the analysis in this report is that
a carbon price of 200 yuan per ton is formed in the upcoming carbon trading market. Finally,
China’s current ETS design is a “tradable efficiency standard” system (Goulder et al., 2019),
which would effectively alleviate the burden of coal power despite a visible high carbon price.
Under such ETS design, the carbon price needs to be even higher than the results above to
achieve the same reduction in emissions.
China Nationally Determined Contribution (NDC) and Domestic 14th Power Five-Year-Plan (FYP)
22Fig 4-3 Restrict coal power emission through carbon price
4.3 Recommendations for China’s 2030 NDC updates
Based on the analysis above, we propose the following recommendations for the update of
China's 2030 NDC:
● Halt any new coal power project
Coal power is currently in serious overcapacity because the share of wind and solar continues
to increase, and overcapacity may become more severe due to upcoming carbon pricing.
Preventing the approval of new coal power plant projects will be the "safety valve" and the
minimum action required from the public, corporate and society to avoid the worst case of
asset premature retirement.
For China to meet its goal to be carbon neutral, any new coal-fired power plant built from
2020 would need to be shut down prematurely. It is unlikely that the coal industry will want to
retire its power plants earlier than planned and the expectation is that the industry will
obstruct any emissions reduction policy.
Constructing new coal-fired power plants does not support China’s long-term goal of carbon
neutrality.
● Accelerate the development of wind and solar power to achieve the established
domestic goals
China’s wind power industry has averaged about 20GW of added capacity per year in the past
five years. The solar power equipment manufacturing capacity is much higher than demand
and the resulting situation is that equipment manufacturers are becoming developers.
China Nationally Determined Contribution (NDC) and Domestic 14th Power Five-Year-Plan (FYP)
23Accelerating penetration of wind/solar to 100-150 GW per year is generally possible, which
would lead to an over 20% share in the power mix by 2025. Such an acceleration is one of the
few feasible solutions available in the near future to achieve the 2030 goal, compared to
carbon capture, utilisation and storage (CCUS) technologies and other measures that, while
probably necessary to achieve net zero in the following decades, have not been proven at
scale.
The State Grid has been delaying renewable energy with excuses such as volatility and
instability. This should also be overhauled by setting a target of emission reduction over system
operational balance.
The government just issued a stimulus plan focusing on “new infrastructure”6 and the
renewable energy industry is undoubtedly a major channel to kickstart the post-epidemic
economy.
● Initiate discussions on policies and plans related to employment, placement,
settling state-owned assets to promote a fair transition during the phase- out of
coal power
Business losses are not a legitimate reason for a bailout. In the post-epidemic era, it is
necessary to grasp the basic principles of helping people rather than enterprises.
Phasing out coal power is inevitable, but it must also be ensured that this process is
manageable and fair in the sense of individual rather than enterprise. Coal power needs to
compete internally in a market-based regime. For unemployment, social policy is needed
instead of additional energy policies which often distort the market.
● Setting a carbon price floor to reflect the social cost of emissions
According to the understanding of the current carbon market rules, most of the “shadow”
burden brought about by carbon price is consumed through free allowances proportional to
output, so that electricity prices no longer rise significantly, and the carbon burden of
enterprises is far less than it appears from the carbon price.
Regarding fluctuation of carbon price, it is also recommended to directly set the upper and
lower limits of market prices to maintain market stability to avoid sharp price fluctuations
rather than other indirect policy designs. This strategy does not seriously distort the
performance of other aspects of the market, and benefits investors by giving traders clear
signals and saving compliance costs due to uncertain carbon price expectations (Aldy and
Armitage, 2020).
6 http://www.cac.gov.cn/2020-04/17/c_1588668422359835.htm.
China Nationally Determined Contribution (NDC) and Domestic 14th Power Five-Year-Plan (FYP)
24● Set interim targets for the emissions reduction between 2030-2060 and develop a
policy tools roadmap.
Peak emissions can be achieved by 2030 if a significant decline in coal consumption is
guaranteed. More research is needed to form a plan to achieve a rapid decline in emissions
after the peak.
A strong signal of transition needs to be sent to sectors of energy, transportation, industry,
construction, and agriculture. Good collective goals will need appropriate policy instruments to
optimize their implementation.
Moreover, to prevent it from being unrealistically hard to reduce emissions in the later period
(such as after 2045), it is recommended to set a mid-term target for 2030-2040, such as the
2035 target corresponding to “building a moderately prosperous society in all respects,”
reflecting the need for some certain sectors, such as coal power and some energy-intensive
sub-sectors or regions, to be the prioritized for emission reduction. Or, there could be an
intermediate target, such as an average annual reduction of 3%-4% in total carbon emissions.
China Nationally Determined Contribution (NDC) and Domestic 14th Power Five-Year-Plan (FYP)
25Chapter 5
Summary and Recommendations
5.1 Fulfill an ambitious 2030 NDC
The growth of renewable energy needs to be further accelerated. Long-term credible
policy is essential for short-term investment. China's wind and solar manufacturing has
formed a complete supply chain and is competitive enough in the global market to become
the world's center of low-cost renewable energy technology, while providing employment
opportunities for a growing population. Doubling the rate of renewable energy installations is
a necessary step to achieve the desired non-fossil energy targets, and could help the
manufacturing and power generation industries plan their investments and strategies.
Coal power requires a non-linear acceleration in its phase out to achieve a linear decline
in emissions. Any new coal power plant built at present will either end up a financial loss due
to premature retirement, or part of the lobbying power to obstruct the introduction of a strong
emissions reduction policy and risk not achieving China’s commitment to NDCs and carbon
neutrality.
Without a carbon tax, the optimal share of coal power in 2030 is 1020GW. This capacity needs
to be reduced to 680GW to meet emission constraints, or to share a loss of more than 2 trillion
yuan after 2030 due to declining return on assets.
The transition must be fair and manageable. The policy makers need to pay attention to the
social impact of quitting coal power. In particular, the upstream coal industry is often
distributed in areas where the economy is underdeveloped and employment opportunities
are scarce.
Social policies need to keep up with the energy transition to ensure social stability, and energy
policies should not be used for this purpose.
Good instruments are required to achieve good targets. Carbon pricing is widely
regarded by economists as the most efficient carbon reduction tool. China is also about to
launch the national carbon trading market. It is necessary to formulate a carbon price floor
policy and gradually increase it to more than 200 yuan/ton by 2030 under the current
intensity-based market design. Incentives to reduce coal-fired power generation will help to
phase-out coal.
China Nationally Determined Contribution (NDC) and Domestic 14th Power Five-Year-Plan (FYP)
26The way to measure the value of a long-term vision is to see how it changes policies and
actions in the short-term, such as the next five years (the 14th FYP) or next decade (before
2030). The recent energy and emission trajectories will serve as indicators for testing the
credibility of the long-term 2060 carbon neutrality targets. It is necessary to implement strict
emission reduction policies and measures from now on to lay a solid foundation for long-term
goals. If emission reduction is postponed from 2020 to 2030, it means that in the later period
(2045-2060) the annual emission reduction rate would exceed 25% (Fig 5-1), which
undoubtedly reduces the possibility of achieving the 2060 target.
Fig 5-1 Various emissions reduction trajectories (2020-2060)
5.2 Recommendations on the policy process
Incorporate the new NDC targets into the 14th Five-Year Plan for Energy and Power. At
present, planning the energy-specific FYP is carried out by energy administration agencies
and think tanks. A clear mechanism will need to be implemented by the National Climate
Strategy Center and the Ministry of Ecology and Environment to create an energy plan
compatible with climate constraints.
Clarify a more ambitious action plan before 2030, as well as mid-term goals and
roadmaps for 2030-2060. China’s long-term goal of carbon neutrality by 2060 has ambitious
implications for investment and industrial transition. Clarifying the action plan before 2030 to
help achieve the coal power reduction target as soon as possible is a precondition for
China Nationally Determined Contribution (NDC) and Domestic 14th Power Five-Year-Plan (FYP)
27achieving the emissions peaking target. Formulating a long-term zero-carbon economy
roadmap for 2030-2060 and setting interim goals or milestones can increase the credibility of
long-term goals and reduce the difficulty of future implementation.
China Nationally Determined Contribution (NDC) and Domestic 14th Power Five-Year-Plan (FYP)
28References
1. IPCC (2014), W. A. Climate Change 2014, Mitigation of Climate Change. Contribution of
IPCC AR5 WG3 2014: Working Group III to the Fifth Assessment Report of the
Intergovernmental Panel on Climate Change. Cambridge University Press, Cambridge,
United Kingdom and New York, NY, USA.
2. IPCC (2019). Global Warming of 1.5 C: An IPCC Special Report on the Impacts of Global
Warming of 1.5 C Above Pre-Industrial Levels and Related Global Greenhouse Gas
Emission Pathways, in the Context of Strengthening the Global Response to the Threat
of Climate Change. https://www.ipcc.ch/sr15/.
3. Otto, I. M., Donges, J. F., Cremades, R., Bhowmik, A., Hewitt, R. J., Lucht, W., Rockström, J.,
Allerberger, F., McCaffrey, M., Doe, S. S. P., Lenferna, A., Morán, N., van Vuuren, D. P., &
Schellnhuber, H. J. (2020). Social tipping dynamics for stabilizing Earth’s climate by
2050. Proceedings of the National Academy of Sciences, 201900577117.
4. Ang, B. and B. Su .2016. Carbon Emission Intensity in Electricity Production: A Global
Analysis. Energy Policy 94:56–63.
5. Wang Xin, Shuwei Zhang (2015). Exploring linkages among China's 2030 climate
targets, Climate Policy, 2015, 17(1): 1469-3062
6. Zhang Shuwei, Nico Bauer (2013). Utilization of non-fossil fuel target and its implication
in China. Climate Policy, 2013, 13(3): 328-344
7. Zhang Shuwei, Xuying Qin (2016). Promoting large and closing small” in China’s coal
power sector 2006-2013: CO2 mitigation assessment based on vintage structure.
Economics of Energy & Environmental Policy, 5(2): 1-16
8. He Jiankun (2019). The energy transition pattern and medium to long term low carbon
emission strategy in China. Presentation in the Sino-Japan workshop, Sept. 2019, in
Chinese. Retrieved at
https://www.canon-igs.org/event/report/20190905_presentation_1.Jiankun%20He.pdf
9. Zhang Shuwei, Yongqiang Zhao, Markus Steigenberger (2018). Agora Energiewende
Impulse Report: A Star for China’s Energy Transition: Five Golden Rules for an Efficient
Transformation of China’s Energy System, Nov. 2018
China Nationally Determined Contribution (NDC) and Domestic 14th Power Five-Year-Plan (FYP)
2910. Kaufman, N., Barron, A. R., Krawczyk, W., Marsters, P., & McJeon, H. (2020). A near-term
to net zero alternative to the social cost of carbon for setting carbon prices. Nature
Climate Change. https://doi.org/10.1038/s41558-020-0880-3
11. Rogelj, J., Shindell, D., Jiang, K., Fifita, S., Forster, P., Ginzburg, V., Handa, C., Kobayashi, S.,
Kriegler, E., Mundaca, L., Séférian, R., Vilariño, M. V., Calvin, K., Emmerling, J., Fuss, S.,
Gillett, N., He, C., Hertwich, E., Höglund-Isaksson, L., … Schaeffer, R. (2019a). Mitigation
Pathways Compatible with 1.5°C in the Context of Sustainable Development. In IPCC
Special Report on Global Warming of 1.5°C, available at https://www.ipcc.ch/report/sr15/.
12. Hausfather, Z., & Peters, G. P. (2020). Emissions – the ‘business as usual’ story is
misleading. Nature, 577(7792), 618–620. Comments.
https://doi.org/10.1038/d41586-020-00177-3
13. Lauri Myllyvirta, Shuwei Zhang and Xinyi Shen (2020). Analysis: Will China build
hundreds of new coal plants in the 2020s? Available at
https://www.carbonbrief.org/analysis-will-china-build-hundreds-of-new-coal-plants-in-t
he-2020s.
14. Rogelj, J., Huppmann, D., Krey, V., Riahi, K., Clarke, L., Gidden, M., Nicholls, Z., &
Meinshausen, M. (2019b). A new scenario logic for the Paris Agreement long-term
temperature goal. Nature, 573(7774), 357–363. done.
https://doi.org/10.1038/s41586-019-1541-4
15. Edenhofer, Ottmar, and Martin Kowarsch. (2015). Cartography of Pathways: A New
Model for Environmental Policy Assessments. Environmental Science & Policy 51
(August): 56–64. doi:10.1016/j.envsci.2015.03.017.
16. Höhne N., M. G. J. den Elzen, and D. Escalante (2014). Regional GHG reduction targets
based on effort sharing: a comparison of studies. Climate Policy 14, 122–147. doi:
10.1080/14693062.2014.849452.
17. Roelfsema, M., van Soest, H. L., Harmsen, M., van Vuuren, D. P., Bertram, C., den Elzen, M.,
Höhne, N., Iacobuta, G., Krey, V., Kriegler, E., Luderer, G., Riahi, K., Ueckerdt, F., Després, J.,
Drouet, L., Emmerling, J., Frank, S., Fricko, O., Gidden, M., … Vishwanathan, S. S. (2020).
Taking stock of national climate policies to evaluate implementation of the Paris
Agreement. Nature Communications, 11(1), 2096.
https://doi.org/10.1038/s41467-020-15414-6
18. Ueckerdt, F., Brecha, R., Luderer, G., Sullivan, P.,et al. (2015). Representing Power Sector
Variability and the Integration of Variable Renewables in Long-Term Energy-Economy
Models Using Residual Load Duration Curves. Energy. doi:10.1016/j.energy.2015.07.006
China Nationally Determined Contribution (NDC) and Domestic 14th Power Five-Year-Plan (FYP)
3019. Molina, C., Akçay, E., Dieckmann, U., Levin, S. A., & Rovenskaya, E. A. (2020). Combating
climate change with matching-commitment agreements. Scientific Reports, 10(1),
10251. https://doi.org/10.1038/s41598-020-63446-1
20. Iyer, G., Ledna, C., Clarke, L., Edmonds, J., McJeon, H., Kyle, P., & Williams, J. H. (2017).
Measuring progress from nationally determined contributions to mid-century
strategies. Nature Climate Change, 7(12), 871–874.
https://doi.org/10.1038/s41558-017-0005-9
21. Aldy, J. E., & Armitage, S. (2020). Cost-Effectiveness Implications of Carbon Price
Certainty. AEA Papers and Proceedings, 110, 113–118.
https://doi.org/10.1257/pandp.20201083
22. Goulder, L. H., Long, X., Lu, J., & Morgenstern, R. D. (2019). China’s Unconventional
Nationwide CO2 Emissions Trading System: The Wide-Ranging Impacts of an Implicit
Output Subsidy. National Bureau of Economic Research Working Paper Series, No.
26537. https://doi.org/10.3386/w26537
23. ABOUMAHBOUB, T., LUDERER, G., KRIEGLER, E., LEIMBACH, M., BAUER, N., PEHL, M., &
BAUMSTARK, L. (2014). ON THE REGIONAL DISTRIBUTION OF CLIMATE MITIGATION
COSTS: THE IMPACT OF DELAYED COOPERATIVE ACTION. Climate Change Economics,
05(01), 1440002. https://doi.org/10.1142/S2010007814400028
China Nationally Determined Contribution (NDC) and Domestic 14th Power Five-Year-Plan (FYP)
31Appendix
A1. Methodology
We set or endogenously simulate the most likely prospects for the economy, energy, and
environment from 2020 to 2030, based on government planning, and expectations of
power demand growth and renewable energy development from major stakeholders.
First, we simulated the speed of expansion of solar and wind power to achieve the 50%
non-fossil electricity target in 2030 and its growth in installed capacity driven by policy.
Then, we generated the residual load curve (RLDC) based on the expected power demand
growth.
With the technical and economic parameters of various fossil fuel technologies, the Screening
Curve is used to generate the optimal fossil fuel power source structure and the overall
optimal power mix. Based on this optimal structure, we measured the emissions of the entire
system, the electricity prices, the market value of renewable energy and other indicators.
Comparing the value of renewable energy and our expectations of the decline in the cost of
renewable energy, we can get the indication of whether renewable energy will continue to
require subsidies to enter the market.
We acquired the policy implications by comparing the emission level with the emission
budget of the power sector deduced in Chapter 3.
We furthermore bring about carbon pricing recommendations and re-simulates the optimal
system structure with the carbon tax, so that the development of the coal power industry is
compatible with the emission constraints.
China Nationally Determined Contribution (NDC) and Domestic 14th Power Five-Year-Plan (FYP)
32Fig A1-1 Analysis framework regarding updated climate NDC and 14th FYP
A2. Key parameters (2030)
2019 2025 2030
GDP (2005 constant price, 100 million Yuan) 596778 798623 925823
Electricity demand(TWh) 7325 8424 8740
Total energy consumption(10,000 tce) 486000 - 524700
GDP energy Intensity (tce/10,000 Yuan) 0.81 - 0.57
GDP CO2 Emission intensity(tCO2/10,000 Yuan) 1.62 - 0.99
Proportion of non fossil fuel in primary energy
mix 15.7% 0.0% 25%
Proportion of non fossil fuel electricity 30.5% 38.5% 50%
Proportion of wind and solar in power mix 8.6% 15.9% 25%
Maximum load of electricity system (100GW) 11 14.43 16.85
China Nationally Determined Contribution (NDC) and Domestic 14th Power Five-Year-Plan (FYP)
33A3. Economic parameters for fossil fuel power
generation (2030)
Investment cost Fuel cost CO2 (kg/kgce) Efficiency of
(RMB/KW) new unit
Load Shedding 0 6000 RMB (VOLL) 0 100%
Coal power 5200 700 RMB/tce 2.80 41%
Natural gas
combined cycle 3900 2 RMB/m3 1.56 65%
Single cycle
natural gas 3300 2 RMB/m3 1.56 45%
Note: Investment cost for China’s coal power plant is much lower than the cost in developed
countries (50% or even less). We used a relatively high investment cost to indicate the impact
of Ultra-low Emission standard issued after 2017. VOLL: Value of Lost load.
China Nationally Determined Contribution (NDC) and Domestic 14th Power Five-Year-Plan (FYP)
34You can also read