Christchurch Earthquake Hazard Analysis and Risk Mitigation
←
→
Page content transcription
If your browser does not render page correctly, please read the page content below
Christchurch Earthquake Hazard Analysis and Risk Mitigation
Julian Watts¹
1
Gutteridge Haskins & Davey Limited (GHD), Horton House, Exchange Flags,
Liverpool, L2 3PF, United Kingdom
Tel. (+44) (0) 755 445 1698 Fax (+44) (0) 151 244 5041
Email, julian.watts@ghd.com Web www.ghd.com
Summary:
In September 2010, Christchurch, New Zealand was subject to a MW 7.1 earthquake. Following a
further ~5,000 aftershocks it was hit by another MW 6.2 earthquake in February 2011. As part of the
Civil Defence response team, Christchurch City Council required unstable boulders in the Port Hills
to be identified and secured before further tremors could dislodge them. This paper describes the
process of applied GIS to capture locations of rockfall hazards, collate appropriate levels of spatial
data, map the hazardous locations for rapid distribution to field teams and identify at risk areas for
prioritised stabilisation.
KEYWORDS:
Christchurch Earthquake, Rockfall Hazard, Risk Identification, Create Steepest Path, ArcScene
1. Introduction
Following the 10 Km deep MW 7.1 earthquake on a previously unknown fault line in September
2010, Christchurch was thrown into turmoil with initial response teams deploying practiced
procedures to rescue people trapped in buildings and to restore critical services. With limited access
to infrastructure information that was also trapped in council offices, maintenance teams restored
what was understood as critical access ways and pumping stations for potable water and wastewater.
These services, although being restored, were found to require a more strategic approach to restoring
single catchments at a time to ensure connectivity of networks.
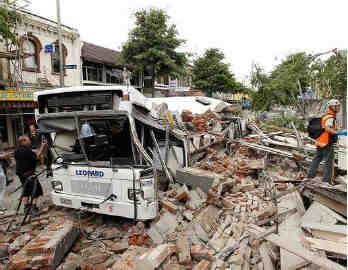
The aftershock of MW 6.2 struck six months later in February 2011. It was centered at only 5 Km
deep, much closer to the city and was during the busy midday lunch hour. Beyond the death toll, the
aftermath had, again, left many without services and landowners unsure if their sites could ever be
built on again. This was then followed by a third devastating aftershock of MW 6.0 in June 2011. The
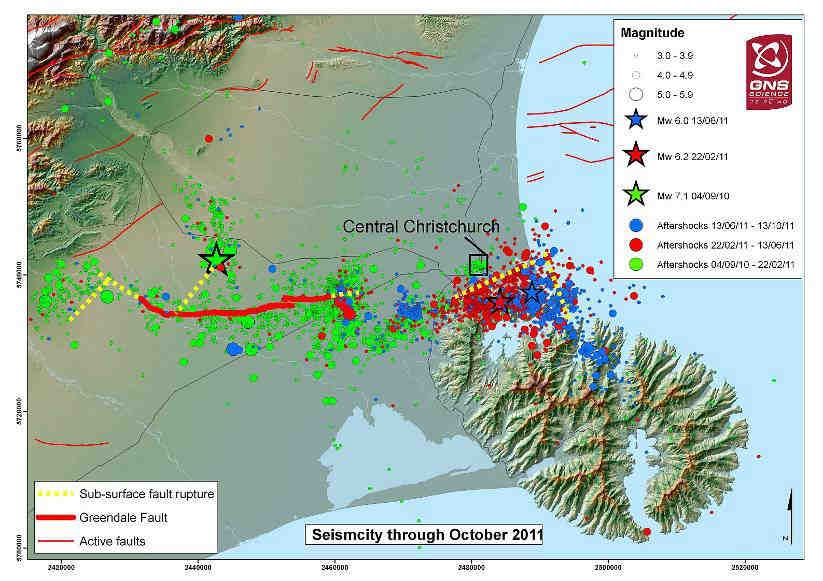
figure below supplied by GNS Science (2011) illustrates the ongoing tremors that had to be endured
whilst response teams carried out their work.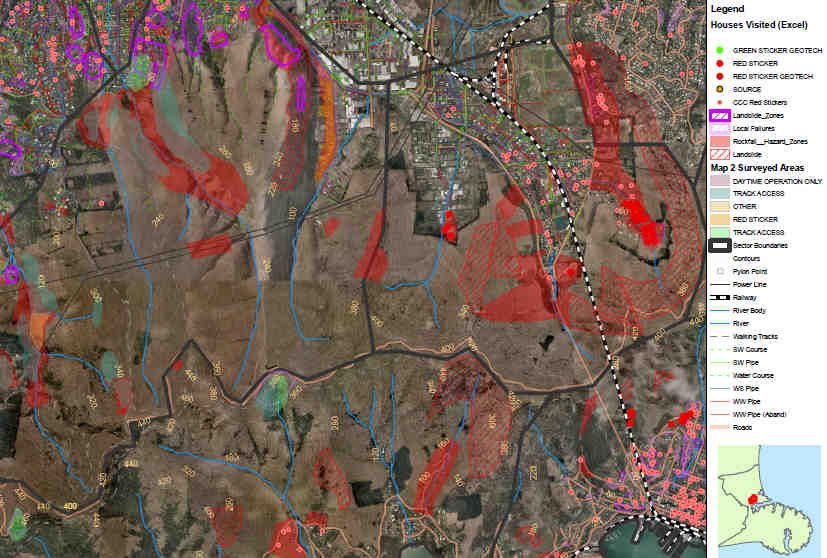
Figure 1. Illustration of Initial Earthquake and Major Aftershocks

Although these aftershocks were expected, the location and severity was not. Having recently dealt
with similar procedures, response teams employed strategic techniques to restore essential services.
This included checking residential properties to ensure their stability inside and security from
surrounding hazards.

2 Hazard Identification Process with supporting Maps

The remedial work described in this paper takes place between the February 2011 and June 2011
aftershocks.

2.1 Rockfall Hazard Identification

The first major aftershock had sent dislodged boulders rolling down cliff faces and through houses.
Building inspectors were sent to review the safeness of houses and capture locations of properties at
risk. This did not include the potential for the continuing aftershocks causing further damage.
Therefore as an immediate requirement, geotech teams were sent to survey the surrounding hillsides
and capture the GPS locations of potential hazards.

2.2 Equipment Utilised

Geotech teams were under tight timeframes to identify hazard locations as it was unknown when
another significant aftershock may occur. The teams used Garmin GPS units and a TG-810 Olympus
Digital Camera with built-in GPS chip to provide waypoints as GPX files and geotagged
Exchangeable image file format (EXIF) photos. A process was quickly established to convert these
formats into useable geodatabases and shapefiles for mapping in ESRI ArcGIS.

2.3 Initial Base Maps

Using a mixture of historic and newly provided data, the author delivered base maps, off-site from
over 1,000 Km away, of the catchment scope to provide an overview for further prioritisation as seen
below.

   Post Hills Hazards

                                                  Potential Residential Risk

         Figure 2. Sector 7 Rockfalls and Landslide Hazards Base Map of the Port Hills

Zones and areas within zones were identified to help prioritise work. Potential rockfall hazards were
identified for stabilisation or to be blasted into manageable pieces. With this information, easily
transportable maps were generated in Google Earth and delivered through Google Maps to teams at
different locations. These provided field teams with locations of site works including blast sites, as
shown below.

           Figure 3. Google Maps showing areas within zones and possible blast sites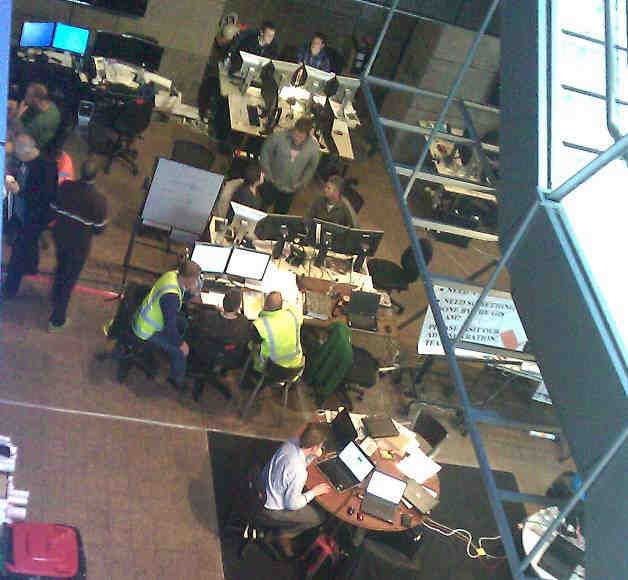
2.4 The Need to be On-Site
As further maps were required in quick succession, the author travelled to Christchurch to assist with
forming a procedure to collate hazard areas and deliver maps for use in the field and for presentations
to Civil Defence to ensure consistency with other response teams.
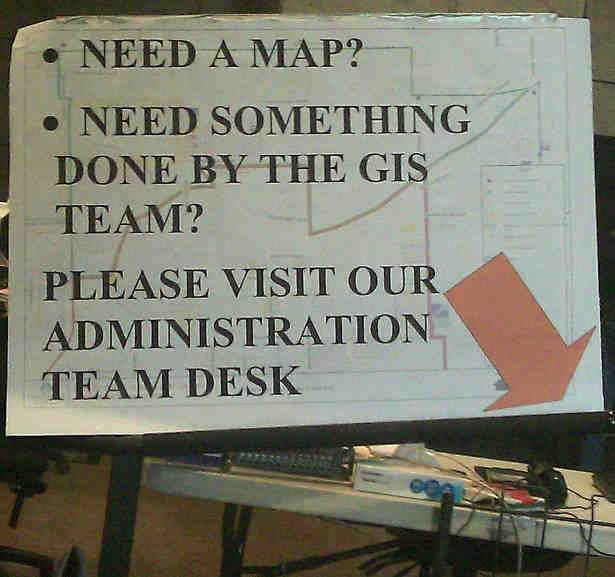
The temporary Civil Defence headquarters had set up servers for GIS data with a dedicated team of
GIS Analysts and database administrators producing maps on demand as seen in the following
photos.
Figure 4. Civil Defence Temporary Headquarters GIS Team
With access to relevant spatial data, appropriate feature-sets were utilised to further enhance spatial
analysis to support the team. High resolution Digital Elevation Models (DEMs) had been captured to
show the differences in ground elevations between LiDAR taken after the September 2010 earthquake
and after the February 2011 earthquake. These were also used to create contours for tin models to
show the severity of the Port Hills area. Further feature-sets were also captured of rockfall locations,
landslides, pipe infrastructure, road infrastructure, rivers, tracks, pylons. Residential houses were
being allocated with a green / yellow / red sticker to indicate the level of existing damage. These were
being continuously updated and provided an indication of the worst liquefaction affected areas.
2.5 Improving the Hazard Capture Process
While on-site the author had the chance to streamline the process of converting field captured notes,
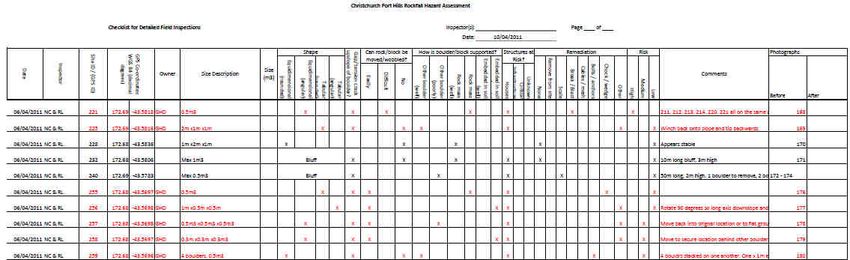
waypoints and photos into useable maps. A form was also provided by the council to assist capturing
all relevant information and ensure a consistent level of detail between teams, as seen below. This
also assisted in standardising the information and format of field data.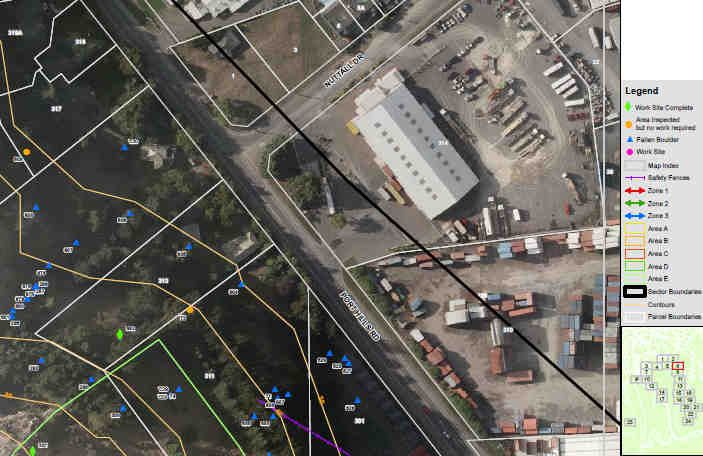
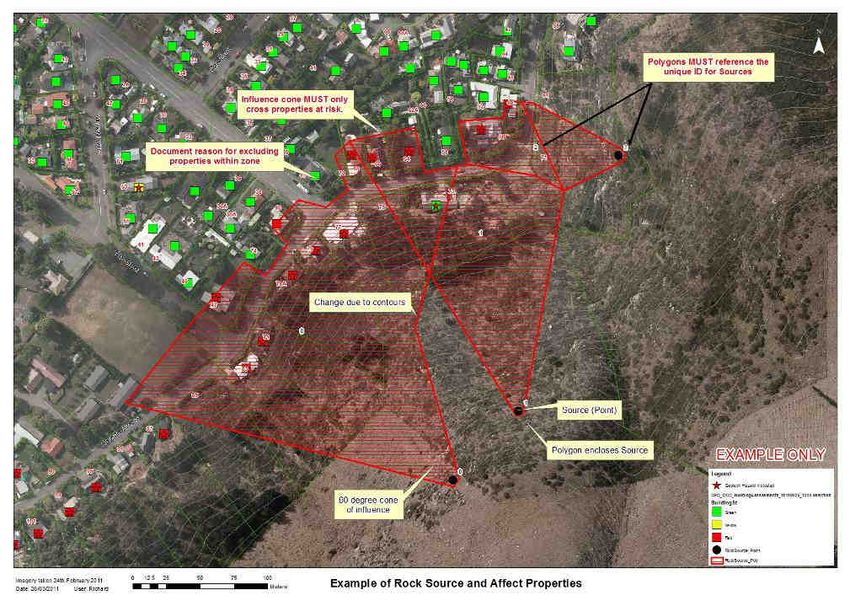
Figure 5. Hazard Capture Form

To improve the quality of map outputs, mapbook projects were created so that teams could print each
area in detail with updated spatial data in a consistent extent, as seen below.

   Figure 6. Mapbook Extract Illustrating Hazard Locations above Industrial Warehouses

2.6 Cones of Risk
As more hazard areas were identified, the need to understand the highest risk areas was required. A
micro study was requested for sites close to unstable boulders that would indicate the potential paths
it could travel. It was considered that there would be a margin of error in the resting point due to the
irregular shape of the boulder, therefore the recommendation for the Cone of Risk was to use a 60º
angle from the boulders starting point. The output was requested as seen below supplied by the
Christchurch City Council (2011).
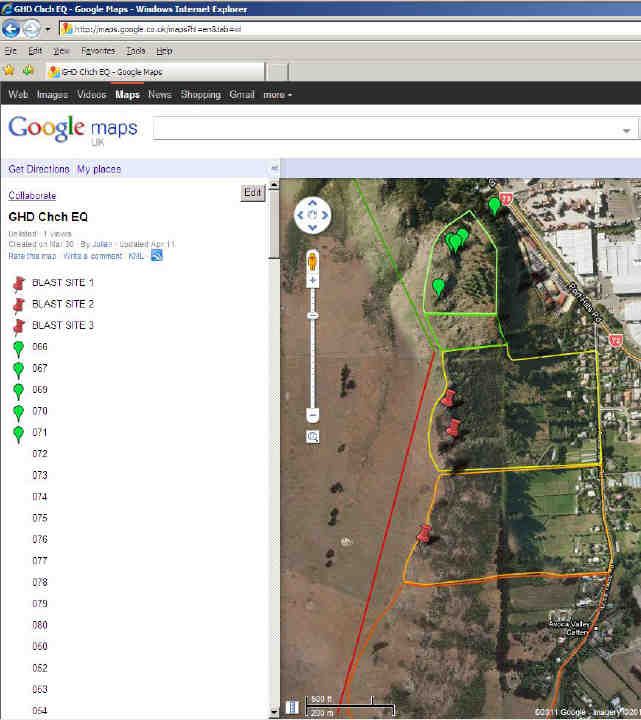
Figure 6. Cones of Risk Example Output

With data supplied that provided a hillside contour, it was possible to use the Create Steepest Path
tool in ArcScene to find the likely path a boulder would take if it rolled down the Port Hills. The
features were draped over a tin created using the contour data. The output produced below was able to
be run for all scenarios of identified rockfall hazards.

                                                                                Boulder Locations

                                                                 Expected resting point

             Figure 7. 3D Model of Port Hills with Steepest Path of each Boulder

With an indicative resting point identified, the 60º Cone of Risk could be placed in the middle of the
resting point. This enabled the use of the Intersection tool to identify all address parcels that the
Cones of Risk breached. These addresses were then reported as higher risk areas.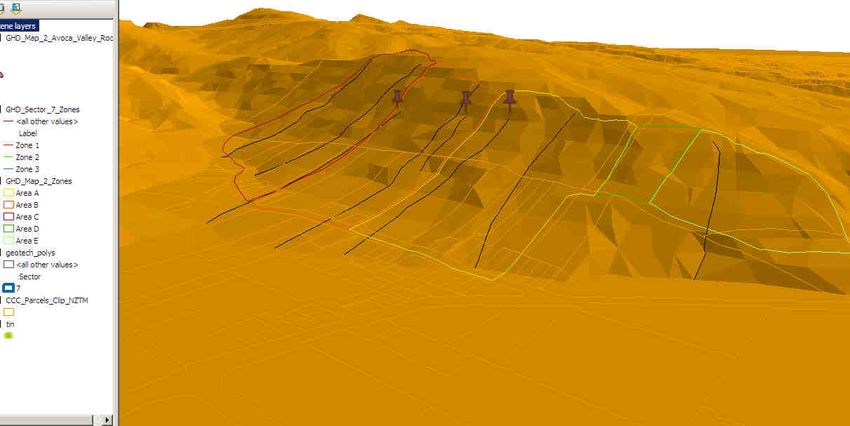
3. Summary

As with all emergency response situations, the best and most appropriate data and resources is not
always available at ground zero. Through the use of remote resources, available equipment and
dedicated response teams, the GIS analysts were able to produce useable outputs to keep emergency
teams mobile and on-task. Each emergency situation has different lead times and requirements that
change with time as the risk subsides.

Further potential improvements in field capture techniques were identified through the use of
Microdot technology where field teams, that do not prefer to use to tablets and PDAs, can use hard
copy forms to capture field information and send digitised electronic data back to base via a mobile
phone connection. Another improvement identified was the requirement to have multiple off-site
backups of information to reduce the risk of limited access to vital and timely data.

The use of GIS to support emergency response efforts in Christchurch has been recognised as a vital
tool in ensuring accurate and real time spatial data could be turned around and delivered to
emergency services to assist and improve critical decision making. It is believed that the remedial
work to secure boulders between the February 2011 and June 2011 aftershocks was critical in
avoiding further damage to properties and their occupants.

4. Acknowledgements

The author would like to thank Christchurch City Council and Environment Canterbury Regional
Council for supplying timely spatial data that enabled these results to be realised. Also recognised is
the Civil Defence, emergency services and all the volunteers for the support and action to minimise
the impacts to the community.

5. References (data sources)

Christchurch City Council, GIS Department. http://www.ccc.govt.nz

Environment Canterbury Regional Council. GIS Department. http://ecan.govt.nz

GNS Science. Seismicity through October 2011. http://www.gns.cri.nz

Geonet. Canterbury Quakes FAQ. http://www.geonet.org.nz

6. Biography

Julian moved to the UK from GHD New Zealand with 10 years spatial sciences experience and eight
years focused on holistic asset management across multiple portfolios. Julian’s emphasis is on
improvement planning to link strategy to people, knowledge, data and system enablers, optimising
service delivery processes and cross-network geospatial modelling.
You can also read