Cicadian Rhythm: Insecticides, Infant Health, and Long-term Outcomes - Amazon ...
←
→
Page content transcription
If your browser does not render page correctly, please read the page content below
Cicadian Rhythm: Insecticides, Infant Health, and
                                Long-term Outcomes∗

                                       Charles A. Taylor†

                                          January 2022

                                              latest link

                                              Abstract

          Pesticides are linked to negative health outcomes, but a causal relationship is dif-
      ficult to establish due to nonrandom pesticide exposure. I use a peculiar ecological
      phenomenon, the mass emergence of cicadas in 13 and 17-year cycles across the east-
      ern half of the US, to estimate the short and long-term impacts of pesticides. With a
      triple-difference setup that leverages the fact that cicadas only damage tree crops and
      not agricultural row crops, I show that insecticide use increases with cicada emergence
      in places with high apple production. Exposed cohorts experience higher infant mor-
      tality and adverse health impacts, followed by lower test scores and higher dropout
      rates. I exploit geo-spatial sources of variation and find evidence for pesticide exposure
      through a water channel. Moderate levels of environmental pollution, not just extreme
      exposure, can affect human health and development. The study design, which encom-
      passes the entire chemical era of US agriculture since 1950, provides insights into the
      regulation of pesticides in the US and globally. JEL Codes: I10, Q10, Q53, Q57.

  ∗
     I am grateful for feedback received at the Heartland Environmental and Resource Economics Work-
shop (University of Illinois), Occasional Workshop on Environmental and Resource Economics (UCSB),
Center for Environmental Economics and Policy (Columbia), BIOECON XXII Conference, OSWEET
Workshop, USF Economics Seminar, Sustainable Development Seminar (Columbia), the Schlenker Lab,
and the Seminar on Planetary Management.
   †
     School of International and Public Affairs, Columbia University, 420 W 118th St, New York, NY
10027, email: cat2180@columbia.edu

                                                  1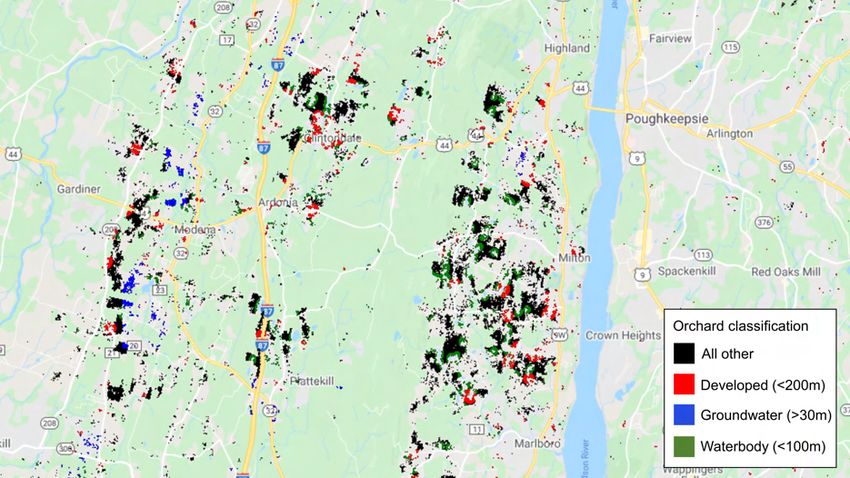
1    Introduction
Farmers in the US spend $8 billion annually on pesticides (US EPA 2017). Modern pesti-
cides, along with other technological advances in agriculture, have brought about signifi-
cant increases in productivity in the post-war period (Jorgenson and Gollop 1992; Wang
et al. 2015). But concerns have long been raised about the potential negative environmen-
tal and health impacts of pesticides given their toxicity by design. Since the high-profile
federal ban of DDT in 1972, dozens of pesticides have been banned by the Environmen-
tal Protection Agency (EPA) on account of their potential risk to humans (Buffington
and Mcdonald 2006). Yet individual pesticide restrictions generally occur after decades
of heavy use (see Figure 2), and many prominent pesticides currently in use—both in the
US but also in agriculturally-intensifying developing countries—are under scrutiny. The
efficient regulation of pesticides is hindered by a lack of causal evidence on their human
impacts.

I use an ecological phenomenon, the emergence of periodical cicadas (Magicicada septen-
decula) in the eastern half of the US, as a source of quasi-exogenous temporal and spatial
variation in the application of insecticides to identify their impacts on health. The iden-
tification strategy hinges on the fact that cicadas emerge as mass broods in the same lo-
cations every 13 or 17 years such that each brood is linked to a specific year and unique
geographic footprint. For example, Thomas Jefferson described the ‘great locust years’ of
Brood II cicadas that arrived every 17 years at his home in Monticello, Virginia (Jeffer-
son 1944). This same brood still emerges on schedule at Monticello 250 years later, most
recently in the summer of 2013.

I first show that farmers respond to a cicada emergence with a one-time increase in insec-
ticide use of 13-22%. This response, however, is limited to places with a large proportion
of woody crops like fruit trees—and not herbaceous row crops like corn and soy—reflecting
the fact that cicadas only damage woody plants: adult cicadas lay their eggs in small branches
and nymphs feed on tree roots. I further show that the response is limited to insecticides
and not other agri-chemical channels like herbicide or fungicide use.

Having established the cicada-insecticide link, I use cicada emergence as my treatment
to compare outcomes in high apple-producing counties during a cicada emergence (i.e.,
the treated group) to (i) those same counties in non-cicada years, (ii) non-apple producing
counties in cicada years, and (iii) counties lacking endemic cicada broods (altogether, the
untreated group). In treated counties, I find a corresponding increase in next-year infant
mortality of 0.31 deaths per thousand births (5% of the current US average of 6) follow-

                                             2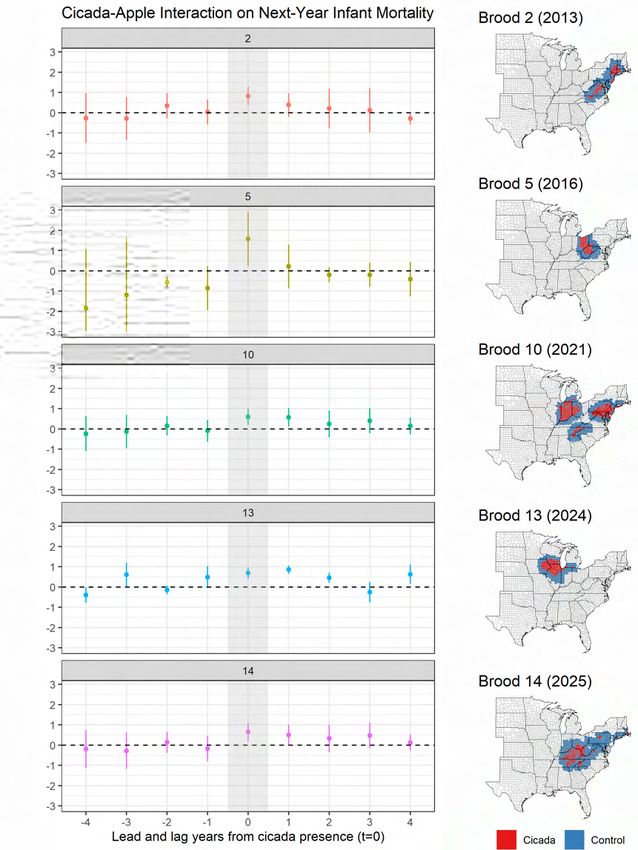
ing a cicada emergence. The lagged effect reflects pesticide exposure during the year of
conception, which manifests in next-year births. The main analysis is reduced form using
a cicada-based treatment rather than an IV with pesticide data in part because granular
pesticide data only recently became available (see Figure 1). While related studies have
focused on the period since 2000 for this reason, the nature of cicadas with their 17-year
revisit cycle enables me to analyze the entire chemical era of US agriculture since 1950.

Looking sub-annually, an analysis of the quarterly impacts shows that fetal exposure risk
is greatest during the first trimester of pregnancy, which is in line with the fetal origins
hypothesis. Treated counties also see an increase in the probability of premature births
and other adverse infant health outcomes. I find evidence of long-term impacts in the form
of lower elementary school test scores and increased high school dropout rates among ex-
posed cohorts.

Exploiting spatially-explicit and high-resolution land use and hydrological data, I find that
orchards in close proximity to population centers and surface waters are related to higher
infant mortality—the latter implying a potential water exposure channel. Alternatively, I
show that the negative effect occurs downstream but not upstream from a county, support-
ing a water exposure channel. This also suggests the presence of spatial spillovers in which
the negative externality of pesticide runoff may extend beyond just the people living in an
apple-intensive county.

The findings are generalizable outside of just agriculturally-intensive regions. Analyz-
ing the major cicada broods individually, each covering a different geographic footprint
of the eastern half of the US, I obtain similar estimates of the impact on infant mortal-
ity—implying the effect is not limited to one region or a set of treatment years. Further,
tree crops cover a relatively small portion of US counties (always less than 5% of county
land area, generally far less than 1%), especially compared to row crops such as soy and
corn which can account for the majority of total acreage in many counties. Baseline in-
secticide use is modest in apple-intensive counties: 14% lower than the average across
all counties in my eastern US sample, and 19% lower than top-decile corn and soybean-
producing counties. Apples as a crop account for only 1.4% of all US pesticide use.

Together these facts suggest that moderate levels of pesticides, not just extreme exposure,
affect human health and development—in line with the emerging medical literature on
subclinical toxicity, which posits that pesticides can have population-level effects via low-
level toxin exposure over time through the ingestion in food, water, or air, in such ways
that never amount to direct poisoning and thus are not observed by medical providers

                                              3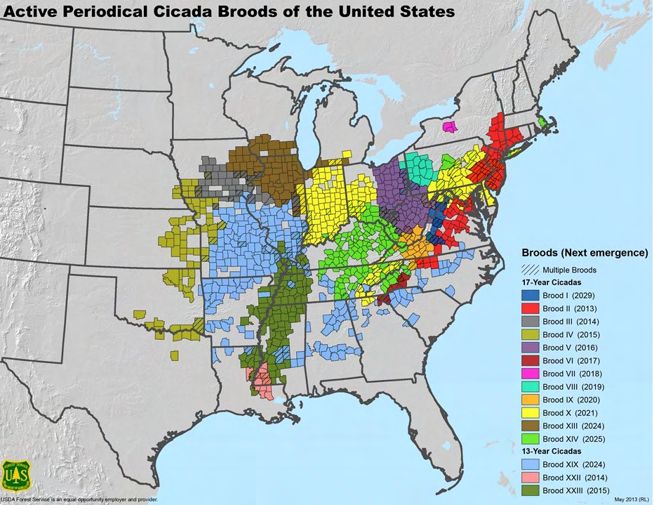
(Landrigan 2018; Dias et al. 2019). And since this analysis looks only at average county-
level impacts, it likely understates the health impacts among those living in close proxim-
ity to the application of insecticides.

Applying my results to a back-of-the-envelope calculation, 556 infant deaths can be at-
tributed to insecticides in the limited context of apple production and cicadas, equating
to a total welfare loss of $5.3 billion using the EPA’s value of statistical life of $9.6 million
(2020 dollars),1 or $81 million annually from 1950 to 2016. The annual value of apple pro-
duction in the sample counties ranged from $500 million to $1 billion in recent decades,
so this cicada-driven response of infant mortality to insecticides could account for 8-16%
of apple production value. For reference, organic apples cost 5-10% more to produce than
conventional ones (Taylor and Granatstein 2013), suggesting that organic production may
be cheaper after accounting for the social cost of insecticides. However, apple production
in the eastern US accounts for only 0.5% of US pesticide use, so if these effects scale across
other crops, the total welfare cost of insecticides could be 200x larger (see Conclusion sec-
tion for further discussion).

In addition to contributing to the environmental and health economics literature on the
health impacts of agricultural inputs, the long-term analysis enabled by the nature of ci-
cadas provides insights into pesticide regulation. To this end, the paper finds that the ef-
fect of insecticides on infant mortality decreased following the ban of highly-scrutinized
pesticides like organochlorides (e.g., DDT) before increasing again in recent decades. Given
that the majority of insecticides used to date were eventually banned or cancelled after
decades of heavy use, this paper raises important questions about whether toxic mate-
rial regulation should be proactive versus reactive, and whether the burden of proof for
demonstrating safety should fall on industry or regulators. The European Union, for ex-
ample, is more stringent in regulating its €177 billion agricultural sector (Eurostat), and
has banned most of the insecticides currently in use in the US (see Figure 2).

Pesticide regulation is a timely topic considering the many current lawsuits and regula-
tory debates.2 Chlorpyrifos, the most widely-used insecticide in the US in recent years,
was banned by the EPA as recently as August 2021. There are also increasing concerns
about pesticide impacts on pollinators and ecosystems more generally (Potts et al. 2016),
particularly in relation to neonicotinoids, a new class of insecticides that became widely-
adopted since the 2000s (Frank and Tooker 2020).3 A bill banning all organophosphates
1
  See link for EPA discussion on mortality risk valuation.
2
  See link for the recent $10 billion glyphosate herbicide settlement; link for a 2021 ruling against the
  EPA’s attempt to reinstate aldicarb for insecticide use in Florida.
3
  See link for efforts by conservation groups to make the EPA account for pesticide risk to plants and ani-

                                                     4
and neonicotinoids was recently introduced in the US Senate.4

Further, an improved understanding of pesticide impacts and the role of regulation is rel-
evant to major agricultural producers like China and Brazil, where pesticide use intensity
is 5x and 2.4x higher, respectively, than the US (FAO 2020). Pesticide use in sub-Saharan
Africa, on the other hand, is very low relative to the global average but is growing rapidly
with little regulatory oversight (Snyder et al. 2015). In India, several EPA-banned pesti-
cides remain widely in use (e.g., acephate, carbofuran, monocrotophos, chlorpyrifos) and
DDT is still employed for public health purposes.5

The paper is structured as follows: the remainder of this Introduction provides background
on the health effects of pesticides, trends in pesticide use and regulation, and the nature
of cicadas and their relationship to insecticide use. Section 2 describes the data. Section 3
introduces the empirical approach and identification strategy. Section 4 shows the main re-
sults relating to the impact of pesticides on health and other outcomes. Section 5 includes
several extensions, including spatial analyses, an investigation of exposure channels, and
robustness checks. Section 6 contains a conclusion and discussion of policy implications.

1.1     Pesticides and health
Pesticides have long played an important role in society. Their use for both agricultural
and human hygiene purposes is well documented in ancient Egypt, Rome, Greece, India,
and China where application methods often involved the burning or powder-spreading of
sulfur and arsenic compounds (Costa 1987). Today US farmers spend $8 billion annually
on pesticides (US EPA 2017), a category that includes herbicides, fungicides, and insec-
ticides. In the absence of insecticides, crop yields would be 18% lower on average (Oerke
2006). As an agricultural input, pesticides provide crop protection services that smooth
yields, which is a different function than fertilizer, which boosts yields. In the context of
this study, the risk of pests is particularly high for perennial crops like apples, where in-
sects can destroy an asset with high upfront investment costs that could otherwise pro-
duce for many years (unlike annual crops). Further, insects can reduce yields for peren-
nials both in the year of an infestation and the year afterwards through diminished plant
productivity (Cerda et al. 2017).

Insecticides are toxic by design. Many were initially developed for warfare purposes. One
  mals protected under the Endangered Species Act.
4
  See link for S.4406 - Protect America’s Children from Toxic Pesticides Act.
5
  See link for a list of banned pesticides in India as of January 2021.

                                                     5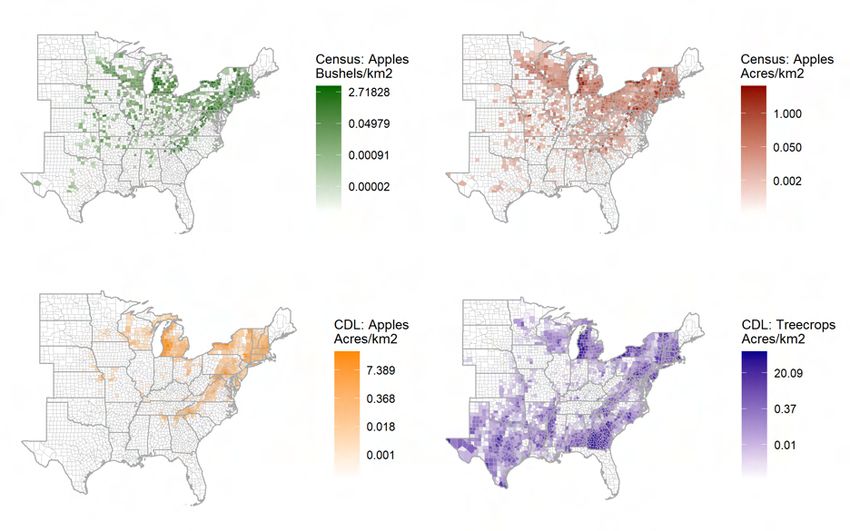
prominent insecticide type, organochlorides (e.g., DDT), opens sodium channels in the
nerve cells; the two main insecticide classes currently in use in the US, carbamates and
organophosphates, target the nervous system, acting similarly to the nerve agents in chem-
ical weapons. US agriculture quickly became reliant on synthetic pesticides in the post-war
period, and by the early 1950s organochlorides were the dominant insecticide class in use.
Public concern about the unintended health and environmental impacts of pesticides in-
creased throughout the 1960s, punctuated by Agent Orange’s link to cancer during the
Vietnam War and the ban of DDT in 1972 (EPA 1975; Carson 2002; Fallon et al. 1994).

While laboratory and controlled studies have documented the negative impacts of pesti-
cides on organisms and ecosystem services such as water quality, few have demonstrated a
direct causal link between pesticides and human health—and in particular their effect on
highly vulnerable populations like infants. Fetal shocks, especially ones occurring early in
a pregnancy, can have long-lasting impacts (Barker 1995; Almond and Currie 2011), and
environmental shocks in particular, including heavy metal exposure and air pollution, have
been causally linked to adverse outcomes at birth and later in life.6

Most estimates of the impact of pesticides on infant health come from non-randomized
studies with small sample sizes (Jurewicz et al. 2006; Andersson et al. 2014), whereas oth-
ers focus on occupationally-exposed groups who are unlikely to be representative of the
broader population. Among farm workers, there is evidence of higher levels of stillbirths
(Regidor et al. 2004) and birth defects (Garry et al. 2002), especially for conceptions oc-
curring during the spring pesticide application season. Others highlight the impact of pes-
ticide exposure during the first trimester (Bell et al. 2001) and a link between fertilizer
chemicals in water and birth defects (Winchester et al. 2009). Schreinemachers 2003 find
that birth defects increase with a county’s wheat acreage, which is used as a proxy for her-
bicide exposure. Rauh et al. 2012 find evidence of long-term impacts in the form of lower
IQ scores among a small sample of children exposed to insecticides in utero.

Larsen et al. 2017 use detailed spatial and micro-level panel data in California to show
that pesticide exposure increases adverse birth outcomes among populations exposed to
high quantities of pesticides (i.e., 95th percentile exposure). Brainerd and Menon 2014 ex-
ploit variation in planting times to link fertilizer pollution to adverse birth outcomes in
India, while Lai 2017 uses a policy change in China to link pesticides to increased rates
of disability. Dias et al. 2019 link herbicide use driven by genetically-modified crop adop-
6
    There is a rich literature documenting the impact of pollution on birth outcomes (Chay and Greenstone
    2003; Currie and Neidell 2005; Currie and Walker 2011; Clay et al. 2014) and childhood and adult out-
    comes (Sanders 2012; Ebenstein 2012; Currie et al. 2014; Zheng et al. 2016; Isen et al. 2017; Deryug-
    ina et al. 2019; Colmer and Voorheis 2020; Persico et al. 2020).

                                                     6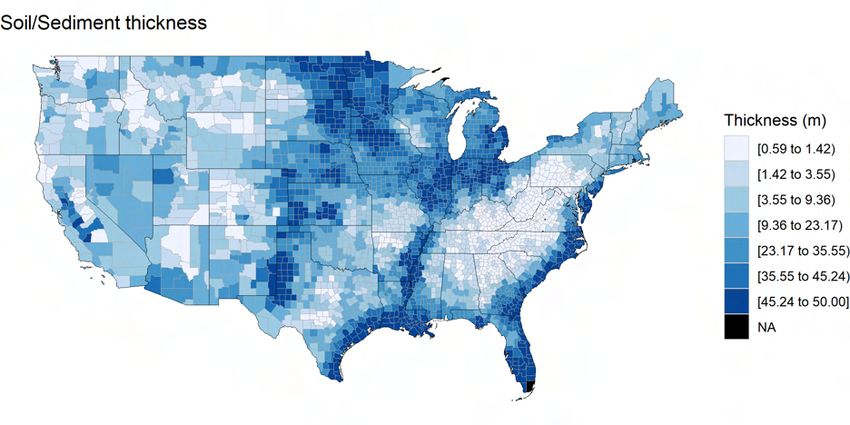
tion to negative birth outcomes in Brazil. Others have have leveraged one-time ecological
shocks for identification: a bat-killing fungus to obtain variation in insecticide use to show
impact on infant mortality (Frank 2018), and responses to an invasive fly insect that pro-
duced adverse infant health outcomes (Jones 2020).

To my knowledge, this paper is the first to directly assess the subclinical impact of pesti-
cides on health over a large scale (eastern half of the US), across a broad range of pesticide
chemical types, and over a long time period (1950 to present), as visualized in Figure 1—
and to link pesticide exposure to health effects and longer-term outcomes.

1.2        Pesticide trends and regulation
The next section provides context on the overall trends in pesticide use in the US. Ap-
pendix Figure A1 shows that among the main pesticide types, herbicide use increased
rapidly through 1980, and then stabilized before increasing again in the 2000s following
the mass adoption of genetically engineered, herbicide-tolerant crops and no-till agricul-
ture. Insecticide use, on the other hand, which exceeded herbicide use for much of the
1960s, has been in decline since the mid-1970s.

In terms of quality characteristics, average pesticide application rates (i.e., pounds per acre
over a year) declined by one half since the late 1960s, as shown in Appendix Figure A2,
implying that pesticide efficiency increased starting in the 1970s. Potential impacts on hu-
mans and the environment, however, are a function of pesticide toxicity and persistence in
addition to quantity. To this end, average toxicity7 declined rapidly in the 1970s driven by
the ban of DDT and toxaphene (primarily used on cotton) and aldrin (primarily used on
corn), as well as the use of relatively less toxic insecticides like carbaryl, chloropyrifos, and
pyrethroids (Fernandez-Cornejo et al. 2014).

Average pesticide persistence fell from 54% in 1968 to 25% in 2008, defined as the share
of pesticides with a half-life greater than 60 days (Fernandez-Cornejo and Jans 1995).
The 1970s saw a notable decrease in persistence with DDT and aldrin off the market,
followed by an increase in the early 1990s coinciding with longer-lasting metolachlor and
pendimethalin. Average persistence then declined in the mid-1990s with the large-scale
adoption of glyphosate herbicide (Fernandez-Cornejo et al. 2014). Appendix Figure A3
shows that despite the increase in pesticide efficiency and change in pesticide composition,
7
    Toxicity refers to the chemical’s risk to humans and the environment, and is estimated based on the in-
    verse of the safe drinking water threshold (Kellogg et al. 2002) in terms of constituent concentration in
    parts per billion.

                                                        7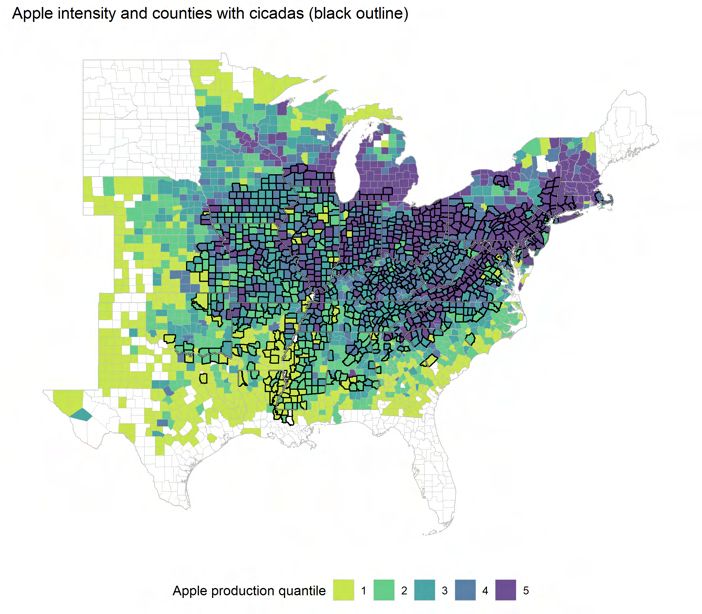
pesticide prices stayed relatively in line with average crop prices over the decades, with
some periods of lower relative prices in the 1970s and 1980s and higher prices in the late
1990s and early 2000s. But relative to fuel and labor costs, pesticides became far less ex-
pensive over time.

Historical crop-specific estimates of insecticide use are often imputed for a given geogra-
phy based on overall pesticide consumption and the acreage in a given land use. Looking
at five major US crops, Appendix Figure A4 plots insecticide use trends with total quan-
tity on the left panel and intensity (kg per acre) on the right. Cotton accounts for much of
historical insecticide use and its decline can be attributed to several factors: the successful
USDA Boll Weevil Eradication Program that began in the early 1970s and reduced insec-
ticide use in cotton by 40 to 80% (Smith 1998), and the introduction of Bt cotton in the
mid 1990s, which was genetically-engineered for pest resistance.

Regulation occurred in tandem with these changes in pesticide use. Since the ban of DDT
in 1972, dozens of widely-used pesticides have been cancelled by the EPA. Figure 2 in
Panel A shows that seven of the top ten insecticides used in the US in 1968 (Fernandez-
Cornejo et al. 2014) were banned or cancelled, with only carbaryl, cryolite, and dicro-
tophos currently remaining in use. Remarkably, the top two insecticides used in 2008,
chlorpyrifos and aldicarb, are banned as of 2021. Several of the remaining widely-used in-
secticides are the US are banned in the European Union. Panel B shows the primary in-
secticides used over the last seventy years in the US in terms of when they were registered
for use with the EPA and when they were phased out. Two things to note: first, many of
the insecticides were developed in the immediate post-war 1950s, and second, there has
been a fairly consistent pattern of insecticide cancellation following several decades of in-
tensive use.

To visualize the effect of regulation and technological change over time, Appendix Fig-
ure A5 plots long-term trends in insecticide use by active ingredient type, merging histori-
cal data at the national level (Aspelin 2003) with the more recent United States Geological
Survey (USGS) county-level data used in this paper (USGS 2019). Similar to Appendix
Figure A1, aggregate insecticide use peaks in 1975 then declines, but in terms of chemical
type there is significant variation. Insecticide use is dominated by inorganics like arseni-
cals until about 1950, at which point the synthetic chemical age begins with organochlo-
rides (led by DDT) driving insecticide growth. In the late 1960s organophosphates begin
to replace organochlorides (DDT was banned in 1972). Organophosphates, in turn, are re-
placed by other types of insecticides starting in early 1990s, coinciding with increases in
pyrethroid and neoincotinoid insecticide use as carbamates are phased out. Such patterns

                                               8
reflect the increasing proportion of organochlorides, then organophosphates, and then car-
bamates that were subject to EPA restrictions over time.8

The US is unique in pesticide regulation in that many pesticides are “voluntarily” de-
registered by their corporate owners, which is different than the regulator-driven approach
in most countries. In some cases, cancellation occurs under pressure from the EPA in re-
sponse to mounting evidence on health impacts or legal challenges, and in other cases it
can be an economic decision in the face of a product’s declining sales, improved replace-
ment pesticide availability, and patent lapses (Carroll 2016; Donley 2019). Nevertheless,
all the cancelled insecticides listed in Figure 2 have well-documented health and environ-
mental risks in the scientific literature, and each has also been banned in the European
Union.9

It is also worth noting that pesticide producers in the US have faced increased regulatory
scrutiny in recent decades associated with (i) the 1988 amendment to the Federal Insecti-
cide, Fungicide, Rodenticide Act (FIFRA), which required the re-registration of all pes-
ticides approved before 1984 under current scientific and regulatory standards, (ii) the
Food Quality Protection Act (FQPA) in 1996 that reduced the allowable amount of pes-
ticide residues on food crops, with an emphasis on risks to infants, and (iii) enhancements
to FIFRA through the 2004 Pesticide Registration Improvement Act (2019).

1.3     Cicadas and Insecticides
Periodical cicadas (Magicicada septendecula) occur throughout the eastern half of the
US.10 Bob Dylan described the distinctive mating song of the cicada (colloquially called
a locust) while receiving an honorary degree from Princeton in the summer of 1970:
8
  USGS data allows for some disaggregation by chemical type and land use at the state level. The bottom
  panel of Appendix Figure A5 sums insecticide use ‘Orchards and grapes’, a category that includes apple
  production, across eastern states in this study. Patterns are broadly consistent with the national trends
  since 1992 shown in Appendix Figure A1 in which insecticide use declines overall. However, organophos-
  phates still account for the majority of insecticide use among orchards.
9
  In the US, the pesticide industry has to demonstrate to the EPA that a product “will not generally cause
  unreasonable adverse effects on the environment” defined as “any unreasonable risk to man or the envi-
  ronment, taking into account the economic, social, and environmental costs and benefits of the use of any
  pesticide” under the Federal Insecticide, Fungicide, and Rodenticide Act, U.S.C. §136 et seq. (1996) and
  “reasonable certainty of no harm” for pesticide residues on food under the Food Quality Protection Act
  Public Law 104-170 (1996). For comparison, the European Union places the burden of proof on compa-
  nies to show that pesticides are safe (regulations 1107/2009 and 396/2005), requiring that “that industry
  demonstrates that substances or products produced or placed on the market do not have any harmful
  effect on human or animal health or any unacceptable effects on the environment.” (2019).
10
   Several annual cicada species (i.e., non-periodical) exist globally, but the populations of such species do
   not tend to vary greatly year to year.

                                                      9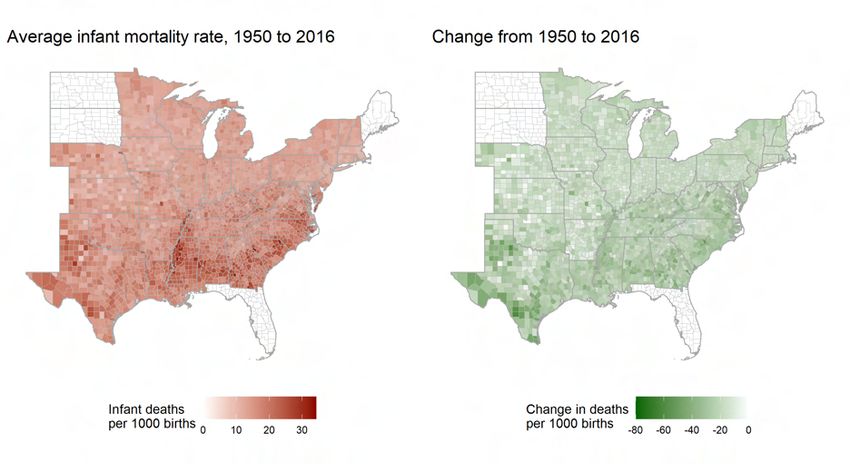
And the locusts sang, yeah, it give me a chill
                Oh, the locusts sang such a sweet melody
                Oh, the locusts sang their high whining trill
                Yeah, the locusts sang and they were singing for me

These cicadas belonged to Brood X, the same cohort that visited the mid-Atlantic three
17-year cycles later in 2021. Altogether, there are fifteen extant broods, three of which are
on 13-year cycles and twelve of which are on 17-year cycles. Rarely flying more than 50
meters from where they emerge from the ground, each brood returns to the same place
at the cycle’s end. Figure 3 maps each brood’s range, cycle, and next year of emergence.
Note that some counties receive multiple broods.

There is ample agronomic and ecological research on cicadas and tree health, with a con-
siderable focus on fruit trees in particular. Cicadas spend most of their lives underground
feeding on the xylem fluids of tree roots before synchronously emerging in the late spring
at any given location. Emergence densities of 1.5 million cicadas per acre have been re-
ported (Dybas and Davis 1962), representing some of the highest biomass values of any
naturally occurring terrestrial creature. Cicadas remain active for four to six weeks to
mate and lay their eggs in small tree branches (i.e., oviposition), causing harm especially
to young trees. When the eggs hatch, the nymphs fall to the ground to begin their devel-
opment. Tree growth is further damaged by cicada nymphs feeding on tree roots, which
can reduce growth by up to 30% (Karban 1980).

Both the egg-laying and nymph-feeding processes have a negative impact on orchard trees.
In an early study, Hamilton 1961 reported a complete loss among unprotected young apple
and pear trees in the Hudson Valley following a cicada event in 1945. Karban 1982 con-
ducted an experiment on apple trees and found that removing cicada nymphs significantly
increased wood accumulation relative to when nymphs were present.

Most commercial tree growers and serious gardeners are well aware of the damage that ci-
cadas can cause, and utilizing insecticides to mitigate cicada damage is well established.
Studies have documented the process and efficacy of spraying trees with insecticides to
kill adult cicadas as well as soaking the soil with insecticides to control nymphs (Hamil-
ton 1961; Cahoon and Danoho 1982),11 while others recommended killing off understory
grasses to starve young nymphs (Lloyd and White 1987). There are many publicly-available
resources on cicada management for fruit growers, including information on pesticide use
and application methods (Krawczyk 2017; Johnson and Townsend 2004). Insecticide ap-
11
     One study tested cicada nymph control using soil injections of carbaryl at a rate of 2 lb per tree (1982).

                                                       10
plication is intensive and repetitive during cicada emergence: a 2021 Purdue University
guide (link) suggests that large commercial orchards re-apply insecticides every 3 to 4 days
over the course of a month to prevent injury to young trees.
2 Data
Cicada data
The US Forest Service provides shapefiles with county-level presence-absence data on pe-
riodical cicadas by brood with emergences projected through 2031 (Koenig et al. 2011).
Given the temporal and spatial consistency of cicada emergence, I extend the time series
further into the past using each brood’s 13 or 17-year cycle assuming that cicada emer-
gence occurred in the same counties. Distribution maps are derived from pioneering work
done over a century ago (Marlatt 1898; 1907). These maps may overestimate current
brood boundaries due to habitat loss and the misassignment of straggler cicadas (Marshall
2001), and have been updated to periodically (Simon 2014; J. Cooley et al. 2009; J. R.
Cooley et al. 2016; J. R. Cooley et al. 2021). While there are examples of accelerations
in cycles and changes in the range of broods (Lloyd and Dybas 1966; Williams and Si-
mon 1995), cicada behavior and brood distribution has been remarkably consistent for the
most part (Marshall 2001). For robustness, a recent map is utilized of eight cicada broods
in five Mid-Atlantic states derived from field research and actual cicada presence/absence
sightings.12
Agricultural, land use, and water data
The land use dataset comes from the USDA’s National Agricultural Statistics Service
(NASS) online tool and from the historical U.S. census of Agriculture, available online
through the Inter-university Consortium for Political and Social Research (ICPSR) com-
piled (Haines et al. 2014). Various measures of apple intensity are collected at the county-
year level (i.e., number of acres and production in bushels).13 I choose apples as the pre-
ferred measure of tree crops because apples are the historically-dominant tree crop in the
US. There is also ample agronomic and ecological literature on the effect of cicadas on ap-
ple trees, as described earlier. Apple production is well-distributed geographically among
12
“Current Brood Distribution for Periodical Cicadas in the Mid-Atlantic Area.” Source:
https://cicada.info (persistent link)
13
County-year data values of ‘(D)’, which NASS uses to denote confidentiality, were coded as not avail-
able, and values of ‘(Z)’, which denote being too small to estimate, were coded as zero. Given that only
positive values are included in NASS output, excluded county-years are assumed to have a value of zero.
All measures of agricultural intensity are standardized by county land area.
11the cicada-endemic eastern US states, with top producers in the Northeast (NY, MA, CT),
Central-Midwest (PA, MI, OH), and the South (VA, NC). Figure 3 shows the states in-
cluded in my analysis along with cicada presence and quantile of apple production inten-
sity.
The USDA’s Cropland Data Layer (CDL), a remotely-sensed, high-resolution (30m) mea-
sure of land use (NASS 2008), is used as an alternative to administratively-derived USDA
census data. CDL data was spatially processed using Google Earth Engine. I use data
from 2008, the earliest available CDL product that spans the entire US.
An annual time series cannot be constructed for tree crop variables for several reasons: the
agricultural census takes place every five years, variables were not measured consistently
over time, and surveys in the 1970s and 1980s only included 50% of counties. Therefore, I
used a time invariant measure of county-level tree crop intensity, varying the base year for
robustness checks. But since tree crops are long-term investments with an asset value over
multiple decades, there is very little annual change in planted area, unlike row crops.
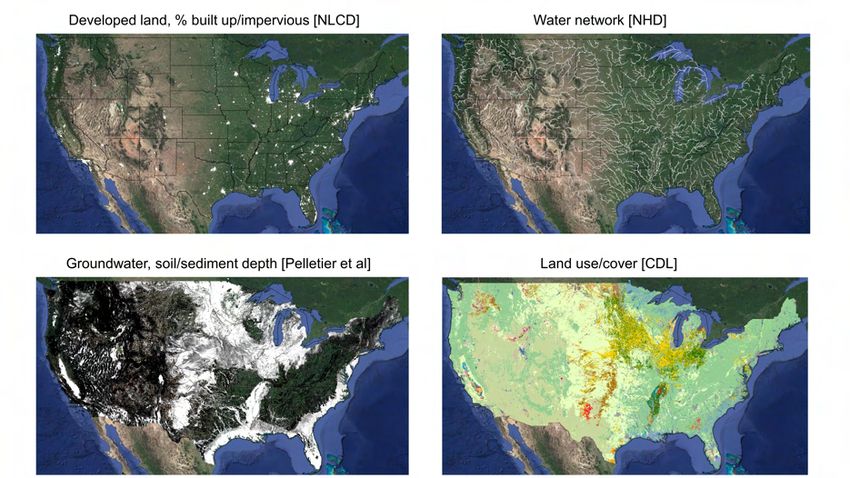
The upstream-downstream analysis utilizes USGS watershed boundaries of hydrologic unit
code HUC-4 and HUC-12 to assign water flows between counties using flow relationships
from the National Hydrography Dataset (NHD). Proximity of water bodies to a given land
use is calculated using the water drainage network from NHD (Buto and Anderson 2020).
Groundwater potential is derived from a gridded global dataset of soil, intact regolith,
and sedimentary deposit thicknesses (Pelletier et al. 2016). This measures the depth to
reach unweathered bedrock, where groundwater is generally located. Places with shal-
low bedrock are less likely to have aquifers with extractable groundwater. The measure
ranges from 0 to 50 meters, which is the maximum value for depths greater than 50 me-
ters. Appendix Figure A15 shows a map of geological thickness averaged over US counties.
A binary indicator is used for whether thickness is greater than 30m, which corresponds
to 25% of all observations. Areas with greater thickness (i.e., over 30m) are more likely to
have extractable groundwater. As confirmation, the bottom panel plots a LOESS (i.e., lo-
cal regression) line over a scatter plot of all grid cells by FAO’s estimate of area equipped
for groundwater irrigation and soil/sedimentary thickness. There is an increasing relation-
ship, with a kink around 30m, implying that the potential for groundwater irrigation in-
creases around this point.
Pesticide data
The United States Geological Survey (USGS)’s National Water-Quality Assessment Project
provides county-level pesticide use data from 1992 to 2016 (USGS 2019). Information was
12compiled from surveys of farm operations in USDA Crop Reporting Districts and annual
crop acreage reports. The preferred measure is the sum of all insecticide-categorized con-
stituents using the ‘EPest-high’ measure in kilograms per county.14 Petroleum-based oil
products, which can be used as standalone insecticides but are mainly mixed with syn-
thetic insecticides to aid in application practices, are omitted given their general lack of
toxicity. Insecticide intensity is also standardized by county land area.
Infant health data
Infant mortality and birth outcome data come from the National Center for Health Statis-
tics (NCHS 2019). NCHS Natality Data Files contain full records for data publicly avail-
able from 1968 to 1988, while records from 1989 to 2016 were obtained under confiden-
tiality agreement. NCHS Linked Birth-Infant Death Data Files contain confidential micro-
data from 1995 to 2016. For longer-term analysis of infant mortality, I use the Inter-university
Consortium for Political and Social Research (ICPSR)’s County-Level Natality and Mor-
tality Data, 1915-2007 (Bailey et al. 2016). The ICPSR data are averaged annually and
do not allow for within-year or demographic disaggregation aside from race. I use ICPSR’s
preferred ‘fixed’ variables whenever available.
ICPSR’s resident infant death data become available starting in 1941 and are based on the
residence county of the mother (rather than the county of birth occurrence). After 1988,
ICPSR masks counties with populations less than 100,000, which presents challenges given
that many of the counties of interest are rural with populations lower than 100,000. Since
the NCHS Linked Birth-Infant Death data begin in 1995, there is a data gap from 1989
to 1994 for low population counties. Starting in 1995, I use infant mortality rates derived
from these linked files to fill missing ICPSR observations. I address concerns about sam-
ple composition by running alternate analyses on a subset of observations ending in 1988,
as well as a sample using IPUMS data which is available from 1990 to 2007 (Manson et
al. 2020).15
I use the NCHS Linked Birth-Infant Death data from 1995 to 2016 to compute infant mor-
tality rates at the sub-year level (i.e., quarter averages that can be linked to timing of in-
secticide application). I use NCHS Natality data from 1968 to 2016 to construct detailed
birth outcome measures like Apgar scores, gestation time, and birth weight, as well as for
constructing controls for maternal characteristics.
14
The USGS pesticide dataset was classified by function (i.e., insecticide, herbicide, fungicide) like in
Frank 2018. 160 of the constituents had insecticidal properties.
15
Results hold whether using the infant mortality dataset constructed by combining the Linked Infant
Birth/Death Files with historical ICPSR calculations, incorporating IPUMS data, or just using the
ICPSR dataset which underwent additional data cleaning as described in Bailey et al. 2016.
13Appendix Figure A8 shows the decline from 1950 to 2016 in infant mortality over time
for both cicada and non-cicada endemic counties in the eastern states of the US, and Fig-
ure A10 is a map of average infant mortality and its change over time at the county level.
Education data
For educational achievement, I use standardized annual county-level test scores from the
Stanford Education Data Archive 2.1 (Reardon et al. 2018). SEDA harmonized state and
federal NAEP test results to create a spatially and temporally consistent dataset available
for the seven years from 2009 to 2015. Despite the challenges in comparing state level test
results, Kuhfeld et al. 2019 find high correlations between the SEDA data and NWEA’s
MAP Growth which is another nationally administered test given to a subset of the pop-
ulation. I average SEDA county data across the third, fourth, and fifth grades to produce
an elementary school average score for each cicada exposure cohort (e.g., 3rd graders nine
years after a cicada event, fourth graders ten years afterwards, and fifth graders eleven
years afterwards).
For educational attainment, I construct a dataset on high school dropout rates using the
National Center for Education Statistics (NCES) Local Education Agency Universe Survey
Dropout and Completion Data. I average across school districts to get county-level values
from 1991 to 2008. My preferred measure is twelfth-grade dropout rate, which is the total
number of twelfth graders dropping out of high school in a given year divided by the total
number enrolled.
Economic and demographic data
County-level economic data come from US Department of Commerce, Bureau of Economic
Analysis. Decadal county-level migration rates are from Winkler et al. 2013. Summary
statistics of the primary variables are included in Appendix Table A1.
3 Empirical Approach
Cicada emergence is anticipated by both tree growers and, to a certain extent, the gen-
eral population. There is ample news coverage leading up to what some call ‘cicada ma-
nia’. Appendix Figure A7 shows the Google Trends of average monthly search volume for
the word ‘cicada’ in metropolitan regions of Virginia, including Charlottesville, the area
where Thomas Jefferson noted the creatures in his writings over two centuries ago. This
event study demonstrates the distinct temporal pattern of periodical cicadas. The spikes
in 2004, 2013, and 2021 coincide with the emergence years of the two endemic broods to
14the region.
Despite the public awareness, I argue that cicada emergence is effectively exogenous in re-
lation to anything that could affect public health outcomes at a county level. I have found
no research or media reports documenting any aggregate increase in pesticide usage in
cicada years, and nothing about the health risks related to cicadas and pesticide use. In
fact, most media coverage highlights the fact that cicadas are harmless to humans.
Further, the greater Charlottesville region accounts for much of Virginia’s fruit produc-
tion, whereas Richmond and DC have few orchards. Yet public interest in cicadas follows
similarly predictable patterns across regions—regardless of land use. Cicada emergence
therefore would act as a quasi-experiment where tree-intensive counties receive more insec-
ticides during emergence years relative to the same counties during non-emergence years,
and where tree-intensive counties receive more insecticides relative to non tree-intensive
counties in emergence years. I include several robustness checks and alternative specifica-
tions to ensure the exclusion restriction holds.
Insecticide exposure and its potential impact on health should be related to the life cycle
of the cicada, the risk to tree crops, and the timing of human exposure. Figure 4 provides
a conceptual framework. If accurate, one would expect: first, an increase in insecticide use
in the year of cicada emergence; second, birth impacts in the year following emergence,
starting in the spring; and third, yield impacts on tree crops beginning in the year before
emergence as nymphs increase their root feeding and continuing for several years. Each of
these propositions is tested and confirmed in the analyses that follow.
3.1 Model
My approach involves first testing whether there is an increase in insecticide use in treated
counties in cicada emergence years, and second, whether there is a follow-on impact on
infant health and longer-term outcomes. The independent variable is a cicada presence-
absence dummy, cicadait , taking the value of 1 if there is a cicada emergence in county i
in year t, and 0 otherwise. Cicada emergence for each brood is based on its endemic lo-
cation and cycle time, as visualized in Figure 3. The cicada dummy is interacted with a
fixed measure of tree crop intensity (e.g., apple production), applei , in county i. The sam-
ple is restricted to all the counties in the 34 states in the eastern half of the US that span
the range of periodical cicadas, including non-cicada endemic counties in these states as
well.
15Functionally, the empirical approach consists of a triple-difference with temporal variation
(i.e., is it a cicada emergence year?), spatial variation in cicada broods (i.e., is the cicada
brood endemic to a given county?), and spatial variation in land use (i.e., is the county
an intensive apple producer?). But since the cicada-presence absence variable collapses
the first two forms of variation into one, the model specification looks more like a double-
difference in practice.
For the first step, I specify a model with insecticide use intensity, insecticideit , as the de-
pendent variable, measured in kilograms of insecticide per km2 in county i in state s in
year t.
insecticideit = β1 cicadait + β2 cicadait ∗ applei + αi + γt + states(i) + it (1)
where αi includes county fixed effects and γt includes year fixed effects. The former ac-
counts for any time-invariant properties of the county that could affect outcomes. Year
fixed effects account for national-level time trends and annual anomalies like changes in
commodity prices and recessions. State time trends states(i) account for trends that could
be driven by state-level policy.16 Note that this model does not separately estimate the ef-
fect of apple intensity, in itself, on outcomes because this measure is unvarying over time
and thus subsumed by county fixed effects. The coefficient of interest, therefore, is β2 ,
which estimates the change in insecticide use in tree crop-intensive counties driven by ci-
cada emergence.
For health outcomes, I specify a model similar to Equation 1 but replace insecticide inten-
sity with infant mortality rate (infant deaths per thousand live births), imri,t+1 , in county
i in the following year, t + 1:
imri,t+1 = β1 cicadait + β2 cicadait ∗ applei + αi + γt + states(i) + it (2)
The coefficient of interest is again β2 , which estimates the change in infant mortality rate
stemming from a cicada emergence in tree crop-intensive counties. In addition to imr, I
test for other impacts of infant health and educational outcomes.
These reduced-form analyses are run separately using cicada emergence as the treatment
rather than using cicadas as an instrument for insecticide use for several reasons: first,
16
State-year fixed effects are not used because some cicada brood-years encompass much of certain states
(i.e., Brood X and Indiana).
16county-level pesticide data only became available in recent decades, while the nature of
cicadas allows for the analysis of health impacts from the beginning of the intensive chem-
ical era of US agriculture in 1950—thereby enabling insights into the effects of pesticide
types that since received scrutiny (i.e., organochlorides), ones currently in use, and ones
banned in the US but still utilized in developing countries. The span of the datasets can
be visualized in Figure 1, which shows that major changes in national-level insecticide use
and infant mortality occurred in the 40-year period from 1950 and 1990.
Further, a dose response per kilogram of a ‘general’ insecticide does not have much mean-
ing given that I use an aggregate measure of insecticide use: the composition of insecti-
cides by chemical type changed so drastically over time in response to regulation and tech-
nological development as shown in Figure A5—often over the course of a 17-year cicada
treatment life cycle. Such challenges in linking specific insecticide compounds to health
outcomes are further exacerbated by the significant heterogeneity in pest management
practices among apple producers across US geographies. Nevertheless, I revisit these ques-
tions about the implications for pesticide regulation and policy in the Conclusion section.
4 Results
4.1 Insecticides and cicadas
The first analysis examines the relationship between insecticide use and cicada emergence
using Equation 1. The sample is limited to the 25 years from 1992 to 2016 in which county-
level USGS pesticide data exist. Table 3 regresses insecticide use on a cicada dummy and
the cicada dummy interacted with fixed top-decile indicators (top 10th percentile) of apple
intensity.
Models (1) and (4) show the impact of cicada emergence on insecticide use alone. Mod-
els (2)-(3) and (5)-(6) additionally interact cicada emergence with the indicator for ap-
ple acreage and apple production in bushels. Models (4)-(6) replicate the analysis using
log insecticide values, dropping the few counties with no documented insecticide use. Ci-
cada emergence, in itself, is not associated with increased insecticide use except in apple-
intensive counties. These places see an increase in pesticide use in the range of 6 to 7 kg
km−2 , a moderately large effect given that mean county pesticide use is 9 kg km−2 , as seen
in the summary statistics in Appendix Table A1. The log-transformed results imply that
insecticide use increased 13-22% in apple-intensive counties during a cicada event.
17Figure 5 plots the coefficients from Model (3) as an event study with the inclusion of leads
and lags of cicada emergence.17 The sample is limited to cicada-endemic counties (42% of
full sample) in order to assign treatment event time, and the omitted period is the year
before cicada emergence, d = -1. Models with alternate time trends are included for ro-
bustness (state, county, and no trend). The main model is approximated by the following
equation:
4
X
insecticideit = (βd1 cicadai,t+d + βd2 cicadai,t+d ∗ applei ) + αi + γt + states(i) + it (3)
d=−4
Insecticide use increases in the year of cicada emergence. This outcome aligns with the
first prediction of the framework in Figure 4 in which farmers apply insecticides primarily
to control the adult egg-laying population in the year of emergence. And given that cicada
emergence is anticipated, any small uptick in insecticide use in the year prior could reflect
pre-spaying to kill nymphs before the emergence (Cahoon and Danoho 1982).
As falsification tests, Appendix Table A2 shows that only insecticide use responds to ci-
cada emergence in apple-intensive counties, while herbicide and fungicide use do not ap-
pear to change. This provides assurance that any resulting health impacts are attributable
to insecticides and not a more general change in agricultural practices. Appendix Table A3
provides evidence that cicada emergence is not associated with increased insecticide use in
agriculturally-intensive places containing a high proportion of soy and corn, which aligns
with the fact that farmers understand that cicadas damage woody plants and not herba-
ceous row crops.
A similar insecticide response occurs using an aggregate measure of fruit tree production.
However, fruit trees, which encompass a wide array of woody plants (including berries)
with varying management practices, are less consistently measured across states and over
time in the USDA census. As discussed in the Data section, apples are the historically-
dominant tree crop in the US and production is well-distributed across the country: among
the 247 counties in the top decile of apple producers in the eastern half of the US, 27 states
have at least one major producer, as visualized in Figure 3. In addition, much of the agro-
nomic and ecological literature focuses on the effect of cicadas on apple trees. It is also
worth noting that the insecticide response is not clear when using a continuous measure of
apple production instead of an indicator for top producers. As additional robustness, anal-
17
Leads and lags are limited to four years to reduce distortion of the event study from the fact that many
counties receive more than one cicada brood, as seen in the national distribution map in Figure 3 and in
Virginia specifically in Appendix Figure A7.
18yses are conducted using utilizing satellite-derived tree crop measures from the recently-
developed Cropland Data Layer in Table A8 in the the Spatial Extensions section.
4.2 Cicadas and infant mortality
The primary analysis of this paper uses the model specified in Equation 2. Given the link
established between cicada emergence and insecticide use, one would expect a relationship
between cicada emergence and infant mortality in apple-intensive areas if insecticides in-
deed have an impact on health. Compared to the regressions using insecticide data, this
analysis allows for the use of a much longer time series. ICPSR starts tracking resident in-
fant mortality at the county level in 1941, while USGS pesticide data are only available
from 1992 to 2016, as visualized in Figure 1. The sample is restricted to after 1950 to en-
compass the post-war period when farmers used synthetic pesticides en masse.
The main results are included in Table 1, which regresses next-year infant mortality on ci-
cada emergence.18 Model (1) shows no significant impact of cicada emergence, in itself, on
birth outcomes. Model (2) interacts cicada emergence with county apple acreage. Model
(3) interacts cicada emergence with a dummy for high apple production (i.e., top decile
counties). Models (4) and (5) use county area normalized apple production in bushels in
1964 and 1997, respectively, the years in which apple data in the agricultural census is the
most extensive. All standard errors are clustered at the state-level, which is the adminis-
trative level at which birth records are collected and aggregated. General results hold if
standard errors are clustered at other geographic levels.
For interpretation, top decile apple counties see an increase in next-year infant mortality
of 0.31 deaths per thousand. In terms of apple production levels, a one standard deviation
in production on a cross-county basis is equal to 167 bushels km−2 in 1964 and 225 bushels
km−2 in 1997 (the analyses use 1,000s of bushels as units). Therefore, a one standard de-
viation increase in county apple production, when accompanied by cicada emergence, is
associated with an increase in infant mortality of about 0.1 deaths per thousand, or 1.7%
over current levels.
Appendix Table A4 restricts the sample to the period from 1950 to 1988, allowing for a
18
In the main specification, counties with less than five births in a given year are dropped to minimize
the inclusion of unreasonably high infant mortality rates due to small sample size (i.e., if there are two
births in a county, and one death, IMR is 500 compared to the current US average of 6). Results are
robust to varying the birth cutoff threshold, and Table A5 shows similar results weighting the regres-
sion by county births to allow for observations with less than five births. However, this model is not
preferred given that lack of intensive apple production in populous, urban counties.
19more balanced panel. As discussed in the Data section, the ICPSR infant mortality data
are limited after 1988 to counties with populations over 100,000, while the infant mor-
tality rates derived from restricted NCHS Infant Linked Birth/Death files are not avail-
able until 1995. Using this earlier time periods, the coefficients are about 20-25% larger.
Appendix Table A7 shows results after log-transforming the dependent variable, and Ta-
ble A6 employs other compilations of county-level infant mortality rates derived from re-
stricted NCHS data, ICPSR, and IPUMS. The resulting coefficients are of very similar
magnitude.
Figure 6 plots the cicada-apple interaction coefficients from Model (5) of Table 1 with the
inclusion of cicada emergence leads and lags in the same way as Equation 3:
4
X
imri,t+1 = (βd1 cicadai,t+d + βd2 cicadai,t+d ∗ applei ) + αi + γt + states(i) + it (4)
d=−4
Infant mortality increases in the year following cicada emergence. Similar patterns are pro-
duced in Appendix Figure A11 which plots the event study coefficients using county-level
apple acreage as an alternate measure of apple intensity. These results align with the sec-
ond prediction of the framework in Figure 4 and the coefficient plot in Figure 5, which
shows an increase in pesticide use by tree growers in the year of cicada emergence. The
increase in next-year infant mortality would follow from insecticide exposure among first
trimester pregnancies during cicada emergence. Effect timing is discussed in the next sec-
tion.
For the sake of brevity, the analyses that follow will use the continuous measure of ap-
ples intensity in terms of bushels of production in 1997 as the primary interaction term,
as in Model (5) of Table 1. Orchards are a long-term investment with an asset value over
multiple decades, so it is not surprising that 70% of counties in the top apple production
decile in 1964 remained there in 1997. Further, the correlation in county-level production
in bushels between 1964 and 1997 is 0.83, which is quite high during a time of significant
agricultural change in the US.
4.3 Timing and sub-annual impacts
I next assess the impact on infant mortality by quarter. This analysis is limited to the pe-
riod from 1995 to 2016 when Linked Infant Birth/Death Files are available that allow for
sub-annual aggregation. In the annual analysis in Table A6, Model (4) shows an overall
positive but less precise effect during this subset of years, and one in line with the esti-
20mates from the longer-duration analyses in Models (1)-(3). Looking sub-annually, Figure 7
shows that the effect is concentrated in period 6, which is the second quarter (April to
June) of the year following cicada emergence.
Cicadas arrive in the late spring and insecticide spraying starts in June to control the
adult population from laying their eggs in tree branches as well as throughout the summer
to prevent cicada nymphs from establishing in the soil in order to mitigate detrimental
growth effects (Hamilton 1961; Lloyd and White 1987). The first trimester of pregnancy
is a high risk period for pollution exposure (Almond and Currie 2011). Summer concep-
tions occurring in June, July, or August, for example, would entail a first trimester coin-
ciding with a period of high potential for insecticide exposure. Assuming full-term ges-
tation, such births would occur the following March, April, or May, respectively. The ele-
vated infant mortality in the second quarter (April to June) lines up with this first trimester-
exposed cohort considering that two-thirds of infant deaths occur within the neonatal
phase (i.e., first 28 days after birth), and much of the remaining deaths occur within the
first three months of life (Ely and Hoyert 2018).
These sub-annual results further support the predictions of the framework in Figure 4 and
align with known cicada behavior and orchard management practices. Going forward, I
focus on annual impacts given the longer time series and the lack of sub-annual data for
most other historical variables.
4.4 Brood analysis
The next section assesses impacts by individual cicada brood. This specification involves
a difference-in-difference where the same counties are treated every 17 years. Neighboring
counties that do not receive that cicada brood are used as a control. Table 2 shows the
results for the largest of the five 17-year broods. Excluded are the two primary 13-year
southern broods which are located in hotter areas with very little apple production, as vi-
sualized in Figure 3 and Figure A13.19
For comparison, Model (1) pools all the broods as done in the primary specification in
Model (5) of Table 1. The remaining columns show a consistently positive effect for each
brood in which apple-intensive counties experience higher infant mortality in the year fol-
lowing a cicada emergence. Figure 8 plots the leading and lagging coefficients as done in
Figure 6 but includes neighboring counties as a control group. Each brood involves a dif-
19
13-year broods may also have different physiological mechanisms governing their development (White
and Lloyd 1975).
21You can also read