Risk Review 2022 - FEDERAL DEPOSIT INSURANCE CORPORATION - FDIC
←
→
Page content transcription
If your browser does not render page correctly, please read the page content below
FEDER AL DEPOSIT INSUR ANCE CORPOR ATION

Risk Review
2022

                               www.fdic.gov
2022
Risk Review
PAGE INTENTIONALLY LEFT BLANK
Table of Contents
Introduction .............................................................................................................................. 1

Section I: Executive Summary ..................................................................................................... 3
            Key Risks to Banks........................................................................................................................ 4

Section II: Economic, Financial Markets, and Banking Industry Overview........................................ 7
            Economy ..................................................................................................................................... 7
            Financial Markets........................................................................................................................11
            Banking Industry ........................................................................................................................15

Section III: Key Risk to Banks .................................................................................................... 19
      Credit Risk....................................................................................................................................... 19

            Agriculture .................................................................................................................................19
            Commercial Real Estate ...............................................................................................................24
            Consumer Debt ...........................................................................................................................29
            Energy .......................................................................................................................................33
            Housing .....................................................................................................................................37
            Leveraged Lending and Corporate Debt.........................................................................................42
            Nonbank Lending........................................................................................................................46
            Small Business Lending ...............................................................................................................48

      Market Risk ..................................................................................................................................... 52

            Interest Rate Risk and Net Interest Margin.....................................................................................52
            Liquidity and Deposits .................................................................................................................56

      Operational Risk .............................................................................................................................. 59

            Cyber Threats and Illicit Activities.................................................................................................59

      Climate-Related Financial Risk.......................................................................................................... 64

            Climate-Related Events ...............................................................................................................64

Acronyms and Abbreviations..................................................................................................... 69

Glossary of Terms..................................................................................................................... 71

                                                                                                                                2022 Risk Review | V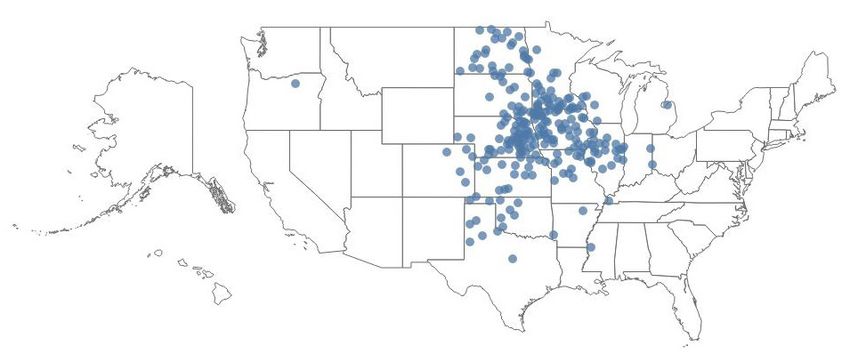
PAGE INTENTIONALLY LEFT BLANK

VI | 2022 Risk Review
Introduction
The FDIC was created in 1933 to maintain stability and                                  consumer debt, energy, housing, leveraged lending and
public confidence in the nation’s financial system. A key                               corporate debt, nonbank lending, and small business
part of accomplishing this mission is the FDIC’s work to                                lending. The market risk areas discussed are interest rate
identify and analyze risks that could affect banks. The                                 risk and net interest margin, and liquidity and deposits.
Risk Review summarizes the FDIC’s assessment of risks
related to conditions in the U.S. economy, financial                                    The 2022 Risk Review expands coverage of risks from
markets, and the banking industry. The analysis of the                                  prior reports by examining operational risk to banks
banking industry pays particular attention to risks that                                from cyber threats and illicit activity and climate-related
may affect community banks. As the primary federal                                      financial risks to banking organizations. Monitoring
regulator for most community banks, the FDIC has a                                      these risks is among the FDIC’s top priorities.
unique perspective on these institutions.
                                                                                        Section I is an executive summary. Section II is an
The Risk Review presents key risks to banks in four                                     overview of economic, financial market, and banking
broad categories—credit risk, market risk, operational                                  industry conditions. Section III is an analysis of the key
risk, and climate-related financial risk. The credit risk                               credit, market, operational, and climate-related financial
areas discussed are agriculture, commercial real estate,                                risks facing banks.1

1
    This report contains banking information available as of December 31, 2021, with updates reflecting more recent market developments as of April 1, 2022.

                                                                                                                                           2022 Risk Review | 1
PAGE INTENTIONALLY LEFT BLANK 2 | 2022 Risk Review
Section I: Executive Summary
The banking environment improved in 2021 as the            and corporate debt issuance remained strong amid
U.S. economy recovered from a severe recession in          low interest rates. Issuance of high-yield bonds and
2020. The U.S. economy expanded in 2021, surpassing        leveraged loans reached record highs. Equity markets
the pre-pandemic output peak in second quarter.            rose and Treasury yields edged higher on economic and
However, the recovery was uneven across industries         monetary policy developments. But financial market
and regions. Labor markets improved, but labor-force       conditions deteriorated in early 2022 when tensions
participation rates remained weak and signs of labor       between Russia and Ukraine intensified.
shortages emerged in key industries. Global supply
chain disruptions contributed to substantially higher      Banking sector profitability increased in 2021 as
inflation, pressuring consumer budgets and business        expenses declined and noninterest income rose.
costs. Economic growth slowed during the second half       Banks reported substantially higher net income in 2021
of the year, in part due to the expiration of government   primarily due to lower credit loss provisions. Net interest
programs that supported consumers and businesses.          income for the industry improved in the second half of
Most baseline forecasts call for a modest deceleration     2021 but remained below the 2020 level. Asset growth
in U.S. economic growth in 2022 from the effects of        was concentrated in cash, interest-bearing balances, and
higher inflation and increased geopolitical uncertainty    securities, while loan growth remained weak. Stronger
following Russia’s invasion of Ukraine.                    economic conditions helped support the improvement
                                                           in asset quality during the year. Among community
Financial market conditions were generally                 banks, net income rose and surpassed the pre-pandemic
supportive of the economy and banking industry in          level in 2021, even as net interest income declined.
2021. Corporate credit conditions remained favorable

                                                                                                2022 Risk Review | 3
Key Risks to Banks
Credit Risks: Credit conditions improved in 2021, Bank consumer loan balances grew in 2021, led
helped by various government support programs by auto loans and other non-credit card consumer
for businesses and consumers, improving economic loans. Asset quality across all consumer loan
conditions, and supportive financial market categories improved. Community banks reported
conditions. lower noncurrent rates than noncommunity
banks for auto loans and credit card loans and
• Agriculture: The agricultural sector had a strong higher noncurrent rates for other non-credit card
year in 2021. The sector benefited from higher consumer loans. Despite general improvements
commodity prices, farm incomes, and farmland in 2021, consumer loans remain sensitive to
values that helped support agricultural loans pandemic developments and could be a source of
held by the banking industry, particularly farm risk for the banking industry.
banks. Farm banks are defined as community
banks with substantial exposure to the agricultural • Energy: The energy market rebounded in 2021,
sector. Profitability of farm banks remained supporting energy lending conditions. Strong
favorable despite weak loan demand and margin global oil consumption and limited production
compression. Asset quality among farm banks contributed to higher oil prices in 2021, but U.S.
improved in 2021, as loan repayments increased oil production was slow to return to pre-pandemic
and loan extensions declined. Despite the current levels. The recovery of mining employment in
strength, rising production costs and supply chain energy-concentrated states was sluggish, and U.S.
problems that affect the agriculture sector may crude oil production did not increase until mid-
pose challenges to the banking sector in 2022. The year as the market drew down existing inventory.
conflict between Russia and Ukraine has created Direct bank lending to oil and gas (O&G) firms
uncertainty about the prospects for exports of key declined in 2021, as the energy market relied
agricultural commodities. more on corporate debt markets for funding.
Although community banks have limited direct
• Commercial Real Estate: The commercial real exposure to O&G firms, community banks that
estate (CRE) sector was generally resilient to operate in energy-concentrated markets are
pandemic developments during the year, and most exposed indirectly through their lending to
property types rebounded from the initial setback consumers and businesses that rely on the energy
in 2020. Industrial and multifamily properties sector. Increased geopolitical uncertainty has
performed relatively well, while office and some contributed to higher energy prices in early 2022.
lodging and retail subtypes continued to struggle. Russia’s invasion into Ukraine raises prospects
The banking industry reported record high CRE for a significant global energy supply shock and
loans in fourth quarter 2021, and community increased market volatility. The conflict could also
banks remain heavily involved in lending to this reshape energy policy and planning.
industry. While CRE asset quality remained strong,
expiration of pandemic-related financial assistance • Housing: The housing market continued to
and shifts in the market demand for CRE properties strengthen during the year, supporting mortgage
may affect future performance. lending. Home price growth set a new record in
2021 driven by strong demand, limited inventory
• Consumer Debt: Consumer incomes and balance of homes for sale, and low mortgage rates.
sheets remained strong during the year and Asset quality among bank residential mortgage
supported consumer lending. Pandemic-related portfolios improved, helped by continued
fiscal support programs boosted personal income government support and forbearance programs.
in 2021 and lowered household debt burdens. Banks reported lower mortgage delinquency
4 | 2022 Risk Reviewrates, with community banks reporting lower second half of the year. Excluding PPP loans, small
delinquency rates than noncommunity banks. business commercial and industrial lending grew,
Mortgage lending by nonbank financial institutions especially among community banks. Despite
continued to grow and outpaced bank lending. the improvements in small business conditions,
While housing market conditions were favorable small businesses remain vulnerable to pandemic
in 2021 and supported mortgage asset quality, developments that may threaten asset quality.
headwinds including increased mortgage rates
from near-record lows may challenge the sector’s Market Risks: Market risks remain moderate overall.
momentum. Low interest rates continue to challenge net interest
margins and banking sector profitability. Liquidity
• Leveraged Lending and Corporate Debt: levels in the banking industry remained strong and
Corporate debt market conditions remained were supported by historically high levels of deposits
relatively stable in 2021 and corporate debt levels and bank reserves.
continued to grow. Banking sector exposure to
the corporate debt market is generally through • Interest Rate Risk and Net Interest Margins: Low
holdings of corporate debt and collateralized loan interest rates and excess liquidity continued to
obligations, lines of credit to corporations, and reduce bank net interest margins (NIMs), which fell
participation in the arranging of leveraged loans to a record low in 2021. Banks sought to increase
and corporate bonds. Banks remain vulnerable to interest income by holding more long-term
potential distress in the corporate debt markets, securities. Community banks invested in longer
particularly if interest rates rise and challenge maturing assets with higher yields, which helped
the financial conditions of highly leveraged bolster NIMs compared to noncommunity banks.
corporations. While community banks generally While higher interest rates could benefit banking
have limited direct exposure to the corporate debt industry interest income, they could be a source of
market, the banking industry remains vulnerable risk for banks with substantial exposure to longer-
to adverse corporate debt market developments. term assets.
• Nonbank Lending: Bank lending to nonbank • Liquidity and Deposits: In 2021, banking sector
financial institutions reached a record high in deposits, including deposits held by community
2021. Nonbank lending activity is concentrated banks, reached the highest level since data
in the largest banks; community banks have collection began in 1984. The growth in deposits
limited exposure. While the risks of bank lending resulted in high levels of cash on bank balance
to nonbank financial institutions is relatively sheets while lending growth remained slow,
moderate, lending to nonbank institutions exposes contributing to higher levels of liquid assets. As
banks to broader risks from the financial system. liquid assets grew, banks reduced their reliance on
wholesale funding. These conditions will continue
• Small Business Lending: Small business to support bank balance sheets as the banking
conditions improved during the year, helped by industry and economy recover from the pandemic.
improving economic conditions, a rebound in
consumer spending, and continued government Operational Risks: Operational risks, including
support, particularly the Paycheck Protection cybersecurity risks and risks related to illicit financial
Program (PPP). Small business loans remained activity, remain elevated for the banking sector.
a large share of the community bank loan
• The number of ransomware attacks in the
portfolio, and community banks remained
banking industry increased in 2021, and banks
active participants in the PPP program in 2021.
continued to discover vulnerabilities to their
However, aggregate small business loan growth
software and computer networks. The number and
declined in 2021 when the PPP ended in the
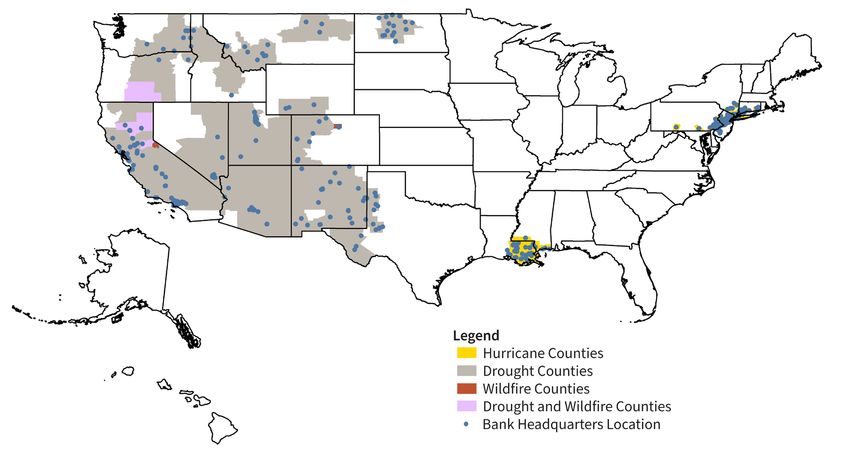
2022 Risk Review | 5sophistication of cyber attacks also increased with related events resulted in $145 billion in damages,
remote work and greater use of digital banking the third most-costly year since 1980. Two
tools. Moreover, threats from illicit activities hurricanes, several wildfires, and a serious drought
continue to pose risk management challenges to affected many local communities and the banks
banks. that operate there. Severe climate-related events
can disrupt local economic conditions and present
Climate-Related Financial Risk: The effects of climate risk across the banking industry, regardless of an
change present emerging risks to the banking institution’s size, complexity, or business model.
industry. This discussion of climate-related financial risks
focuses only on physical risks to communities and
• Climate-related financial risks include physical
banks from severe climate-related events in 2021,
risks from harm to people and property and
as transition risk is a longer-term, prospective
transition risks from the shifts in policy, sentiment,
risk that is beyond the scope of this retrospective
and technology associated with a transition toward
review.
reduced carbon reliance. In 2021, severe climate-
6 | 2022 Risk ReviewSection II: Economic, Financial
Markets, and Banking Industry
Overview
Economy
• The U.S. economy expanded in 2021, surpassing the pre-pandemic output peak in second quarter, as an uneven
recovery continued across industries and regions.
• Labor markets strengthened as the unemployment rate fell. But labor shortages surfaced in key industries and
labor force participation rates remained low.
• Inflationary pressures and supply chain issues increased in the second half of the year, creating challenges for
businesses and posing risks to banks.
• The expiration of government programs that supported consumers and businesses was a headwind to
economic growth in the second half of 2021.
• Reduced assistance to consumer and business borrowers, prolonged pandemic conditions, and higher inflation
may create increased risks for banks.
The economic recovery continued in 2021, and output Chart 1
surpassed the previous peak in the second quarter.
Gross Domestic Product Expanded in 2021 in Spite
The economy expanded in each quarter in 2021, building of the Pandemic
off strong growth in the second half of 2020 after a
Real U.S. Gross Domestic Product
deep recession brought on by the COVID-19 pandemic
Quarterly percent change at annual rate
(Chart 1). Real gross domestic product (GDP) increased 40
5.7 percent in 2021 after decreasing 3.4 percent in 2020. 30
The pandemic continued to affect the rate of recovery
20
in 2021. The rollout of vaccines in the spring supported
10
economic growth, boosted consumer sentiment, and
0
allowed for the lifting of some restrictions on activity.
Government assistance in the form of forgivable loans -10
to businesses through the PPP and increased social -20
benefits to households was a tailwind to the economy -30
in 2021. The economic recovery and broader reopening -40
that occurred during the summer months led to strong 2013 2014 2015 2016 2017 2018 2019 2020 2021
consumer spending (Chart 2). However, GDP growth Source: Bureau of Economic Analysis (Haver Analytics).
Note: Shaded area indicates recession.
slowed in the third quarter with the resurgence of the
pandemic and as government assistance programs
2022 Risk Review | 7expired. Economic growth accelerated in the fourth Individual states and industries have faced an uneven
quarter as inventory accumulation and renewed economic recovery as the pandemic continued to
consumer spending led gains. weigh on business operations. Factors that affected
particular industries and the speed of reopening at the
Federal supplemental unemployment insurance, which state and local level continued to weigh on the recovery
had supported people who were unemployed due to the in 2021. States with a higher share of populations and
pandemic and covered jobs that were not traditionally industries most affected by the pandemic, such as
eligible, ended in September. While GDP growth leisure and hospitality, were slower to recover (Map 1).
improved in fourth quarter on inventory accumulation
and renewed consumer spending, the resurgence of the
Chart 2
pandemic at year-end weighed on economic activity and
sentiment. Consumer Spending Drove Economic Growth in the
First Half of 2021 but Slowed in the Second Half
The unemployment rate fell from 6.4 percent in January Contribution to Change in Gross Domestic Product
to 3.9 percent in December, as labor markets recovered Percent
Consumption
12
more quickly than expected. However, increased Business Investment
10 Government
economic activity nationwide led to a strong demand Exports
for workers and a subdued labor force led to a shortage 8 Imports
of workers. Job openings increased across industries, 6
reaching record levels since data collection began in 4
2000. Wages increased faster than in previous years as 2
firms offered more pay to attract workers. The labor force 0
participation rate ended the year up from its pandemic
-2
lows but still 1.5 percentage points below the February
-4
2020 level. The labor force participation rate remained Q1 Q2 Q3 Q4
low for workers aged 65 or more and women aged 25 to
Source: Bureau of Economic Analysis (Haver Analytics).
54, while participation improved for other groups.
Note: Data are for 2021.
Map 1
The Recovery in Jobs Lost Has Been Uneven Across States
Percentage of Jobs That Were Lost Between March and April 2020 That Were Recovered as of December 2021
89
71 75
58 100 62
76 74 81
121 76 63 78
82 80
52 81
75 75
80 78
79 89 77
71 91 79
72 143 81
89 82 79
78 86 82 47
92
93
104 71 Share of Jobs Recovered
46 67 93 89
91 88 97 Top 5
Above Nationwide Average
106
58 Below Nationwide Average
92 Bottom 5
National Average: 84 percent
Source: Bureau of Labor Statistics (Haver Analytics).
Note: Among the Bottom 5 is Washington, D.C., which has recovered 47 percent of jobs lost.
8 | 2022 Risk ReviewSupply chain challenges surfaced early in 2021 in broader segments of the economy, including food
and worsened over much of the year as pandemic and shelter. Tight labor markets and the inability of
conditions altered demand and affected production. businesses to hire workers in key sectors, including
Consumer spending on both durable and nondurable restaurants and leisure, led to faster wage growth.
goods was strong throughout 2021. As sentiment The headline CPI inflation rate rose to 7.0 percent in
rebounded, demand outstripped supply and global December, the highest rate since the early 1980s.
supply chains were constrained by the ongoing
pandemic. The global shortage in semiconductor Government support programs that helped boost
processors continued, increasing production times for economic activity in 2021 waned during the second
a range of durable goods including automobiles. Delays half of 2021 and monetary policy tightened.
and backlogs at ports due to a shortage of workers Government pandemic-related support enacted in 2020
and other factors increased shipping times and cost continued in 2021. Additional rounds of support through
of transportation, adding to supply chain challenges. the American Rescue Plan, passed in March 2021,
After dropping sharply in 2020, manufacturing activity provided direct payments to households, enhanced
recovered in 2021 despite supply chain challenges. unemployment insurance, and additional funding
for small business loans. Enhanced unemployment
Inflationary pressures increased in the second half insurance ended in September, though some states
of the year as strong demand and supply chain ended it earlier on the strength of labor markets.
challenges reduced the availability of goods and Relative to its effect on GDP in previous quarters, direct
increased costs. Both the headline consumer price government support was less of a boost to growth in the
index (CPI), a measure of overall inflation in the United second half of 2021. By the end of 2021, 80 percent of
States, and core CPI, which excludes more volatile food PPP loans had been fully or partially forgiven.
and energy prices, increased rapidly in the second half of
2021 (Chart 3). Increasing price pressures first emerged The Federal Reserve continued to conduct
in industries most affected by the pandemic, including accommodative monetary policy to support the
travel and used automobiles. As the recovery progressed economy through asset purchases and left the federal
and producer prices remained elevated, inflation rose funds rate unchanged in 2021. Near the end of the year,
as the labor market tightened and inflation rose, the
Chart 3
Both the Headline and Core Consumer Price Index Reached Multi-Decade
Highs
Year-Over-Year Percent Change
7
6 CPI Core CPI
5
4
3
2
1
0
-1
-2
-3
2000 2002 2004 2006 2008 2010 2012 2014 2016 2018 2020
Source: Bureau of Labor Statistics (Haver Analytics).
Note: Shaded areas indicate recession. CPI measures average change over time in prices consumers pay for a basket
of goods and services. Core CPI excludes more volatile components, including food and energy.
2022 Risk Review | 9Federal Reserve tightened monetary policy by reducing Continued inflationary pressures also pose risks to
the pace of monthly net asset purchases. In addition, some lenders. Economic conditions remain uncertain
as financial conditions normalized in 2021, the Federal and vary greatly across sectors and geographies.
Reserve stopped extending credit through its pandemic- The outlook for banks should improve with overall
era lending facilities. economic conditions as supply chain pressures abate
and demand normalizes, but banks face downside
Reduced assistance to borrowers and prolonged risks from inflation or slower-than-expected economic
pandemic conditions may create credit risk for banks. growth. Higher inflation may pose credit risk to banks
Improvement in the labor market and government if it limits the ability of borrowers to stay current on
assistance programs supported both businesses and loans, particularly if borrower incomes do not rise and
consumer credit conditions and increased the demand business sales decline as consumers reduce spending.
for loans. The curtailment of federal assistance may Higher inflation also leads to higher nominal interest
make it challenging for some borrowers to stay current rates, which affect both assets and liabilities on a bank’s
on loans, particularly if their savings run out. In addition, balance sheet. Traditionally, the liabilities on a bank’s
banks with lending exposure to industries vulnerable to balance sheet tend to reprice more quickly than longer-
the pandemic may face asset quality deterioration after term assets, which can weigh on NIMs and expose banks
government support programs end. to increasing pressure from interest rate risk, particularly
those that issued longer-term loans in search of higher
yields, as discussed later in this report.
10 | 2022 Risk ReviewFinancial Markets
• In 2021, the focus of financial markets gradually shifted from the pandemic to inflation. Market conditions
deteriorated in early 2022 upon heightened geopolitical risks.
• Bank reserves held at the Federal Reserve reached an all-time high in December 2021 due to Federal Reserve
asset purchases and a steep decline in Treasury cash balances. Corporate credit conditions remained
favorable. Corporations took advantage of low interest rates in 2021 by borrowing more in capital markets,
issuing a record amount of high-yield bonds and leveraged loans.
• Banking sector risks from financial markets moderated in 2021. While financial market conditions deteriorated
in early 2022, funding conditions remained generally favorable.
In 2021, the focus of financial markets gradually prices declined for leveraged loans and equities, among
shifted from the pandemic to inflation. In early 2021, other assets. Financial market activities declined,
market movements reflected anticipation of the effects with lower corporate bond issuance, municipal bond
of a reopening of the economy, as much of the U.S. issuance, and initial public offerings in equity markets.
population began to receive vaccinations. In later
months, a resurgence of the pandemic dampened the Treasury yield curve shifts in 2021 reflected
outlook, and inflationary pressures increased owing to an improving economy and monetary policy
supply chain issues and stronger consumer spending. developments. Early in 2021, the U.S. Treasury yield
While markets reacted negatively to the prevalence of curve steepened as expectations grew for the economy
new COVID-19 variants, by year-end market participants to reopen. The two-year Treasury yield remained below
showed more concern about higher inflation and the 20 basis points for the first five months of the year, as
effect on the outlook for interest rates and the economy. market participants generally expected that pandemic-
related inflation would be temporary (Chart 4). On
Financial market conditions deteriorated in early 2022 the longer end of the curve, ten-year Treasury yields
when tensions between Russia and Ukraine intensified. increased more than 80 basis points in the first three
Commodity prices increased and inflation expectations months of the year, from 0.93 percent on December 31,
rose further. Corporate bond spreads widened and 2020, to 1.74 percent on March 31, 2021.
Chart 4
The Spread Between the Ten-Year and Two-Year Treasury Yields Narrowed
as the Year Ended, Flattening the Yield Curve
Yield
Percent
2.0
1.8 Ten-Year Treasury Yield
1.6
1.4
1.2
1.0 The ten-year Treasury yield increased The two-year Treasury yield
by more than 80 basis points ended the year on an
0.8 in the first three months of 2021. upward trajectory.
0.6
0.4
Two-Year Treasury Yield
0.2
0.0
Jan-2021 Mar-2021 May-2021 Jul-2021 Sep-2021 Nov-2021 Jan-2022
Source: Federal Reserve Board (Federal Reserve Economic Data).
2022 Risk Review | 11Toward the end of 2021, medium-term interest rates, The Secured Overnight Funding Rate (SOFR), a broad
such as the two-year and five-year, rose as the Federal repurchase agreement (repo) benchmark and the
Reserve shifted its monetary policy stance. The Federal Federal Reserve’s preferred replacement for the London
Reserve reduced the pace of its asset purchases in Interbank Offered Rate (LIBOR), fell to 0.01 percent
November 2021 and further reduced the pace in in March (Chart 6). Overnight secured funding rates
subsequent months. These moves increased market continued to hover near zero until the Federal Reserve
expectations for the Federal Reserve to begin raising implemented a technical adjustment in June to lift the
short-term interest rates as early as March 2022. As rate paid on bank deposits at the Federal Reserve and
markets anticipated short-term rate increases, the the rate on its overnight reverse repurchase agreement
two- and five-year Treasury yields increased, and the (ON RRP) facility.
yield curve flattened between the two-year and ten-
year Treasury yields. The flattening of the Treasury Throughout the pandemic, Federal Reserve asset
yield curve also accelerated in early 2022 reflecting purchases resulted in higher bank reserves. The impact
expectations for higher near-term inflation and slower of Federal Reserve asset purchases on bank reserves
economic growth. was mitigated somewhat in 2020 by large increases
in the Treasury General Account (TGA) as the Treasury
Cash in the financial system grew during the year, Department issued debt to market participants,
pushing overnight rates even lower. The growth in cash effectively absorbing some of the liquidity in the
was largely a result of Treasury’s $1.5 trillion drawdown banking system. However, in 2021, the TGA declined as
of cash balances that shifted cash into private markets Treasury security issuance declined and the government
and the Federal Reserve’s continued asset purchases, increased spending, shifting the liquidity into the private
which totaled $1.5 trillion during the year (Chart 5). market. Bank reserve balances rose to an all-time high
The abundance of liquidity put downward pressure on of $4.3 trillion in December 2021. A high level of low-
overnight interest rates. yielding bank reserves can challenge bank earnings.
Chart 5
Federal Reserve Asset Purchases Resulted in Higher Bank Reserves
$ Trillions
10
U.S. Treasury Securities
8 Assets
6 Mortgage-Backed Securities
4 Repurchase Agreements, Swaps,
Credit, and Liquidity Facilities
2
Other Assets
0
Federal Reserve Notes and
2 Other Liabilities
Bank reserve balances reached an Deposits Held by Depository
4
all-time high of $4.3 trillion in mid-December 2021. Institutions (Reserves)
6 Overnight Reverse
Repurchase Agreements
8 Liabilities
U.S. Treasury General Account (TGA)
A steep decline in the TGA
10 contributed to growth in bank reserves.
Jan-20 Apr-20 Jul-20 Oct-20 Jan-21 Apr-21 Jul-21 Oct-21
Source: Board of Governors of the Federal Reserve System H.4.1 Statistical Release.
12 | 2022 Risk ReviewChart 6
Excess Liquidity Kept Overnight Interest Rates Low in 2021
Yield
Percent EFFR
SOFR
0.16
IORB
0.14 OBFR
BGCR
0.12 ON RRP
0.10
0.08
0.06
0.04
0.02
0.00
Jan-2021 Mar-2021 May-2021 Jul-2021 Sep-2021 Nov-2021
Source: Federal Reserve Bank of New York.
Note: IORB=Interest on Reserve Balances Rate. EFFR=Effective Federal Funds Rate. OBFR=Overnight Bank
Funding Rate. SOFR=Secured Overnight Financing Rate. BGCR=Broad General Collateral Rate. See Federal
Reserve Reference Rates at https://www.newyorkfed.org/markets/reference-rates. Data through December
31, 2021.
Corporate credit conditions remained favorable in economic growth lowered perceptions of credit risk,
2021. Corporations took advantage of low interest keeping corporate bond spreads low throughout
rates by borrowing at high levels and issuing a record the year. Higher inflation and expectations for rising
amount of high-yield bonds and leveraged loans. interest rates also encouraged corporate borrowing
Corporate credit spreads were low throughout the as corporations looked to lock in debt at low rates.
year for both investment-grade and high-yield bonds. Corporate bond spreads rose in early 2022 to mid-
Corporations issued $1.96 trillion in corporate bonds, 2020 levels, as geopolitical events reduced market risk
surpassing pre-pandemic levels but trailing the 2020 appetite.
record issuance. Investment-grade issuance declined
20 percent year over year, down from a record level in Like corporations, municipalities took advantage of
2020. High-yield issuance increased 15 percent year over low interest rates by issuing a near-record amount
year to a record-setting $485 billion (Chart 7). of bonds. At $480 billion, municipal bond issuances
for 2021 were slightly below the record-setting 2020
Leveraged loan issuance totaled $615 billion in 2021, level. Most of the municipal bonds issued—$319 billion
surpassing the previous annual record by more than compared with $275 billion in 2020—were to fund
20 percent. Loans funding mergers and acquisitions new capital projects. Borrowing conditions remained
reached a record $331 billion for the year. Demand for favorable for municipalities despite the Federal Reserve
leveraged loans was strong, particularly toward the end reducing its direct support for the municipal bond
of the year when investors sought products with variable market in 2021.3 Government support programs for state
rates to protect against rising interest rates. and local governments and low interest rates propelled
municipal borrowing. Expectations for possible tax
Borrowing conditions remained favorable in 2021, increases encouraged investors to seek municipal bonds
despite the Federal Reserve reducing its direct support that offered tax-exempt interest payments. Taxable
for the corporate bond market.2 Burgeoning signs of bond issuance declined approximately 18 percent over
2
The Federal Reserve ceased purchases of corporate bonds at the end of 2020 and began selling holdings of corporate bond exchange-traded funds in June 2021.
3
The Federal Reserve ceased purchases of municipal bonds at the end of 2020.
2022 Risk Review | 13Chart 7
Borrowing Conditions Were Favorable in 2021 as Corporations Issued
Record Amounts of High-Yield Bonds
Corporate Bond Issuance
$ Trillions
High-yield bond issuance in 2021
2.5 increased by 15 percent from 2020.
2.0
High-Yield
Investment Grade
1.5
1.0
0.5
0.0
2013 2014 2015 2016 2017 2018 2019 2020 2021
Source: Securities Industry and Financial Markets Association.
the past year, while nontaxable bond issuance increased in which the ten-year Treasury yield rose by more than
approximately 8 percent. 80 basis points.
Equity indices performed well in 2021. The Standard Similar to banks, commodities and energy companies
and Poor’s (S&P) 500 Index posted total returns of posted strong gains in 2021. The Bloomberg Commodity
28.7 percent for the year, while the Dow Jones Industrial Index gained 27 percent in 2021, led by 50 percent or
Average returned 20.9 percent and the NASDAQ higher increases in prices for coffee, lumber, heating
Composite returned 22.2 percent. All 11 sectors of the oil, crude oil, and gasoline. The S&P 500 Energy sector
S&P 500 posted double-digit returns, helping the S&P rebounded from the worst-performing sector in 2020 to
500 notch 70 record-high closes and finish with double- the top performer in 2021, with returns of 54.4 percent.
digit gains for the third straight year.
Overall, financial markets were stable in 2021 and
Following an underperformance in 2020, bank stocks market conditions were generally supportive of banking
outperformed the S&P 500 in 2021. The KBW Bank conditions. Conditions deteriorated in early 2022, as
Index, which includes 24 of the largest U.S. banking geopolitical tensions driven by Russia’s invasion of
organizations, had a total return of 36 percent. The Ukraine altered many of the financial market trends
broader S&P 500 Financials sector was the third- observed in 2021. Geopolitical tensions and tightening
best performer of the 11 S&P sectors, with a return financial conditions create a heightened level of
of 34.9 percent in 2021. Bank stock performance uncertainty for the banking sector. While inflation and
in 2021 largely tracked the increase in longer-term rising interest rates come with the risk of asset repricing,
Treasury yields that support bank income. Much of many banks could benefit from easing pressure on net
the outperformance relative to the S&P 500 can be interest margins. However, in the near term, low interest
attributed to the first three months of the year, a period rates and high amounts of liquidity are likely to continue
to pressure bank earnings.
14 | 2022 Risk ReviewBanking Industry
• Banks reported higher net income in 2021 primarily due to negative provision expense.
• NIM decreased, reflecting the low interest rate environment.
• Loan growth improved from 2020 levels, reflecting improved economic sentiment.
• Asset quality metrics continued to improve.
Banks reported higher earnings in 2021 primarily due banks, while lower than the 2020 level, was $1.1 billion
to negative provision expense. Industry net income for for 2021. The average ROA ratio for community banks
2021 rose 89.7 percent ($132.0 billion) from 2020 levels also increased, from 1.09 percent in 2020 to 1.25 percent
to $279.1 billion (Chart 8). The banking industry reported in 2021.
aggregate negative provision expense of $31.0 billion for
2021 as banks reassessed the risk of the pandemic and Despite the negative provision expense for the industry
economic uncertainty on their loan portfolios. Negative in 2021, the allowance for expected credit losses (ACL)
provision expense was significantly less than the positive remained higher than the pre-pandemic level at year-
$132.3 billion in provision expense reported in 2020. end 2019. The ACL as a percentage of total loans and
Similar to the improved earnings, the return on average leases was 1.58 percent, well above the 1.18 percent at
assets (ROA) ratio for the banking industry improved to year-end 2019.
1.23 percent in 2021 from 0.72 percent in 2020.
NIM declined in 2021 despite a slight increase in net
Community bank net income increased 29.3 percent in interest income and strong asset growth. Net interest
2021 to $32.7 billion. The improvement was due to rising income for the industry rose $687 million (0.1 percent)
net interest income in combination with lower provision to $527.4 billion from 2020 but remained below the
expense (Chart 9). Stronger loan growth and recognition pre-pandemic level of $546.7 billion in 2019. Yields on
of deferred PPP loan fees contributed to the rise in earning assets dropped 52 basis points from 2020 to
net interest income. Provision expense for community 2.71 percent, while the cost of funding those assets
Chart 8
Negative Provision Expense Was the Primary Driver of Improved Full-Year
Net Income in 2021
$ Billions
160 $132.0
120
80 $36.1
$20.3 $11.1
40 $0.7
0
-40 -$5.1
-80
-120
-160
-200 -$163.3
-240 +0.1% +7.2% -123.4% +2.2% -63.1% +99.4% +89.7%
Net Interest Noninterest Provisions Noninterest Securities Applicable Net Income
Income Income Expense Gains Income
(Losses) Taxes
Source: FDIC.
Note: Solid bar depicts the item had a negative effect on net income; striped bar depicts the item had a positive
effect. Data reflect full-year 2021 vs full-year 2020 income.
2022 Risk Review | 15Chart 9
Higher Net Interest Income Drove Higher Net Income at Community Banks
$ Billions
10
$6.8 $7.4
5 $3.9
$2.3
$1.0
0
-$0.2
-5
-$6.0
-10 9.3% 4.1% -84.7% 6.5% -20.9% 45.8% 29.3%
Net Interest Noninterest Provisions Noninterest Securities Applicable Net Income
Income Income Expense Gains Income
(Losses) Taxes
Source: FDIC.
Note: Solid bar depicts the item had a negative effect on net income; striped bar depicts the item had a positive
effect. Data reflect full-year 2021 vs full-year 2020 income.
dropped 24 basis points, bringing NIM down from Chart 10
2.82 percent in 2020 to 2.54 percent in 2021 (Chart 10).
Net Interest Margin Continues to Decline Despite an
Community bank net interest income rose by $6.8 billion Increase in Net Interest Income
from 2020, or 9.3 percent, on relatively higher loan Percent
growth and recognition of deferred PPP loan fees. 4.5
Growth in earning assets, however, still outpaced
community bank net interest income gains, reducing 4.0
the NIM. The average community bank NIM fell 12 basis
points to 3.27 percent last year from 2020. Low interest 3.5
rates, slow loan growth, and substantial growth in low-
3.0
yielding assets kept net interest income low. Community Banks NIM
2.5 Industry NIM
Low-yielding assets—cash and balances due from
other institutions—remained high for the industry at 2.0
$3.6 trillion. These assets grew 12 percent or $370 billion 1986 1991 1996 2001 2006 2011 2016 2021
in 2021, well below the substantial growth of $1.5 trillion Source: FDIC.
in 2020. Elevated levels of low-yielding assets will
continue to be a drag on NIM.
Loan balances rose from 2020, but growth in lower-
Improvement in noninterest income further bolstered yielding assets drove balance sheet growth. Loans grew
the rise in net income. Noninterest income for the 3.5 percent in 2021, slightly higher than the 3.3 percent
industry rose $20.3 billion (7.2 percent), outpacing the growth rate in 2020. While growth in 2020 reflected
rise in noninterest expense of $11.1 billion (2.2 percent) about $408 billion in PPP loans added to bank books,
in 2021. Increased bank card and interchange fees 2021 growth reflected $312 billion in PPP loans forgiven
of $8.6 billion and loan servicing fees of $6.6 billion or repaid and removed from bank books. Excluding
contributed most to the higher levels of noninterest PPP loans, the loan growth rate in 2021 would have been
income. Noninterest expense growth was primarily 6.6 percent. Community banks would have recorded a
driven by increases in salaries, which were up 6.1 percent loan growth rate of 7.6 percent excluding PPP versus
or $14.5 billion during the year, and consulting fees, the reported total loan growth rate of 2.0 percent. This
which were up by 47 percent or $2.5 billion. PPP-adjusted community bank loan growth rate was
16 | 2022 Risk Reviewhigher than the industry overall and higher than the Community banks also increased their holdings of
merger-adjusted loan growth rate of 5.5 percent reported assets with maturities over three years, which reached
in fourth quarter 2019. Industry loan growth occurred 52 percent of total assets at year-end 2021.
in most categories, with the largest dollar increases in
loans to nondepository institutions, consumer loans, and Asset quality metrics continued to improve in 2021.
CRE loans. Despite widespread loan growth, loans were Noncurrent loan rates and net charge-off rates declined
less than 50 percent of total assets, 8 percentage points in 2021 to pre-pandemic lows. The noncurrent loan rate
lower than the five-year average from 2014 through 2019. for the industry fell to 0.89 percent at year-end 2021,
Community banks also saw a decline in the ratio of loans below the 1.19 percent reported in 2020 and less than
to assets, from 71 percent at year-end 2019 to 62 percent the pre-pandemic rate of 0.91 percent in 2019 (Chart 13).
at year-end 2021. Noncurrent rates declined across all loan types, with
1–4 family residential loans seeing the greatest decline.
Bank balance sheets continued to hold historically The annual average net charge-off rate for the industry
high levels of safe and liquid assets in 2021. Cash and declined from 0.50 percent to 0.25 percent in 2021. The
balances due from other institutions rose $370 billion, dollar volume of net charge-offs was below the 2020 level
almost as much as loans, in 2021 (Chart 11). With the rise in all loan categories except multifamily and 1–4 family
of medium- and long-term interest rates in 2021, banks construction. However, the decline in ACL exceeded
invested heavily in long-term assets including securities the decline in noncurrent loans in 2021. As a result,
that grew 22 percent to $6.2 trillion and mortgage-backed the reserve coverage ratio for noncurrent loans (ACL as
securities that were up 17 percent to $3.6 trillion. Banks a percentage of noncurrent loans) declined modestly
may have invested in longer-term assets to improve NIMs. from 184 percent in 2020 to 179 percent but remained
well above the pre-pandemic level of 130 percent.
Longer-term assets, those with maturities greater
than three years, increased to 39 percent of assets Community banks also reported improvement in asset
compared with 36 percent pre-pandemic (Chart 12). quality metrics for the year. The noncurrent loan rate of
Eighty-seven percent of banks increased their holdings 0.58 percent for community banks was down 19 basis
of assets with greater than five-year maturities. points from 2020. The noncurrent loan rate declined
Chart 11
Since the Pandemic Began, Most Bank Asset Growth Has Been in Securities
and Cash Accounts
$ Trillions
Gross Loans and Leases
25 Securities
Cash and Due From Balances 11.2%
20 All Other Assets 12.4%
15.0%
13.3% 14.6%
15 8.9% 26.3%
21.4% 23.4%
10
56.4% 49.7% 47.4%
5
0
2019 2020 2021
Source: FDIC.
Note: Bars show total gross loans, securities, cash and due from balances, and all other assets amounts from
bottom to top. Percent of total assets is represented on the bars. 2020 and 2021 do not sum to 100 percent due
to rounding.
2022 Risk Review | 17Chart 12
Assets With Maturities Greater Than Three Years Have Increased to Almost
40 Percent of Total Assets
Percent of Total Assets
45
40 3–5 Years 5–15 Years > 15 Years
35
30
25
20
15
10
5
0
2008 2009 2010 2011 2012 2013 2014 2015 2016 2017 2018 2019 2020 2021
Source: FDIC.
Note: Date labels are centered under the first quarter of each year. Data start in fourth quarter 2007.
Chart 13
Despite Early Concerns at the Onset of the Pandemic, Noncurrent Rates Are
at Low Levels
Noncurrent Rate
Percent
18
16
14 Total Noncurrent Rate
Commercial & Industrial
12 Construction & Development
10 1–4 Family Residential
Nonfarm Nonresidential Real Estate
8
Credit Cards
6
4
2
0
2007 2008 2009 2010 2011 2012 2013 2014 2015 2016 2017 2018 2019 2020 2021
Source: FDIC.
Note: Percent of loans that are 90 days or more past due or in nonaccrual status.
for all major loan portfolios except the commercial and Although banking industry conditions remained
industrial (C&I) portfolio, which saw a modest 5 basis strong, challenges remain. Rising interest rates,
point increase to 0.71 percent. The annual net charge-off continued transition through the pandemic, and
rate declined to 0.09 percent, down 6 basis points from geopolitical tensions may negatively affect bank
2020. profitability, credit quality, and loan growth going
forward. In particular, rising interest rates could
Improvements in the economy were evident in the adversely affect real estate and other asset values and
decline in the number of “problem banks” to 44 at year- borrower repayment capacity.
end 2021 from 56 at year-end 2020. In addition, no banks
failed in 2021 while four failed in 2020.
18 | 2022 Risk ReviewSection III: Key Risk to Banks
CREDIT RISK
Agriculture
• The agricultural sector had a strong year, marked by increases in commodity prices, farm incomes, and
farmland values.
• Profitability of farm banks remained favorable despite weak agricultural loan demand and margin
compression.4
• Asset quality among farm banks improved in 2021 as loan repayments increased and extensions declined.
• Rising production costs and supply chain problems that affect the agricultural sector may pose challenges in 2022.
There were 1,121 farm banks comprising nearly one-quarter of all banks as of fourth quarter 2021. All but
13 of these banks are also considered community banks by the FDIC’s definition (see Glossary of Terms). In
fourth quarter 2021, agricultural loans held by all banks totaled $180.2 billion.
• Community banks hold 69.8 percent ($125.7 billion) of total agricultural loans.
• Nearly 23 percent of farm banks (5.3 percent of all banks) hold a concentration of agricultural loans above
300 percent of capital (tier 1 capital and credit loss reserves for loans and leases).
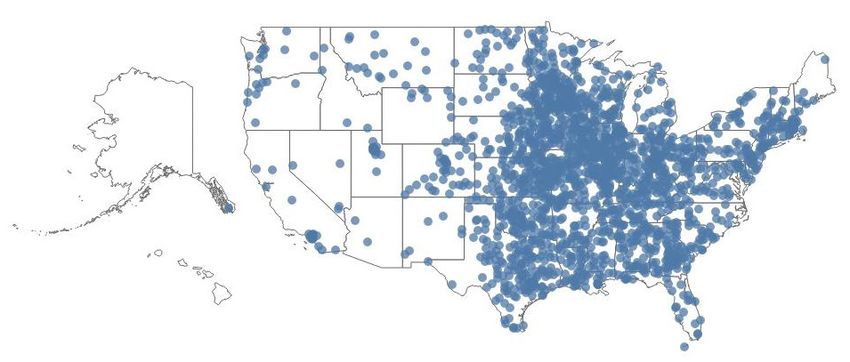
• Exposure to agricultural lending is concentrated in the Midwest.
Regional Exposure to Agricultural Lending
Dots on the map represent the 256 banks with total agricultural loans above 300 percent of capital.
Source: FDIC.
4
Unless otherwise noted, banking data are for farm banks only.
2022 Risk Review | 19The agricultural sector had a strong year as cattle, corn, and dairy set new record highs in 2021; pork
commodity prices and farm incomes rose, pushing reached its second-highest level, only slightly behind
farmland values higher. Net farm income increased by 2020. China remained the leading destination for U.S.
$23.9 billion (25.1 percent) from 2020 to $119.1 billion agricultural exports. In 2021, export volumes to China
in 2021, the highest level since 2013 and well above the increased by 10.6 percent to a record high.7
prior 20-year average in nominal and inflation-adjusted
terms (Chart 14). Higher cash receipts for both crops and Concerns about drought also contributed to higher
livestock were partially offset by higher expenses and a crop prices. During 2021, a large portion of the western
decline in government payments.5 United States and pockets of the Midwest experienced
severe or worse drought conditions for most or all of the
Increased demand helped push many commodity prices year.8 Widespread drought led to concerns surrounding
higher in 2021, surpassing pre-pandemic levels. The crop yields and production totals, which lifted corn,
reopening of the economy spurred increased domestic soybeans, and wheat prices to their highest levels
demand for agricultural products as consumers resumed since at least 2013. Although the drought contributed
dining out, schools returned to in-person classes, to higher crop prices, it hampered the recovery for
and entertainment venues hosted events. Exports of cattle and dairy producers who had to contend with
agricultural products also increased, further bolstering deteriorating grazing conditions and higher feed costs.
commodity prices. In inflation-adjusted dollars, total
agricultural exports in 2021 reached the highest level Higher farm incomes and commodity prices, combined
since reporting began in 1967.6 By volume, exports of with continued low interest rates, contributed to
Chart 14
In 2021 Net Farm Income Reached Its Highest Level Since 2013
$ Billions
Inflation-adjusted
160 Net Farm Income
140 2001–2020 Average
120
100
80
60
40
20
0
2001 2003 2005 2007 2009 2011 2013 2015 2017 2019 2021F
Source: U.S. Department of Agriculture.
Note: Data are annual through 2022. Inflation-adjusted data in 2022 dollars. F= USDA forecast data.
5
In 2021, the USDA forecast that crop and livestock receipts both increased by more than 18 percent, while expenses rose 9.4 percent. Government payments
are forecast to have declined by 40.6 percent. The decline in government payments was primarily driven by a decline in pandemic-related support, which fell by
$15.7 billion, or 66.9 percent. See USDA, 2022 Farm Sector Income Forecast, February 04, 2022, https://www.ers.usda.gov/data-products/farm-income-and-wealth-
statistics/.
6
The USDA Foreign Agricultural Service reported that total 2021 exports in nominal terms had reached $177 billion, 18 percent above 2020. In volume, exports
increased by 2.6 percent over 2020.
7
Export volumes to China in 2021 reached nearly 61 million metric tons and were approximately $33 billion in dollar terms.
8
Some of the most pronounced drought conditions were in California, Montana, North Dakota, and Wyoming; an average of 55 percent or greater of the land area in
each of these states was in severe or worse drought throughout 2021. See National Drought Mitigation Center, University of Nebraska-Lincoln, U.S. Drought Monitor,
https://droughtmonitor.unl.edu/Maps/MapArchive.aspx.
20 | 2022 Risk Reviewstrong demand for farmland, which helped push Strong deposit growth and modest total loan demand
farmland values higher in 2021.9 In August 2021, the contributed to a sharp decline in the median loans-
U.S. Department of Agriculture (USDA) reported that to-assets ratio among farm banks (Chart 15). In fourth
the national average per-acre value of farm real estate quarter 2021, agricultural production loans contracted
had increased 7 percent from one year earlier, the 0.03 percent following a 7.6 percent contraction one
largest year-over-year increase since 2014. Midwestern year earlier. The contraction in loans was consistent
farmland values generally rose more than the rest of the with results from several Federal Reserve Bank surveys
nation. Federal Reserve surveys of agricultural banks that indicated widespread declines in the demand for
during fourth quarter 2021 showed farmland values of non-real estate agricultural loans because of higher farm
Midwestern states increased as much as 31 percent over incomes.11 Contraction in non-real estate agricultural
the prior year.10 loans contributed to a decline in the median agricultural
loan to capital concentration ratio to 213 percent in
Favorable agriculture conditions helped support fourth quarter 2021, its lowest level in 20 years. Looking
profitability of farm banks in 2021. Despite margin ahead, loan demand could get a boost from rising
compression and weak agricultural loan demand, agricultural input costs as farmers may need additional
the median pretax return on assets ratio at farm funding to help with higher operating expenses.
banks improved to 1.30 percent in 2021 compared
with 1.23 percent in 2020. A majority of farm banks Asset quality among farm banks strengthened in 2021.
reported lower loan loss provisions as the credit outlook Agricultural loan past-due rates declined markedly at
improved and net interest income and noninterest farm banks in 2021 (Chart 16). The median agricultural
income increased faster than overhead expenses. loan past-due and nonaccrual loan (PDNA) ratio
decreased to 0.08 percent in fourth quarter 2021 from
0.29 percent a year earlier. Meanwhile, the share of
Chart 15
Strong Deposit Growth at Farm Banks Outpaced Loan Growth
Median Year-Over-Year Growth Median Loans-to-Assets Ratio
Percent Percent
16 75
14 Loans-to-Assets Ratio (Right Axis)
Deposit Growth (Le˜ Axis) 70
12 Loan Growth (Le˜ Axis)
10 65
8
6 60
4
55
2
0 50
2017 2018 2019 2020 2021
Source: FDIC.
Note: Data as of fourth quarter for each year among farm banks. Loans are total loans.
9
Survey data from Federal Reserve Bank districts, including Chicago, Dallas, Kansas City, Minneapolis, and St. Louis, indicate that farmland interest rates were, on
average, 100 basis points lower than the average from 2015 to 2019. See Nathan Kauffman and Ty Kreitman, “Farm Real Estate Values Rise Sharply,” Ag Finance Update,
Federal Reserve Bank of Kansas City, November 23, 2021, https://www.kansascityfed.org/agriculture/agfinance-updates/farm-real-estate-values-rise-sharply/.
10
Cited values are for non-irrigated cropland.
11
Federal Reserve District Agricultural Credit Surveys for Chicago, Kansas City, and Minneapolis Districts, fourth quarter 2021, https://www.kansascityfed.org/
search/?query=Federal%20Reserve%20Ag%20Credit%20Surveys&filter-section=document&sorting=relevant&page-number=1&perpage=10.
2022 Risk Review | 21You can also read