Circuit Reliability Review 2020 - Circuit Reliability ...
←
→
Page content transcription
If your browser does not render page correctly, please read the page content below
Circuit Reliability Review
Death Valley Timbisha Shoshone Tribe

                                       2020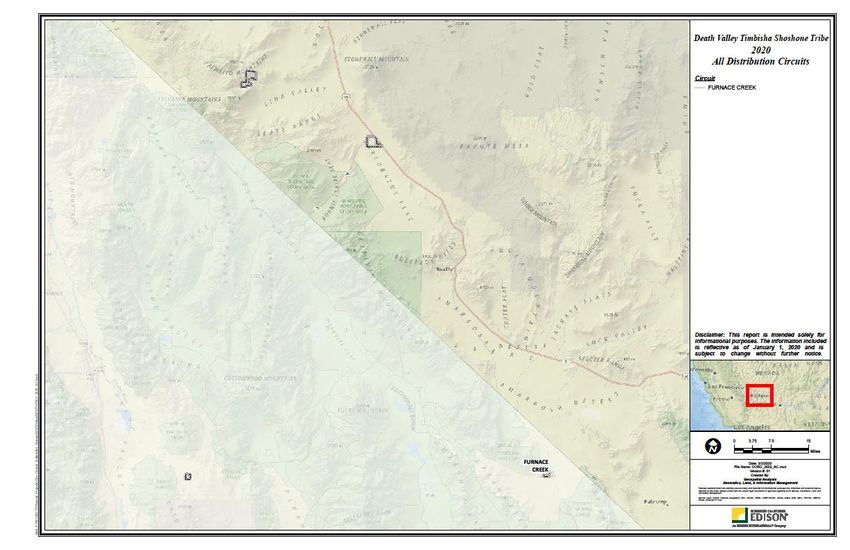
Who We Are

• Southern California Edison (SCE) is
  an Edison International company
• One of the nation’s largest electric
  utilities
• More than 130 years of history
• Headquartered in Rosemead,
  California
• Regulated by the California Public
  Utilities Commission (CPUC) and
  the Federal Energy Regulatory
  Commission (FERC)
• 50,000 square miles of SCE service
  area across Central, Coastal, and
  Southern California
• 15 million residents in service
  territory
• 5 million customer accounts in 445
  cities and communities

                                         2
Our Grid

 To deliver power safely, reliably and affordably, we monitor and maintain a vast electricity
 system.

       50,000 Square Miles

           4,600 Circuits

         1.5 Million Poles

  119,000 Miles of Transmission
      and Distribution Lines

       730,000 Transformers

                                                                                                3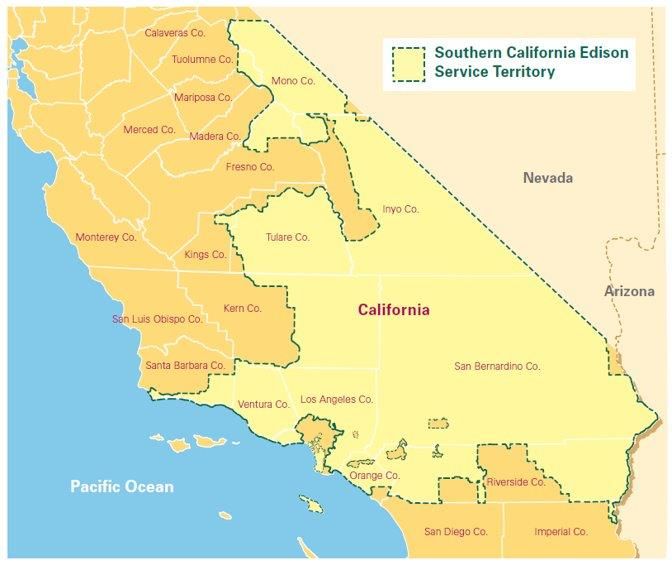
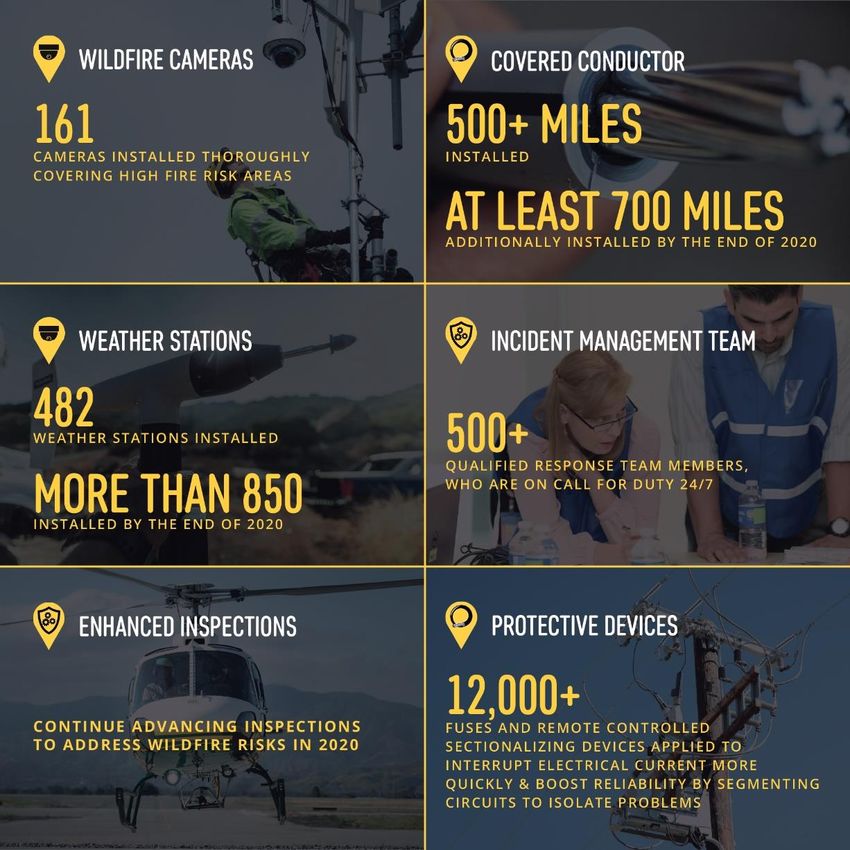
Strengthening and Modernizing the Grid

    SCE plans to spend more than $5B each                 2019 Capital Investments
     year to maintain, improve, and harden
               its infrastructure.                         179 miles of underground cable
                                                                      replaced
•    Infrastructure reliability – updating underground
     cables, poles, switches, and transformers             502 miles of overhead conductor
•    Wildfire mitigation – hardening infrastructure,          replaced for public safety
     bolstering situational awareness capabilities, and
     enhancing operational practices
                                                           16.4k distribution poles replaced
•    Transmission – connecting renewables, installing
     new substations, and updating lines
                                                           4.3k transmission poles replaced
•    Grid readiness – updating the grid for impacts
     from new technologies
                                                              71 underground structure
•    Long-term energy policy – supporting energy
     storage, electric vehicles, and renewables                    replacements

     SCE’s investments support safe, reliable, affordable, and clean energy for our customers

                                                                                                4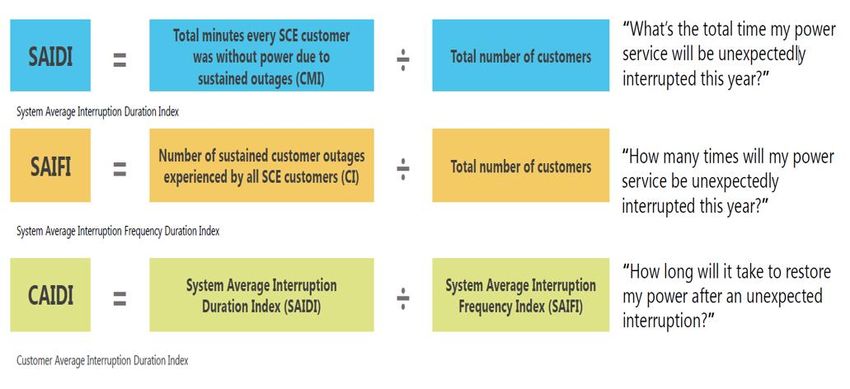
Meeting California’s Climate Change Goals

                 PATHWAY 2045
    SCE’S vision to help California achieve a carbon neutral future

    Carbon neutrality is achieved through deep decarbonization of
       electricity, transportation and building electrification,
                    and the use of low-carbon fuels

                                                                      5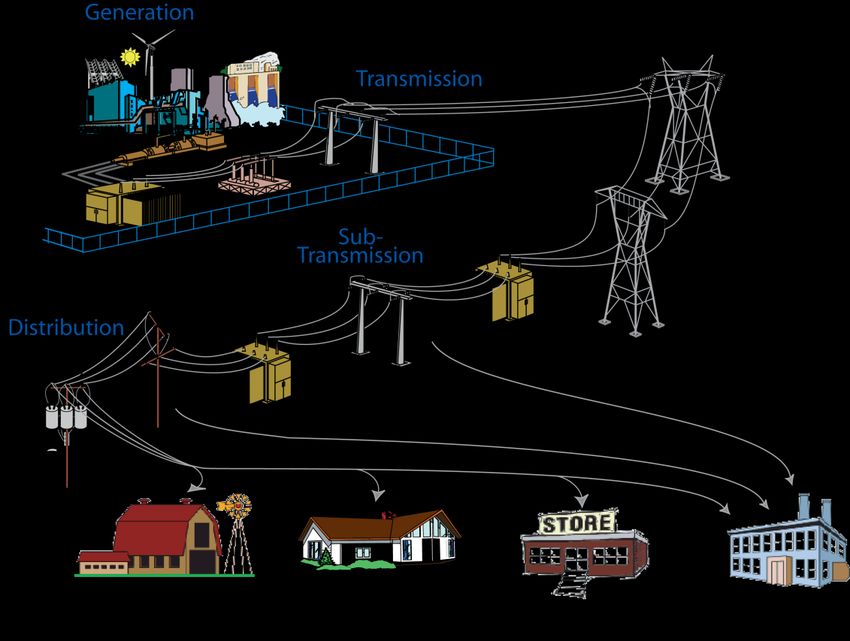
Addressing Wildfire Risk

                           • SCE filed its second Wildfire
                             Mitigation Plan in February 2020

                           • It builds on the progress made
                             in 2019 to reduce the risk of fire
                             ignitions caused by utility
                             infrastructure

                           • SCE crews will continue to work
                             to install hi-tech wildfire
                             mitigation tools and
                             technologies to make
                             communities safer, more
                             resilient, and to help reduce the
                             number of Public Safety Power
                             Shutoffs (PSPS)

                                                                  6
Public Safety Power Shutoffs (PSPS)
  •    De-energizing power lines to prevent ignitions
  •    Used during elevated fire conditions
  •    Primarily impacts circuits in high fire risk areas
  •    Use of multiple methods to notify people in affected areas before, during and after a de-energization event

             4-7 DAYS              3 DAYS                2 DAYS             1 DAY AHEAD              POWER                 POWER
             AHEAD                 AHEAD                 AHEAD                                      SHUTOFF             RESTORATION

            Forecast              SCE Incident         SCE Incident        2nd Notification      3rd Notification   4th Notification
          Weather & Fire          Management           Management               PSPS              Power Shutoff     Power Restored
           Conditions            Team on Alert        Team Activated          Possible                              After Inspection

                                    County             1st Notification
                               Operational Areas     PSPS Possible sent
                                 informed of          to agencies and
                                   potential             customers
                                  activation

                                   PLANNING AND MONITORING                                                     OUTAGE

*Erratic or sudden onset of conditions may impact our ability to provide advanced notice to customers.                                 7
Reliability Overview

                       8
What is Reliability?

   • In simplest terms:
           Having dependable electricity when you
           need it.
   • Outages:
           • Maintenance outages (aka planned
             outages)
           • Repair outages (aka unplanned outages)
                  • Sustained Outage = An outage lasting > 5
                    minutes
                  • Momentary Outage = An outage lasting ≤
                    5 minutes

Major Event Day (MED) : A day in which the daily system SAIDI exceeds a threshold value. For the purposes of calculating daily system
SAIDI, any interruption that spans multiple calendar days is accrued to the day on which the interruption began. Statistically, days having a
daily system SAIDI greater than a threshold value are days on which the energy delivery system experienced stresses beyond that normally
expected (such as severe weather).
Public Safety Power Shutoff (PSPS) : An operational protocol that SCE implements under extreme weather conditions in order to minimize
the threat of wildfires and keep communities safe from potentially dangerous situations. These types of sustained outages are temporary
and usually involve situations where high fire areas are experiencing adverse weather or public safety is at risk.

                                                                                                                                                9
How Do We Measure Reliability?

      SAIDI       SAIFI      MAIFI   CAIDI

                                             10
Communities in the RIDGECREST District CityList1
BORON
CALIFORNIA CITY
CANTIL
CHINA LAKE ACRES
DEATH VALLEY TIMBISHA SHOSHONE TRIBE
EDWARDS AFB
FURNACE CREEK
HOMEWOOD CANYON-VALLEY WELLS
INYOKERN
JOHANNESBURG
NORTH EDWARDS
PEARSONVILLE
RANDSBURG
RIDGECREST
SEARLES VALLEY
11*”Exclusions” are days which utilities are allowed to remove from their metrics because the outages on those days were caused by a severe acts of nature.
**In the columns showing “Rank,” lower numbers indicate poorer performance.
12Overview of Death Valley Timbisha Shoshone Tribe CircuitList1
There are 1 circuits that serve Death Valley Timbisha Shoshone Tribe 1
Circuit Type Customers Circuit Type Customers Circuit Type Customers Circuit Type Customers
FURNACE CREEK(33KV) 36 - - -
- - - -
- - - -
- - - -
- - - -
- - - -
- - - -
- - - -
- - - -
- - - -
- - - -
- - - -
- - - -
- - - -
- - - -
- - - -
- - - -
- - - -
- - - -
- - - -
- - - -
- - - -
- - - -
- - - -
- - - -
- - - -
- - - -
- - - -
- - - -
- - - -
Grand Total 36
13BarChart
Reliability History of Circuits Serving Death Valley Timbisha Shoshone Tribe (No
Exclusions)
2016 2017 2018 2019
4000.0
3509.1
3500.0
3000.0
SAIDI
2500.0
(average 2132.6
2000.0 1733.3
minutes of
1500.0
sustained
interruptions) 1000.0 514.0
500.0 134.5 139.7 136.8 178.0 Death Valley Timbisha
0.0 Shoshone Tribe
8.0
7.5 7.0
7.0 SCE SYSTEMWIDE
6.0
SAIFI 5.0
(average
4.0
frequency of 3.0
3.0
sustained
2.0 1.6 1.2
interruptions) 1.1 0.9 1.0
1.0
**“Exclusions” are days which
0.0
utilities are allowed to
30.0 remove from their metrics
25.5 because the outages on
25.0
20.8 those days were caused by
MAIFI 20.0 acts of nature.
(average 14.7
frequency of 15.0
momentary **Data is as of 02/14/2020, data
10.0 7.2
interruptions) can be slightly different due to
5.0 1.6 1.8 1.4 1.4 outage data validation process
0.0
14SAIDIChart
Causes of Repair Outages in Death Valley Timbisha Shoshone Tribe
2019
Contributions to SAIDI by Outage Cause
PSPS
0.0%
Equipment Failure
e.g., in-service failure of transformer,
switch, or conductors
Vegetation/Animal
e.g., tree branch, rodent, or bird
causing a short circuit between
conductors 3rd Party
Other Equipment Failure
e.g., patrolled but no cause found, Weather /Fire Operation
PSPS /Earthquake Other
Operation
Operations 36.4% Vegetation /Animal
45.4%
e.g., urgent maintenance w/o 3-day Weather /Fire /Earthquake
notice PSPS
3rd Party
e.g., balloon, car hit pole, dig-in
PSPS
e.g., Public Safety Power Shutoff
Vegetation /Animal
2.3% Other
15.9%
SAIDI = the cumulative amount of time the average customer is interrupted by “sustained” outages each year.
15SAIFIChart
Causes of Repair Outages in Death Valley Timbisha Shoshone Tribe
2019
Contributions to SAIFI by Outage Cause
Weather /Fire
/Earthquake PSPS
12.7% 0.0%
Vegetation /Animal
2.4%
Operation
20.2%
Equipment Failure
e.g., in-service failure of transformer,
switch, or conductors
Vegetation/Animal
e.g., tree branch, rodent, or bird
causing a short circuit between
conductors
Other
e.g., patrolled but no cause found
Operations
3rd Party
e.g., urgent maintenance w/o 3-day
Equipment Failure
notice
3rd Party Operation
e.g., balloon, car hit pole, dig-in Other
Vegetation /Animal
PSPS
Weather /Fire /Earthquake
e.g., Public Safety Power Shutoff
PSPS
Other
64.7%
SAIFI = the number of times the average customer is interrupted by “sustained” outages each year
1617
18
Back-up Slides

Reliability Histories of Circuits Serving Death Valley Timbisha Shoshone Tribe

                          Updated through Dec 2019

                                                                                 19
Average Reliability of 1 Circuits Serving Death Valley Timbisha Shoshone Tribe
CitySummary
2016 2017 2018 1st Qtr 2019 2nd Qtr 2019 3rd Qtr 2019 4th Qtr 2019 2019
SAIDI SAIFI MAIFI SAIDI SAIFI MAIFI SAIDI SAIFI MAIFI SAIDI SAIFI MAIFI SAIDI SAIFI MAIFI SAIDI SAIFI MAIFI SAIDI SAIFI MAIFI SAIDI SAIFI MAIFI
1 Circuits Serving Death Valley Timbisha
Shoshone Tribe -- Total Customers: 36 2132.6 1.6 14.7 514.0 3.0 25.5 3509.1 7.5 7.2 908.5 3.4 7.0 - - 4.0 62.8 1.2 3.8 762.1 2.5 6.0 1733.3 7.0 20.8
3rd Party - - - - - - - - - - - - - - - - - - - - - - - -
Equipment Failure 8% 33% - - - - - - - - - - - - - - - - - - - - - -
Operation 0% 4% - - - - 0% 13% 14% 87% 42% - - - - - - - - - - 45% 20% -
Other - - 86% 100% 100% 100% 100% 87% 86% 13% 58% - - - 100% 36% 86% 100% 17% 64% 99% 16% 65% 66%
Vegetation/Animal - - - - - - - - - - - - - - - 64% 14% - - - - 2% 2% -
Weather/Fire/Earthquake 92% 64% 14% - - - - - - - - 100% - - - - - - 83% 36% 1% 36% 13% 34%
PSPS - - - - - - - - - - - - - - - - - - - - - - - -
SCE SYSTEMWIDE 134.5 1.1 1.6 139.7 1.2 1.8 136.8 0.9 1.4 28.1 0.3 0.4 18.9 0.2 0.4 31.8 0.2 0.3 99.3 0.3 0.3 178.0 1.0 1.4
Notes:
No outages are excluded from the metrics.
Outage Causes:
Other: e.g., patrolled but no cause could be found
Operations: e.g., urgent maintenance w/o 3-day notice to customers
3rd Party: e.g., balloons, car hit pole, dig-in
Vegetation/Animal: e.g., tree branch, rodent, or bird causing short circuit across conductors
PSPS: e.g., Public Safety Power Shutoff
SAIDI (minutes) = the cumulative amount of time the average customer is interrupted by “sustained” (longer than 5 minutes) outages.
SAIFI (interruptions) = the number of times the average customer is interrupted by “sustained” outages.
MAIFI (interruptions) = the number of times the average customer is interrupted by “momentary " (lasting 5 minutes or less) outages.
20Reliability Histories for Individual Circuits Serving Death Valley Timbisha Shoshone Tribe - 1 of 1
2016 2017 2018 1st Qtr 2019 2nd Qtr 2019 3rd Qtr 2019 4th Qtr 2019 2019
SAIDI SAIFI MAIFI SAIDI SAIFI MAIFI SAIDI SAIFI MAIFI SAIDI SAIFI MAIFI SAIDI SAIFI MAIFI SAIDI SAIFI MAIFI SAIDI SAIFI MAIFI SAIDI SAIFI MAIFI
FURNACE CREEK(33KV) - Customers: 36 2132.6 1.6 14.7 514.0 3.0 25.5 3509.1 7.5 7.2 908.5 3.4 7.0 - - 4.0 62.8 1.2 3.8 762.1 2.5 6.0 1733.3 7.0 20.8
3rd Party - - - - - - - - - - - CircuitHistory
- - - - - - - - - - - - -
Equipment Failure 8% 33% - - - - - - - - - 1- - - - - - - - - - - - -
Operation 0% 4% - - - - 0% 13% 14% 87% 42% - - - - - - - - - - 45% 20% -
Other - - 86% 100% 100% 100% 100% 87% 86% 13% 58% - - - 100% 36% 86% 100% 17% 64% 99% 16% 65% 66%
Vegetation/Animal - - - - - - - - - - - - - - - 64% 14% - - - - 2% 2% -
Weather/Fire/Earthquake 92% 64% 14% - - - - - - - - 100% - - - - - - 83% 36% 1% 36% 13% 34%
PSPS - - - - - - - - - - - - - - - - - - - - - - - -
- - - - - - - - - - - - - - - - - - - - - - - - -
- - - - - - - - - - - - - - - - - - - - - - - - -
- - - - - - - - - - - - - - - - - - - - - - - - -
- - - - - - - - - - - - - - - - - - - - - - - - -
- - - - - - - - - - - - - - - - - - - - - - - - -
- - - - - - - - - - - - - - - - - - - - - - - - -
- - - - - - - - - - - - - - - - - - - - - - - - -
- - - - - - - - - - - - - - - - - - - - - - - - -
- - - - - - - - - - - - - - - - - - - - - - - - -
- - - - - - - - - - - - - - - - - - - - - - - - -
- - - - - - - - - - - - - - - - - - - - - - - - -
- - - - - - - - - - - - - - - - - - - - - - - - -
- - - - - - - - - - - - - - - - - - - - - - - - -
- - - - - - - - - - - - - - - - - - - - - - - - -
- - - - - - - - - - - - - - - - - - - - - - - - -
- - - - - - - - - - - - - - - - - - - - - - - - -
- - - - - - - - - - - - - - - - - - - - - - - - -
- - - - - - - - - - - - - - - - - - - - - - - - -
- - - - - - - - - - - - - - - - - - - - - - - - -
- - - - - - - - - - - - - - - - - - - - - - - - -
- - - - - - - - - - - - - - - - - - - - - - - - -
- - - - - - - - - - - - - - - - - - - - - - - - -
- - - - - - - - - - - - - - - - - - - - - - - - -
- - - - - - - - - - - - - - - - - - - - - - - - -
21You can also read