CITIZEN SCIENCE INITIATIVE FOR SCHOOLS: EDU-ARCTIC MONITORING OF METEOROLOGICAL AND PHENOLOGICAL PARAMETERS
←
→
Page content transcription
If your browser does not render page correctly, please read the page content below
CITIZEN SCIENCE INITIATIVE FOR SCHOOLS: EDU-ARCTIC
       MONITORING OF METEOROLOGICAL AND PHENOLOGICAL
                           PARAMETERS
     A. Goździk1, P.E. Aspholm2, H.K. Wam2, T. Wawrzyniak1, A. Wielgopolan1
                  1
                      Institute of Geophysics, Polish Academy of Sciences (POLAND)
                         2
                           Norwegian Institute of Bioeconomy Research (NORWAY)

                                               Abstract
Citizen science is sometimes described as "public participation in scientific research," or participatory
monitoring. Such initiatives help to bring research into, for example, the classroom and engage pupils
in well-structured observations of nature in their vicinity. The learning and practising of observation
may increase the understanding of complex conditions occurring in nature, related to biology, ecology,
ecosystems functioning, physics, atmospheric chemistry etc. For school curricula and motivation of
pupils, practical hands-on activities performed by school pupils themselves by using their own senses
stimulate faster learning and cognition. For this, the EDU-ARCTIC project developed the Monitoring
System. All schools in Europe are invited to participate in a meteorological and phenological
observation system in the schools’ surroundings, to report these observations on the web-portal and to
have access to all the accumulated data. The schools and pupils become part of a larger citizen effort
to gain a holistic understanding of global environmental issues. The students may learn to act as
scientific eyes and ears in the field. No special equipment is needed. Reporting of observations should
be made once a week in the Monitoring System through the EDU–ARCTIC web-portal or the
accompanying mobile app. A manual and a field guide on how to conduct observations and report are
available through the web. Teachers may download reports containing gathered information and use
them for a wide variety of subjects, including biology, chemistry, physics and mathematics.
Meteorological parameters are requested reported as actual values: air temperature, cloud cover,
precipitation, visibility reduction and wind force, in all 19 parameters. It is also asking for reports on
meteorological and hydrological phenomena, which occurred within the previous week: like lightning,
extreme and other atmospheric phenomena, ice on lakes and rivers and snow cover, in all 23
parameters. The Monitoring System also includes biological field observations of phenological phases
of plants, like birch, lilac, bilberry in all 26 parameters. The occurrence of the first individual of five
species of insects like Bumblebee, Mosquito, Ant and butterfly, and then registration of the first
appearance of the bird species: Arctic tern, Common Cuckoo, White wagtail and Crane.
An app for the Monitoring System has been developed in order to engage pupils more by making it
more comprehensive to register the meteorology and the phenophases. Further, special webinars and
Polarpedia (the project’s own online encyclopedia) entries are developed to strengthen the Monitoring
System. The EDU-ARCTIC Monitoring System gathered more than 2000 reports from schools, with an
average monthly number of more than 80 observations. They are freely available via the web-portal,
but password access is needed in order to enter registrations and data.
Keywords: observation system, citizen science, natural sciences, interdisciplinary, STEM.

1     INTRODUCTION
Citizen science currently receives much attention as a means to engage and educate the public in
pressing environmental issues [1]. The basic idea behind it is that you need knowledge in order to gain
awareness and that this process is facilitated by anchoring new knowledge to something you already
know and care about, like your local surroundings [2, 3]. Another central aspect is that by contributing
to collect data for research, the participating citizens get a sense of contributing to important matters
beyond their egocentric sphere, which is one among a plethora of motivations for participating in a
citizen science initiative [4]. Citizen science is therefore sometimes described as "public participation
in scientific research," or participatory monitoring.
Citizen science initiatives help to bring research into, for example, the classroom and engage pupils in
well-structured observations of nature in their vicinity. The learning and practising of such place-based
studies about nature may increase the understanding of complex ecological relationships and

Proceedings of EDULEARN19 Conference                                                ISBN: 978-84-09-12031-4
                                                   0776
1st-3rd July 2019, Palma, Mallorca, Spain
conditions, related to almost any school subjects, and most apparently biology, social studies, physics,
and chemistry. For motivation of pupils and completion of learning goals in the school curricula,
practical hands-on activities performed by pupils themselves with their own senses generally stimulate
faster learning, especially through peer interaction and embodied experience [5]. In a wider social
context, some well documented individual benefits of place-based learning are, for example, increased
academic learning, stronger ties to one’s community, an enhanced appreciation of the natural world,
and more commitment to citizenship [6].
Especially the latter is important, given the many challenges humans have for achieving local and
global sustainable use of natural resources [7]. To act in society, it is not sufficient to have theoretical
knowledge. Practice-oriented knowledge (learning by doing) about nature empowers the pupils to act
as environmentally literate citizens [8]. More empowerment helps youth distinguish between positive
benefits and negative consequences to the sustainability of their actions (United Nations’ sustainable
development goals, SDG #12). As more empowered citizens, they are also more likely to enjoy
individual benefits like life-long employability, societal participation and improved well-being, enabling
them to lead healthier and more fulfilling lives (SDG #3) well beyond formal schooling [9]. Therefore,
with a small initiative like the EDU-ARCTIC Monitoring System, we expect to sow seeds of curiosity in
youth that will nurture tools and skills needed to engage in a society capable of making informed
decisions that look for the common good (SDG #17).
The EDU-ARCTIC Monitoring System is a citizen science program (2017-2019) where all schools (or
any citizen) in Europe were invited to contribute meteorological and phenological observations from
the surroundings of their local community. All data were time- and place-stamped and accessible by
everybody online through technology-mediated social participation. Thereby, the program generated
immediate and not only long-term benefits to the volunteers, which is expected to affect (positively)
participant motivation and outcomes [10]. In this paper, we give an overview of participation in the
program, the data it generated and some preliminary data from our surveys of impact evaluation.
2 EDU-ARCTIC EDUCATIONAL PROGRAM
2.1 General information on the EDU-ARCTIC project
EDU-ARCTIC is an EU-funded project focused on using Arctic research as a vehicle to encourage
young people aged 13 to 20 to pursue further education in science, technology, engineering and
mathematics (STEM). Students participating in the project have a unique possibility to get to know
what scientific careers are like and to learn more about different research disciplines while learning
how to apply the scientific method, and also to learn crucial problem-solving skills. It may contribute to
increasing the number of researchers in the field of STEM-related disciplines.
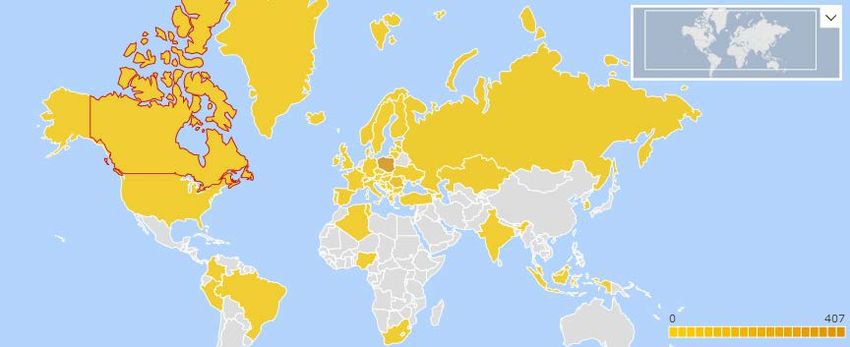
Figure 1. Distribution of teachers registered to the EDU-ARCTIC program by country
(as per 30th April 2019). The darker colour (yellow) indicates presence of participating teachers.
The project is conducted by six organisations: Institute of Geophysics, Polish Academy of Sciences
(Coordinator, Poland), American Systems sp. z o.o. (Poland), The Norwegian Institute of Bioeconomy
0777Research – NIBIO (Norway), Jardfeingi (The Geological Survey) (Faroe Islands), Universite de
Versailles Saint-Quentin (France), The Arctic Portal (Norðurslóðagáttin ehf) (Iceland). The project,
which is funded for 39 months, started in May 2016, whereas activities for schools started in January
2017. More than 1193 teachers from 58 countries have registered to the program already (Fig. 1).
2.2 The EDU-ARCTIC main components
The EDU-ARCTIC project offers a mix of different interactive and innovative tools to bring a fresh
approach to teaching STEM subjects:
1 Webinars: Online lessons with polar scientists working at research stations and institutes. The
lessons focus on natural science topics, polar research and why they are key to helping solve
important challenges in society. In each online lesson up to 23 school groups may participate
simultaneously. Webinars are conducted in English and in a few other European languages. In
the last school year (2018/2019) the EDU-ARCTIC Consortium introduced a series of thematic
courses, dedicated to various topic, including “Citizen Science” course on the EDU-ARCTIC
Monitoring System.
2 “Polarpedia”: An evolving online encyclopedia that contains a glossary of scientific terms in 16
national European languages (English, Polish, Danish, Norwegian, French, Romanian,
Bulgarian, Italian, Greek, Bulgarian, Russian, Albanian, Croatian, Serbian, Macedonian and
German so far). It helps teachers and pupils to prepare for their participation in webinars by
providing short explanations of scientific terms used by researchers conducting webinars. It
contains photos, graphics and animations or videos, if possible. It is divided into 9 categories:
Ice & Snow, Climate & Weather, Plants & Animals, Land & Geology, Atmosphere, Water
resources, Space, People & Society, Places & Stories. Moreover, an additional part of
Polarpedia contains educational resources for teachers and students in the form of online
games, quizzes, worksheets, experiments, teamwork proposals and others.
3 Arctic Competitions: invitation to three editions of competitions were extended to all secondary
schools participating in the program. Participants of the competition each developed their own
innovation or research project in the form of an essay, a video or a poster. An international jury
chose 4 to 6 winning teams per edition, who were invited on an Arctic Expedition to visit one of
the scientific stations participating in the project (Svalbard, Faroese Islands, Iceland and
northern Norway).
4 The environmental Monitoring Program, which is the focus of this paper and presented in detail
below.
3 EDU-ARCTIC MONITORING SYSTEM
3.1 EDU-ARCTIC Monitoring System – general information
We developed the EDU-ARCTIC Monitoring System to bring STEM research into classrooms across
Europe and engage pupils in well-structured observations of nature. All schools in Europe are invited
to participate in a meteorological and phenological observation system in the schools’ surroundings, to
report these observations on the web-portal and to have access to all the accumulated data. The
schools and pupils become part of a larger citizen effort to gain a holistic understanding of global
environmental issues. Our aim was that young people learn to act as scientific eyes and ears in the
field. No special equipment is needed to participate.
The program has a web-based interface allowing interested schools to report their observations in an
open and accessible database. Reporting of observations should be made once a week (by Monday
at 12:00 local time) through the EDU–ARCTIC web-portal or the accompanying mobile app. As a main
rule, the students should play a crucial role, make observations and provide with data required for
reporting to the portal. The mobile app was developed in order to enable students and other citizens to
report on measurements conducted by them in a format most accessible to youth. A manual and a
field guide on how to conduct observations and make reports are available through the web. Teachers
may download raw data and use them for a wide variety of subjects, such as biology, chemistry,
physics and mathematics. The program is dedicated to meteorological and phenological parameters.
Within meteorological observations and measurements, there are reports on some actual values and
reports on phenomena, which occurred since the last observation. Biological observations cover
plants, insects, and birds monitoring.
07783.2 Meteorological observations
The demand for weather and climate information continues to expand because weather affects
everyone everywhere, and currently people perceive the weather to be changing. If the atmospheric
system and climate conditions are considered, then the long term, spatially distributed, operational
monitoring of meteorological variables including reliable observations and measurements is obligatory.
It is crucial to have a relevant dataset of atmospheric observation data if analysing the variability and
fluctuations of climate at any given location. Weather conditions are crucial drivers that have feedback
on many environmental components and influence our everyday life. Astronomical factors primarily
determine the climatic characteristics of the area, but there are differences in the mechanisms that
cause regional differences throughout the areas.
Pupils and students may develop an improved understanding of the complex processes within the
atmosphere, ocean, land, water cycles, and their interactions by practicing of observations. Monitoring
System created within the EDU-ARCTIC project gives the expanded opportunity for spatially
distributed observations of meteorological phenomena conducted by students around the globe as
never before. It makes it easier to understand the temporal and spatial variability of weather
phenomenon and climate but also provides a tool for sharing information to other users in a manner
that is timely and easy to understand and use. The proposed Monitoring System was also created to
show students that the meteorology is an engaging and challenging profession. Students have a
chance to conduct direct, timely, accurate, and detailed meteorological observations, and then
reporting and processing data.
For comparison of every collected value between different locations and their temporal variability, the
results are displayed on the maps and also reports in .xls format can be generated. By clicking on the
displayed icons on the map, various submitted data may be checked at each school location. Most
meteorological parameters in the Monitoring System must be reported as actual values: air
temperature, cloud cover, precipitation, visibility reduction, and wind force. There are also
meteorological and hydrological phenomena, which occurred within the previous week: lightning,
extreme and other atmospheric phenomena, ice on lakes and rivers, and snow cover. The parameters
were specially chosen to be inexpensive to conduct with no special equipment needed.
The air temperature has to be measured by an ordinary thermometer outdoor, in the shade, protected
against precipitation and direct sunlight, ~2m above the ground. Total cloud amount is the fraction of
the sky covered by the cloud of any type or height above the ground, and for the EDU-ARCTIC
monitoring purpose students have to choose one of the following cloud cover: none, partly cloudy,
complete cloud cover. Depending on the duration of precipitation students choose: none, showers,
and continuous precipitation. They are also asked to name the type of precipitation: drizzle, rain,
snow, hoar-frost, hail. In the case of meteorological visibility, students are asked to measure the
distance at which an object or light can be clearly seen. They should choose between different types
of visibility reduction: none (good visibility, more than 10 km), mist (restricts visibility to between 1 to
10 km), fog (restricts visibility to 1 km or less), and smog. In case of wind force they have to choose
between: none (calm conditions), light wind (weak wind that lightly moves leaves on trees), gusty wind
(moves branches on the trees, dust and loose paper raise), hurricane (strong wind that causes
damage to nature and households). There are also parameters that might have been noticed since the
last observation (previous week): lightning (none, lightning inside clouds, lightning strikes the ground);
extreme atmospheric phenomena (none, flood, whirlwind, avalanche); other atmospheric phenomena
(none, aurora, rainbow, glazed frost). Students should also be involved in hydrological cycle
observations, including lakes and rivers activity, ice cover and snow cover. It helps to understand its
impact on the distribution and supply of water. These observations to report are as follows: ice on
lakes (none, lake surface is freezing, lake surface is melting, complete ice cover); ice on rivers (none,
partly covered, complete ice cover); and snow cover (none, first snow, snow accumulation, stable
snow cover, snow melting).
The obtained results give the distributed information on weather conditions and allow for determining
the magnitude of their variability both spatial and temporal, its extremes, and help to understand the
complexity of the climate system and climate patterns. Having a spatial display of the results helps to
understand how the natural factors such as latitude, altitude, the reflectivity of the Earth’s surface,
distance from the sea and external forcing such as solar radiation, contribute to this complexity and
changes. The students in the Monitoring System learn how meteorologists put much effort into
monitoring, assessing and predicting these changes and helping policymakers develop strategies for
dealing with them, especially in climate-sensitive sectors such as agriculture and water management.
07793.3 Phenological observations
When are the flowers blooming, when will the fruits ripen, when do the migrating birds arrive back in
the spring migration? The scientific method to collect this information is defined as phenology. The use
of the term phenology is acknowledged to be given by Charles François Antoine Morren that used the
word in 1853. The definition of phenology that is used since 1970’s is proposed by the
US/International Biological program Phenological Committee: “phenology is the study of the timing of
reoccurring biological events, the causes of their timing with regard to biotic and abiotic forces, and the
interrelation among phases of the same or different species.” [11]. The observation is based on
denoting the date of the happening of various precise defined phases (phenophases) of periodic
biological phenomena, i.e. budburst of birch, first ripen blueberry, first mosquito bite, the arrival of
cranes. There are signs of phenological observations from Asian and Mediterranean civilisations long
back in history [12].Though the ancient observations of blooming cherries in China from 947 BC and
the registrations from Japan for about 1200 years make some of the longest time-series in phenology.
During 17th and 18th centuries, several groups started to systematically observe and register
phenology. Most of them were scientifically based. In 19th century, more and more private persons
became interested in phenological observations, both as independent observers or in organized
groups, and this became like a citizen science function. The phenological observations make a basis
to be combined with meteorology and other sciences to reveal and understand the connections in
nature, including agriculture and forestry, climate influence and impact of humans.
3.3.1 Monitoring of plants
The species of plants in the Monitoring System were selected to be relatively easy to identify by the
project participants and occurring in most parts of Europe. There are actually not so many plants that
are distributed from Malta through whole Europe up to Svalbard. Further, we tried to choose species
that is so common that there exist some literature about them in the various national languages of the
countries. Then the phenophases were selected so that they are relatively distinct and clear to
observe for young people. Another aspect is that the species’ phenophases should have evident
relevance for and be influenced by environmental parameters. We also wanted the selected
phenophases overall to allow the most comparisons within and between species for meteorological
gradients in Europe.
Table 1. The plant species and their phenophases used in the Monitoring System.
Species Latin name Phenophase
Birch Betula pubescens Started to flower
Opened buds
Leaves started colouring
Leaves started falling down
Black alder Alnus glutinosa Started to flower
Opened buds
Seeds ready
Leaves started falling down
All leaves fallen down
Opened buds
Lilac Syringa vulgaris Started to flower
All leaves fallen down
Opened buds
Rowan Sorbus aucuparia Started to flower
Ripen berries
Leaves started colouring
Leaves started falling down
All leaves fallen down
Started to flower
0780Bilberry Vaccinium myrtillus Ripen berries
Started to flower
Rosebay willow-herb Chamerion angustifolium Seeds ready
Started to flower
Dandelion Taraxacum officinale Seeds ready
3.3.2 Monitoring of insects
The insects in the Monitoring System were chosen to be common indicators of ecosystems and easily
found in the vicinity of schools throughout Europe. There are three pollinators (bumblebees, and two
species of butterflies), one group of ground living (ants) and one group of flying (mosquitos) insects.
The two species of butterflies are long living and survive as adults through the winter into next
summer. The bumblebees and ants are living in organized communities where the queen lives for one
year or longer. The mosquitos have a shorter lifespan, though some can survive as adults through the
winter. For the insects, we chose to use the phenophase of the first occurrence in the year. For all,
except mosquitos, this is the first visual occurrence, and for the mosquito, it is the first bite on human
skin. We chose the bite, because there are several groups of insects that can be mistaken as
mosquito.
Table 2. The insect species and their phenophases used in the Monitoring System.
Species Latin name Phenophase
Bumblebee Bombus sp First observation
Mosquito Culex sp First bite
Ant Formica sp First observation on ant-hill
Common brimstone butterfly Gonepteryx rhamni First observation
European Peacock butterfly Aglais io Fist observation
3.3.3 Monitoring of birds
The birds chosen for the Monitoring System all have migration routes covering most of Europe. Some
of the species are representing birds that migrate relatively long distances, like the Arctic tern
migrating between the Arctic and the Antarctic. White wagtail is migrating the shortest and parts of the
population can overwinter in southern Spain and Mediterranean coast. The main didactic point is to
show an environmental connection between continents with birds that use Europe as nesting place,
but migrate to other continents i.e. Africa and Middle East for overwintering. We also selected the
birds that can be easily identified, and have iconic connections to folklore in many areas of Europe, for
example as cultural indicators from which to predict how weather will be during the coming season.
The phenophase we used for birds is first visual or sound (like cranes and cuckoo) observation.
Table 3. The bird species and their phenophases used in the Monitoring System.
Species Latin name Phenophase
Arctic Tern Sterna paradisea First observation
Common cuckoo Cuculus caronus First observation
White wagtail Motacilla alba First observation
Crane Grus grus First observation
07813.4 Monitoring System mobile app
During EDUCATORS’ FORA (international meetings in 2017 – Oslo, Paris, Warsaw, dedicated to
gathering feedback from active EDU-ARCTIC teachers), teachers shared their ideas how to engage
pupils and make them more involved directly in the project. Monitoring System was evident as one of
the areas with huge potential for direct students’ participation, and consequently, creating a mobile
app became an aspired stage of the Monitoring System development.
Today emerging technologies are reformulating the practice of education. In order to deal with current
education challenges, combining education and technology is necessary for effective learning, with
two-way benefits: users can access any information from anywhere, but also feed all sorts of
databases, which matches perfectly the idea of citizen science, underlying the concept of EDU-
ARCTIC Monitoring System.
App-equipped wireless devices give users worldwide the ability to act as remote sensors for all sorts
of data as they go through their daily routines. Mobile apps offer miscellaneous functions: allow data
entry in the field, enhance instant visual recognition of phenomena, and facilitate mapping
observations. While designing and planning this tool, key necessary features were taken into account
to make sure that the app meets expectations of demanding “mobile-fed” generation; consequently,
the following elements needed to be provided:
• quality images and descriptions – the app became an opportunity to disseminate Monitoring
System Manual; the manual was adjusted to app conditions, offering “help” section with the
dedicated relevant part of manual, helping to identify a phenomena, plants’ phenophase or
migratory bird etc.,
• push notifications (weekly customized reminders),
• screen-responsive design (variability of display depending on the size of the screen, including a
crucial part-scalability of world map with visible measurements),
• cross-platform coverage (2 most popular European systems – ANDROID and IOS were
covered.),
• interoperability with modern connectivity standards (allowing offline work, turning location
services on in order to submit the measurement).
The app added additional value to the Monitoring System: it was no longer limited to registered
teachers and one location (school coordinates) per reporting user. Instead, it allowed Monitoring
System to be open to users from all over the world, providing measurements from various locations
(e.g. summer holidays, trips etc.).
The app is available for free and its functionalities were designed to be as simple as possible.
However, in order to deliver real value and provide a high quality of data, measurements by non-
registered users are marked distinctly from those provided by registered teachers (grey vs blue marks
on the map with measurement results). This allows us to remain precarious about and eliminate
potential dubious/questionable submissions of data. The app offers direct access not only to our
illustrated monitoring manual (enabling more citizens to place their science-based insight into wider
context and importance of observations), but also history of user’s measurements and map with
results (the user’s own measurements marked in red). Such an approach fits with current societal
trends of personalisation and customisation, which enhance user experience allowing users to control
their interaction. In the case of the Monitoring System app, the “sharing culture” ingrained in
generation familiarized with social media is harnessed by the possibility of adding individual photos of
observations.
The app facilitates – through its many easy-to-apply interphase qualities – the element of sustained
ongoing engagement – a key success factor in mobile apps, especially those aiming at supporting the
collection of environmental data. We may so even reach the “sharing culture” of young, notorious
technology enthusiasts because the app exploits gamification qualities based on undisturbed
presence and demonstration of undertaken activities; supporting regular submitter’ engagement. For
each measurement, users can gather 2 to 5 so-called ‘EDU-COINS’ points (2 for adding at least one
parameter, and up to 3 photos with 1 point each). Their results are presented on a public scoreboard.
Additionally, users can exchange their points for rewards (backpacks, jigsaws, photo albums etc.).
0782This way the EDU-ARCTIC Monitoring System is enriched with another type of positive motivation,
strengthening imparting skills to execute assignments and enable young people to utilize their leisure
hours in exploring productive things and arouse curiosity to learn more willingly.
4 METHODS OF EVALUATION OF THE IMPACT
Within the project assessment of the impact of participation in the EDU-ARCTIC program, we
collected measures on students’ interest in STEM and their knowledge. The technique used for
collecting data is CAWI surveys. CAWI (Computer Assisted Web Interviews) research technique is an
interview in which participants fill in an online questionnaire or survey received via the Internet.
Currently the CAWI method is one of the most popular and fastest-growing research methods. With a
sense of anonymity and the opportunity to participate in the study at a time convenient for the
respondent, it allows to collect more accurate data. The surveys consist of questions about changes in
pupils’ behaviour, openness and scientific courage due to participating in EDU-ARCTIC.
During the period 7.01.2019.-20.02.2019., after two years of running the program, we conducted a
survey assessing the general impact of the project and all particular activities implemented within. We
obtained 80 answers from teachers and educators from 19 countries, who participate in the project.
The survey was available to teachers, who were active in the program for at least one full year.
Teachers were invited to fill in the survey, but it was not obligatory. The survey was divided into 2
parts: (1) TECHNOLOGY including 3 questions about the various modules of the EDU-ARCTIC portal
and (2) FACTUAL including 6 questions about the impact of the project on pupils (e.g. interest,
understanding, knowledge). The results of the part of this survey dedicated to the Monitoring System
are presented in the section 5.
5 EVALUATION DATA
The evaluation of the solutions proposed within the EDU-ARCTIC project is crucial in order to assess
its impact and to propose changes required by end-users, if necessary. The evaluation process in the
project is ongoing as of May 2019. In this paper the results of some parts of the “Main Survey – After”,
using key indicators described in details in [13], dedicated to the Monitoring System are presented.
The first part of the survey addresses questions on (1) utility of the Monitoring System in conducting
various educational activities, (2) visual attractiveness of the Monitoring System and (3) frequency of
using it. To assess the utility and attractiveness of the system, teachers were requested to give marks
on a scale of 1 to 6, where 1 is the lowest and 6 the highest. The results are presented in Fig. 2.
visual attractiveness
utility
0% 20% 40% 60% 80% 100%
1 2 3 4 5 6
Figure 2. Visual attractiveness and utility of the EDU-ARCTIC Monitoring System marked by teachers on a
scale of 1 to 6, with 1 as the lowest and 6 as the highest grade (total of 80 answers).
The second part of the survey addresses impact of the Monitoring System on (1) students’ knowledge
about issues related to the Arctic, (2) the level of understanding of scientific issues and scientific
0783language among students, (3) the level of interest in STEM and scientific careers among students.
The results of this part are presented in Fig. 3.
Impact of the EDU-ARCTIC monitoring system
level of interest in STEM and scientific careers 6 16 33 25
level of understanding of scientific issues and
scientific language 6 13 38 23
students’ knowledge about issues related to the
Arctic 6 16 33 25
0% 10% 20% 30% 40% 50% 60% 70% 80% 90%100%
no impact little impact significant impact very strong impact
Figure 3. Opinions of teachers on the impact of the EDU-ARCTIC Monitoring System on the interest,
understanding and knowledge of their in-class pupils (13-20 years of age). Numbers of answers in each
category are given in the colour fields (Total of 80 answers).
6 RESULTS AND DISCUSSION
The Monitoring System was assessed positively by the majority of teachers in terms of its utility, with
the highest grades (5, 6) given by 89% of responders. Only a few teachers gave additional free
comments to the question, showing a.o. that they participate in so many projects, that it is difficult to
engage in all activities. One teacher suggested that implementation strategies for how they can use
studies in situ about climate change would be useful in his/her practice. We believe this would be a
valuable addition to future educational projects like EDU-ARCTIC; providing teachers with guidelines
for place-basing the teaching of what they learn in the project. In terms of visual attractiveness 91% of
teachers assessed it with two highest grades (5 and 6), which means that in practice no further
improvements are required in this context. No further suggestions were given by responders. We
therefore deem both the technical and the visual layout of our system as highly successful.
The Monitoring System was used by teachers more rarely than other EDU-ARCTIC components. The
biggest group of teachers (33 persons, 41%) declared to use it on average once per month. 26% of
responders use it rarely – less than once per month and only 11% use it regularly – a few times per
month. However, as this component was constructed in such a way that it required actions only once
per week (each Monday), the frequency indicated by teachers may be considered satisfactory. Within
27 months of operation 2168 reports from teachers were obtained (on average 80 reports monthly).
Taking into account the mobile app, despite its potential, the opportunities to involve students and
other citizens in direct observations and reports remain insufficiently exploited. Probably this is due to
the low recognition of the app among other actors than teachers. Our main dissemination activities
considered teachers, who not necessary distributed this information to their students.
As for the Monitoring System’s impact on students knowledge, understanding and interest, all the
three parameters were assessed generally positively. Only 7.5% of teachers considered that it has
had no impact on their students. The biggest impact reported was in terms of understanding of
scientific issues (48% of teachers assessed it as ‘significant’ (next highest score) and 29% as ‘very
strong impact’ (highest score)). Similarly positive impacts were reported for students’ knowledge and
their interest in STEM and scientific careers (both 41% significant and 31% very strong impact).
07847 CONCLUSIONS
After two years of implementation, we consider the Monitoring System offered by the EDU-ARCTIC
program as an effective way of enhancing students’ interest in STEM, scientific careers and their
knowledge about environmental issues. It was also positively assessed by its main users (teachers of
young people aged 13-20) in terms of utility and visual attractiveness. However, the frequency of
usage and the number of users is rather low. Especially the potential of the mobile app is not
sufficiently exploited and additional promotion could be dedicated to make that tool more popular.
ACKNOWLEDGEMENTS
EDU-ARCTIC project has received funding from the European Union’s Horizon 2020 research and
innovation program under grant agreement No 710240. The content of the document is the sole
responsibility of the authors and it does not represent the opinion of the European Commission, and
the Commission is not responsible for any use that might be made of information contained.
REFERENCES
[1] A. Irwin, “No PhDs needed: how citizen science is transforming research”. Nature, 562, 480-482,
2018.
[2] K.M. Jegstad, A.T. Sinnes, S.M. Gjøtterud, “Science teacher education for sustainable
development: from intensions to realisation”. Nordina, 14, pp. 350-367, 2018.
[3] D.A. Gruenewald, “The best of both worlds: a critical pedagogy of place,” Environmental
Education Research, 14, pp. 308-324, 2008.
[4] G. Kragh, “The motivations of volunteers in citizen science,” Environmental Scientist, 25, 32-35,
2016.
[5] Satterthwait, D., “Why are'hands-on'science activities so effective for student learning?” Teaching
Science: The Journal of the Australian Science Teachers Association, 56, 7-10, 2010.
[6] Iversen, E., Jónsdóttir, G., “‘We did see the lapwing’ – practising environmental citizenship in
upper-secondary science education”. Environmental Education Research, DOI:
10.1080/13504622.2018.1455075, 2018.
[7] United Nations, “Transforming Our World: The 2030 Agenda for Sustainable Development”.
Resolution adopted by the General Assembly, 2015.
[8] Lawy, R., Biesta, G.J.J., “Citizenship-as-practice: ...” British Journal of Educational Studies, 54,
34-50, 2006.
[9] Vedder-Weiss, D., Fortus, D., “Adolescents’ declining motivation to learn science…” J Res Sci
Teach 49: 1057-1095, 2012.
[10] Nov, O., Arazy, O., Anderson, D. 2014. “Scientists@Home: What drives the quantity and quality of
online citizen science participation?” PLoS ONE, 9(4).
[11] H. Lieth (eds), “Phenology and Seasonality Modeling,” Ecological Studies (Analysis and
Synthesis), vol 8., pp. 444, Springer, Berlin, Heidelberg,1974.
[12] M.D. Schwartz, “Phenology: an integrative environmental science. Dordrecht, The Netherlands:
Kluwer Academic, pp. 564, 2003.
[13] T. Juńczyk, K. Man, “Evaluation plan including KPIs (key performance indicators)”, public report of
the EDU-ARCTIC project, 2016. Retrieved from: https://edu-arctic.eu/library/project-reports/84-d-
5-1-evaluation-plan-including-kpis-key-performance-indicators
0785You can also read