Classifier-Guided Visual Correction of Noisy Labels for Image Classification Tasks - Uni Ulm
←
→
Page content transcription
If your browser does not render page correctly, please read the page content below
Eurographics Conference on Visualization (EuroVis) 2020 Volume 39 (2020), Number 3
M. Gleicher, T. Landesberger von Antburg, and I. Viola
(Guest Editors)
Classifier-Guided Visual Correction
of Noisy Labels for Image Classification Tasks
A. Bäuerle , H. Neumann , and T. Ropinski
All authors are with Ulm University. E-mail: alex.baeuerle|heiko.neumann|timo.ropinski@uni-ulm.de.
Abstract
Training data plays an essential role in modern applications of machine learning. However, gathering labeled training data is
time-consuming. Therefore, labeling is often outsourced to less experienced users, or completely automated. This can introduce
errors, which compromise valuable training data, and lead to suboptimal training results. We thus propose a novel approach
that uses the power of pretrained classifiers to visually guide users to noisy labels, and let them interactively check error
candidates, to iteratively improve the training data set. To systematically investigate training data, we propose a categorization
of labeling errors into three different types, based on an analysis of potential pitfalls in label acquisition processes. For each of
these types, we present approaches to detect, reason about, and resolve error candidates, as we propose measures and visual
guidance techniques to support machine learning users. Our approach has been used to spot errors in well-known machine
learning benchmark data sets, and we tested its usability during a user evaluation. While initially developed for images, the
techniques presented in this paper are independent of the classification algorithm, and can also be extended to many other
types of training data.
CCS Concepts
• Information systems → Expert systems; • Human-centered computing → User centered design; Information visualization;
1. Introduction error types, that can be potentially present in noisy label data sets.
Our categorization led to three such error types: Class Interpreta-
While most of the latest breakthroughs in deep learning have
tion Errors, Instance Interpretation Errors, and Similarity Errors.
been achieved by means of supervised algorithms, these algorithms
Tailored towards these error types, we further introduce detection
have one essential limitation: they require large amounts of la-
measures, which are based on the classifier’s response. Therefore,
beled training data. When learning image classification tasks, this
we first train with the potentially noisy labels, and subsequently
means that a large set of correctly labeled images needs to be
classify all training and validation images with the trained classi-
available [NOPF10, PTPP06]. Since the labeling process is time-
fier. The classifier’s response can then be analyzed using our error
consuming and labor-intensive, acquiring labeled training data is,
detection measures to guide the user to potential errors. These po-
however, a cumbersome process. To speed this process up, label-
tential errors are visualized in a way that supports an interactive
ing is often outsourced to less experienced annotators or crowd
visual correction. To visually guide the user during the correction,
workers, for instance via Amazon’s Mechanical Turk [KLA17,
we propose to employ linked list visualizations with importance
RYHH10]. In the context of deep learning, crowd workers are hu-
sorting. By using our approach, the number of required inspections
man labor, getting paid for labeling large data sets. Sometimes,
is bound by – and usually much lower than – the classification er-
even automatic label assignment tools are used [UCOT11]. Unfor-
ror, i.e., for a classifier that reaches an accuracy of 92%, only 8%
tunately, such a label acquisition process usually leads to noisy la-
of the data has to be reviewed at maximum. While this is the up-
bels, i.e., a training data set which contains many wrongly assigned
per bound for investigated training samples per iteration, all sam-
labels. This can compromise training results [ZBH∗ 16]. Thus, to be
ples that have already been inspected can additionally be ignored
able to benefit from these approaches for training data acquisition,
in the error detection process in future iterations. This means that
dedicated quality control mechanisms must be in place.
for each subsequent iteration of data-cleanup, only those samples
To address the problem of noisy labels, we propose a classifier- where the classifier disagrees with the label and that have not been
guided visual correction approach, which combines automatic error already revisited need to be reviewed. Without our classifier-guided
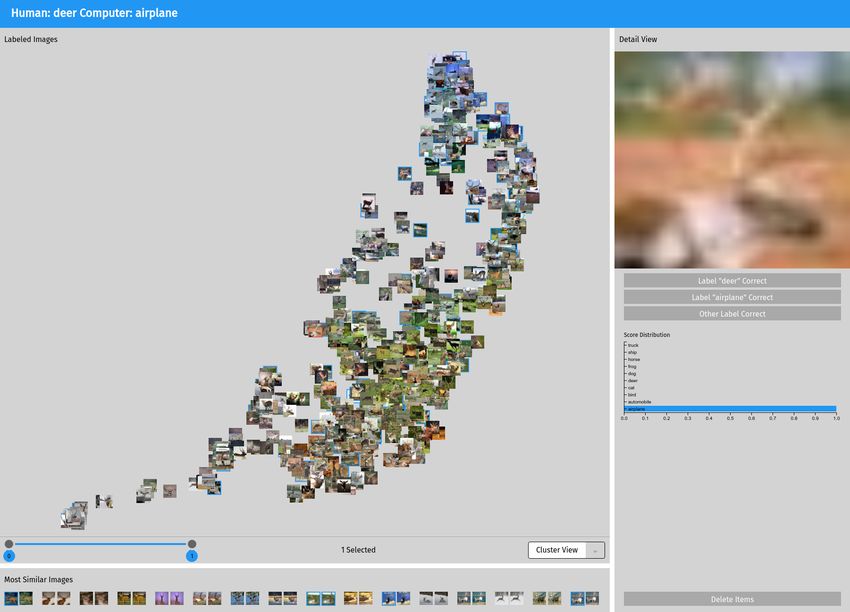
detection with interactive visual error correction (see Figure 1). To approach, instead, an inspection of the entire labeled data set would
enable the automatic detection, we have systematically categorized be necessary.
c 2020 The Author(s)
Computer Graphics Forum c 2020 The Eurographics Association and John
Wiley & Sons Ltd. Published by John Wiley & Sons Ltd.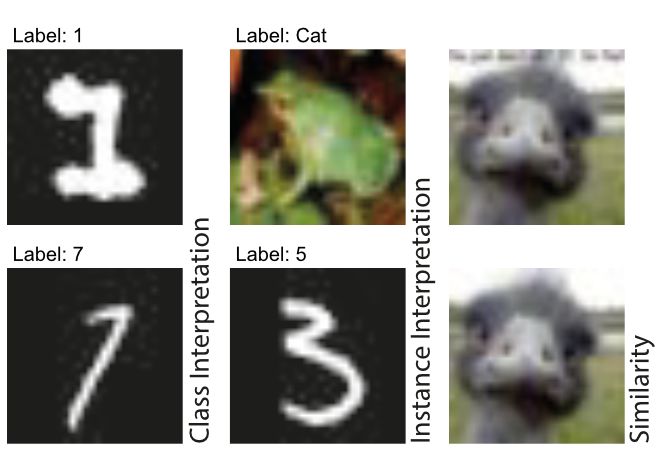
A. Bäuerle, H. Neumann, and T. Ropinski / Classifier-Guided Visual Correction

                                                                             2. Related Work
                                                                             Work on handling noisy labels for datasets can be delineated into
                                                                             two main categories. On one side, some approaches aim at inspect-
                                                                             ing datasets, often through visualization. On the other, there are
                                                                             training setups that aim at providing robust classifiers that cope
                                                                             with noisy labels. The following will provide an overview of both
                                                                             those lines of research.
                                                                             Data labeling. One area of deep learning where data labeling is a
                                                                             central aspect is active learning [Set10]. Here, candidates for label-
                                                                             ing assignments are selected, often through a query-by-committee
                                                                             strategy, where the output of several classifiers is used to inform
Figure 1: We propose a classifier-guided Automatic Error Detec-              candidate selection [SOS92]. The line of work by Bernard et.
tion for noisy labels, to visually guide the user to erroneous labels,       al. [BHZ∗ 17,BZL∗ 18,BHR∗ 19] investigates how label acquisition
which can then be inspected and corrected during the proposed Vi-            in active learning scenarios can be improved. They also employ
sual Error Correction. The two proposed components seamlessly                the classifier directly to suggest new items to be labeled and use
integrate with standard machine learning workflows, as they oper-            dimensionality reduction techniques to visualize these proposed
ate downstream from Training and Classification. After a visual              items and their distribution. What separates active learning from
inspection, the classifier can be deployed for Productive Use, or            our work is, that active learning does not aim at improving noisy
trained again to be iteratively improved through the proposed pro-           data sets, but rather works towards improving the labeling process
cess.                                                                        itself. Thus, active learning is placed before label acquisition has
                                                                             been performed, while our approach is designed to work with read-
                                                                             ily labeled data sets.
   As illustrated in Figure 1, the proposed approach can be used it-            There also exist numerous techniques to ensure a better qual-
eratively to further improve classification accuracy, whereas users          ity of crowdsourced training data while labels are being gener-
have to inspect fewer images for each subsequent iteration, as al-           ated [HKBE12,CAK17,Set11]. They use multiple workers [KH16],
ready inspected images do not require further consideration. While           provide monetary benefits for good work and specialized task
the contributions made in this paper address automatic error de-             framing [RKK∗ 11], or select workers with predefined require-
tection and visual error correction, no modifications are necessary          ments [MHG15]. All of these approaches are focused on quality
for collecting labels, or training and testing the classifier, as our        assurance while labels are acquired. Approaches to examining data
approach is to correct training data independent of the labeling or          quality after labeling through crowd services are analyzing how
training process, allowing data experts to review data sets that have        the worker interacted with the system [RK12, LCL∗ 19], or hav-
been fully labeled. This is in contrast to active learning, which mod-       ing workers review the work of other workers [HSC∗ 13]. A work
ifies the label acquisition process during training [SOS92, Set10],
as well as more recent fully automatic techniques, which modify
the training process, and also reduce the amount of training data by
sorting out noisy labels [TIYA18, LHZY18, HQJZ19]. We propose
an error correction approach that is based solely on classification
results of the trained model, and integrates seamlessly with modern
deep learning workflows without reducing the size of the training
data set.
To this end, we make the following contributions throughout this
paper:
• Categorization of label error types potentially occurring in clas-
  sification training data.
• Measures to identify error candidates by means of classifier re-
  sponse analysis.
• Interactive visual error guidance and correction by means of               Figure 2: Examples of errors we discovered by applying our tech-
  classifier result measure visualization.                                   niques to widely used machine learning benchmark data sets. On
                                                                             the left, one can see possible Class Interpretation Errors. While the
   We have realized these contributions within an interactive visual-        top one was labeled as one, the bottom one was labeled to be a
ization system, with which we were able to identify errors in stan-          seven. The frog in the center is labeled as a cat and the three as
dard machine learning benchmark data sets, such as MNIST and                 a five, thus, single instances were clearly misinterpreted. On the
CIFAR10 (see Figure 2). We have further evaluated this system,               right, one can see almost equal images. One might question if they
whereby our findings indicate, that it enables users to intuitively          should both be in the data set. (Original resolution of 32 by 32 for
clean noisy label data in order to achieve higher classification ac-         Cifar10/animals and 28 by 28 for MNIST/digits)
curacies.

                                                                                                                                                 c 2020 The Author(s)
                                                                                Computer Graphics Forum c 2020 The Eurographics Association and John Wiley & Sons Ltd.
A. Bäuerle, H. Neumann, and T. Ropinski / Classifier-Guided Visual Correction
published by Chang et. al. combines multiple of these aspects to proaches rely on modifications of said classifier to introduce fea-
ensure data quality by grouping multiple workers and letting them tures that can filter noisy labels [TIYA18, ZS18, HQJZ19]. This
interactively reason about label decisions [CAK17]. However, they introduces additional overhead and does not improve the general
do not incorporate the classifier feedback in their visualizations, label quality so that the data set remains erroneous. Others rely
which is the building block of our guidance system and can help re- on additional, clean data to filter for noisy samples [PRKM∗ 17,
duce the samples to be revisited. Additionally, their techniques are HMWG18]. These methods remove potentially noisy labels from
only applicable if all annotations are present and can be assigned the data set entirely [NNL∗ 19], or reduce the importance of poten-
to individual workers. Yet, correcting labels for readily provided tially false labels for training [RLA∗ 14, JZL∗ 17, RZYU18], which
data sets where original labelers are not accessible anymore can be might reduce diversity in the data set. Such approaches can help cir-
valuable to support already processed data sets. Current tools are cumvent some of the downsides of data sets that contain labeling
targeted more towards analyzing worker performance than correct- errors, however, they do not tackle the underlying problem. Clean-
ing already labeled data sets. However, it can often be of great value ing up data sets is still fundamental, as this is the only way a data
for domain experts to be able to validate and correct their training set can be reliably reused, shared and published. At the same time,
data themselves as sometimes the data is specific and cannot be these approaches effectively make the data set smaller, which is not
perfectly labeled by laymen. Additionally, for all of these data im- desirable. Some of these approaches also require using adjusted
provement methods in the context of crowdsourcing, one needs to classifiers, which is neither desirable nor easy to use, especially by
either hire more crowdworkers, refine the requirements or conduct data-experts who are less experienced in ML.
a separate, second task to verify the generated labels, which comes
Other authors introduce additional label cleaning networks to
with a greater investment of money and time during label acquisi-
be trained to remove or relabel potentially compromised sam-
tion [SPI08, IPSW14], and sometimes even makes crowdsourcing
ples [VAC∗ 17, LHZY18]. Han et. al. even propose to use a self
more expensive than conventional approaches [KLA17]. In these
learning approach to clean up noisy labels using extracted features
scenarios, it is therefore helpful if domain experts can review and
from the data points [HLW19], however, all these automatic ap-
resolve label errors quickly. Our approach is thus focused on cor-
proaches do not guarantee correct labels. They either reduce the
recting erroneous labels.
data set size, require modified training with another classifier, or
Visualization has been used for data cleaning in several publica- both. Additionally, they do not allow data-experts to verify their
tions, which shows how effective visualization can be when data is data sets.
to be cleaned. Kandel et. al. worked on improving data by visually
We propose an approach to improve the training data set without
exploring data sets and directly manipulating them whenever a user
having to look at every individual sample by using the classifier as a
spots a problem in the data [KPHH11, KPP∗ 12]. Gschwandtner at.
guide to mislabeled samples. Our user-centered approach does not
al. [GAM∗ 14] as well as Arbesser et. al. [ASMP16] use visualiza-
only focus on the final classifier performance, but is also targeted
tion to clean up time-oriented data. Wilkinson developed measures
at cleaning up the training data at the same time, as it does not
and visualizations to detect and inspect outliers in data sets [Wil17].
simply reweight or remove training samples. As this permanently
However, these and related [PNMK16, WGS∗ 13] tools are not tai-
corrects training data, it additionally makes the data reusable, pub-
lored towards use with machine learning data sets, which often ex-
lishable, and shareable. Also, the approach we propose can directly
ceed the amount of data used in these contexts, contain labels that
be integrated into any training process, as it does not require any
are to be corrected instead of direct data properties and offer addi-
manipulation of the classifier or additional data. Users simply use
tional guidance usable for visualization designs, such as classifica-
their trained classifier for permanent data-cleanup. It additionally
tion results.
provides insights about the training data, e.g. which classes are typ-
In a publication by Xiang et. al., visualization is directly used to ically confused, biased, or seen similar.
improve the quality of neural network training data sets [XYX∗ 19].
They use a projection of the whole high dimensional data set to de-
3. Automatic Error Detection
fine trusted items, which are then propagated to more items using an
approach by Zhang et. al. [ZZW18]. However, while this approach To be able to tailor the visual user guidance towards relevant errors
combines human interaction with network-based label correction, in labeled data sets, a characterization is required to differentiate
they do not use the network predictions as guidance to potential error types potentially occurring in such labeling scenarios. Based
errors. Similarly, Alsallakh et. al. [AJY∗ 18] developed a visualiza- on a systematic analysis of the image labeling process, we have
tion method to analyze class hierarchies in training scenarios. The identified three such error types.
purpose of this approach is to identify class hierarchies that are of-
ten confused by the classifier, and upon this knowledge, improve Whenever annotators assign an incorrect label to an image, this
the classifier or label definitions. As a side-product, they were also can stem from two fundamentally different problems. Either, they
able to find labeling errors in the data. However, their visualization just mislabel the one image at hand, while they have in general un-
design and especially the lack of tools to directly investigate and derstood the task; or they have a wrong mental image of a class, and
correct mislabeled samples shows, that this is not the main goal of thus assign incorrect labels to all data points of that class. While
their application. these are problems that occur during the labeling of data points,
another source for corrupted data sets may already be the data ac-
Robust training. One way to approach noisy data sets is to train quisition process. Similar or equal data points are sometimes added
a classifier that is robust against such noisy labels. Here, some ap- to the data set more than once, which can shift the data-distribution
c 2020 The Author(s)
Computer Graphics Forum c 2020 The Eurographics Association and John Wiley & Sons Ltd.A. Bäuerle, H. Neumann, and T. Ropinski / Classifier-Guided Visual Correction
away from real-world scenarios. While the aforementioned error-
types mostly stem from human errors, the addition of highly similar
data points can be a problem especially when automatically collect-
ing data, e.g. from online sources. To summarize, noise in training
data can be introduced when:
1. A labeler confuses two classes (Class Interpretation Error)
2. A labeler mislabels one data point (Instance Interpretation Er- Figure 3: Images from the original MNIST data set (original res-
ror) olution 28 by 28). The top row shows images labeled as one. The
3. Data points get added to the data set multiple times (Similarity bottom row contains images labeled as seven. Here, Class Interpre-
Error) tation Errors might occur, since those digits are written differently
These error types all introduce unique challenges for how to re- in the US and Europe.
solve them. Nevertheless, this categorization also enables the in-
vention of novel approaches, to guide the user to potential instances
of these errors. Therefore, to suggest further inspection of labeled candidates for Class Interpretation Errors. Thus, we analyze lbl/cls
data points, we propose the following measures for the three error combinations by the amount of missclassifications in them as:
types:
1. Class Interpretation Error Score (Equation (1))
CIESy,ŷ = |{x | x ∈ D, argmax(cls(x)) = y, lbl(x) = ŷ}| (1)
2. Instance Interpretation Error Score (Equation (2))
3. Similarity Error Score (Equation (3))
Which means that the Class Interpretation Error Score CIES
For the first two scores, we use the classification results in com- given a prediction class y and a ground truth class ŷ is defined as
bination with the labels, which might be incorrect, as the basis for the cardinality of the subset of data points x in the data set D for
computing them. The Class Interpretation Error Score is computed which the classification result cls(x) equals y and the label lbl(x)
for each label/classification (lbl/cls) subset of the data, whereas the equals ŷ. Thus, this measure is designed to analyze entire lbl/cls
Instance Interpretation Error Score is computed on individual in- subsets of the data. An interesting occurrence of this type of er-
stances. The Similarity Error Score is computed for each instance ror in the widely used MNIST data set is the interpretation of the
pair with the same classification. We assume that, although the la- North-American and European way of writing the digits ’7’ and
beled data may contain errors, the convolutional neural network ’1’, as shown in Figure 3.
(CNN) is still able to differentiate between different classes, such
that in general incorrectly labeled data points get classified into
3.2. Instance Interpretation Errors
their original class. This assumption has been tested on an inten-
tionally corrupted data set, which is described in Section 5. Since When single items in the data set get labeled incorrectly, the situa-
this makes the classification result and the original label differ, tion is more difficult, as these errors cannot be spotted by analyz-
these data points can be detected by looking at misclassifications ing the ratio of misclassifications of one lbl/cls pair. At the same
in the data set. The similarity error score instead, can be calculated time, however, they have less influence on classification accuracy
by exploiting similarity measures between training samples. As ev- as compared to Class Interpretation Errors. To provide means to
ery part of the data-split can contain errors, we classify all samples identify and remove Instance Interpretation Errors, we employ the
in the data set once after the network has been trained. This in- classification confidence as an indication for labeling errors. This
cludes train, test, and validation data, which can then subsequently works well for all probabilistic models, such as neural networks,
be corrected. In the following, we introduce these three scores and where prediction probabilities are an implicit output. When data
their computation in detail. points are misclassified confidently, they might as well be incor-
rectly labeled. This can be used to guide the user to these samples
in the data set. To enhance this guidance, we go one step further and
3.1. Class Interpretation Errors analyze the relation of the classification confidence and the classifi-
cation probability assigned to the ground-truth label of a data point.
Class Interpretation Errors are introduced when data points from
On these means, Alsallakh et. al [AJY∗ 18] state:
class a were assumed to be of class b by one, or few, of the label-
ers. This error type is conceptual, and leads to multiple or all labels [...] detecting mislabeled samples such as an image of a lion la-
assigned by one, or a few, labelers and belonging to class a ending beled as a monkey. We found such cases by inspecting misclassified
up with the wrong label b (e.g., labelers considering gooses to be samples having high prediction probability and low probability as-
ducks throughout the entire data set). However, as long as the ma- signed to the ground-truth.
jority of data points are correctly labeled, our presented approach
We, therefore, propose the following measure to guide users to
is able to guide to these errors, as the classifier will still be able
these error types:
to correctly classify most of the data points with incorrect labels,
see Section 5. Fortunately, the fact that multiple data points are la-
beled incorrectly makes Class Interpretation Errors easy to detect. max(cls(x)) + (1 − cls(x)ŷ )
We make use of the amount of resulting misclassifications to find IIESx = (2)
2
c 2020 The Author(s)
Computer Graphics Forum c 2020 The Eurographics Association and John Wiley & Sons Ltd.A. Bäuerle, H. Neumann, and T. Ropinski / Classifier-Guided Visual Correction
Here, we calculate the Instance Interpretation Error Score IIES expert revision, which our approach is targeted towards, even more
for a data point x as the normalized relation between the class that important.
the classifier assigned the highest classification probability to, and
the probability the classifier assigned to the ground-truth label ŷ. By calculating the measures presented in this section, we are
Thus, this score provides guidance on an individual instance level. able to analyze the training data set and extract potential labeling
This score is used as an indicator for how certain the classifier is errors using only the trained classifier. In our visual error correc-
wrt. the misclassification of a data point, and can be used to recog- tion approach, we make use of the suggested error characterization
nize potential labeling errors. Applying this approach to the widely and treat these three error types differently, both, by calculating
used Cifar10 as well as the MNIST data set, revealed previously specialized error measures, and employing tailored visual guidance
unknown labeling errors, which we discuss in Section 5. systems.
3.3. Similarity Errors 3.4. Workflow Integration
When data points occur more than once in the labeled data set, As we exploit a pre-trained classifier for error detection, a few con-
this can lead to an unintended shift away from the real-world data siderations need to be made in order to integrate our approach into
distribution. Such errors can be introduced when data points are a standard classification workflow. Before analyzing the data set,
taken from online sources or when an overview of the data set is the classifier needs to be trained. Here the classifier and the train-
not always present during data acquisition. It is important to dif- ing process do not need to be altered at all. The user can then rein-
ferentiate between intentionally augmented data and data points spect misclassified samples based on our proposed visual guidance.
that might over-represent certain features during training, as data- Additionally, if the number of data points to be reinspected is too
augmentation can lead to better training results. However, having small, experienced users can employ strict regularization or early
multiple similar data points unintentionally in the labeled data set stopping if they intend to control the number of training samples
can compromise the training results in multiple ways. When they to reinspect, as the classification accuracy directly influences this
are in the training set, a higher priority is assigned to this repre- number. To be able to use the classification results as guidance to-
sentation, which can lead to bias, where some features are consid- wards possible errors, we assume that the network still has enough
ered more important than other features. This is a problem when correctly labeled data to learn from, and guide the user towards in-
this over-representation is not expected in the productive use of the correct labels. While this assumption is likely to be true for most
classifier. When, in contrast, several instances are in the validation scenarios, if the data set is too small or contains too much noise, our
data set, validation accuracy has a higher variation depending on approach will not function anymore as it relies on the classification
the correctness of the classification of these data points, which in results of the neural network.
turn might compromise the performance measure of the classifier.
If similar data points exist across training and validation data sets, To then get an idea about which items should be inspected again,
validation is performed on data points that the classifier has been all samples in the data set are classified once using the trained clas-
trained on, which can also compromise validation results, and at sifier. In a typical neural network setting, this would include train-
the same time introduce bias to the training data. Gladly, guiding ing, test, and validation data, as all of them can contain errors. It is
users to similar data points is also possible, as similarity measures important to note that no evaluation of the model or further training
can be computed for each pair of elements in the data set that are is done at this point, so the data-split or training setup is not cor-
assigned the same classification result: rupted in any way. This way, each data point is assigned a probabil-
ity distribution over all classes. We then present only misclassified
samples through our visual guidance approach which we introduce
SESx1 ,x2 = sim(x1 , x2 ), f or x1 , x2 ∈ M in the next section. This way, the user has to look at far fewer items
than if they would have to inspect all data points again. Our evalua-
M := {x1 , x2 ∈ D | x1 6= x2 , argmax(cls(x1 )) = argmax(cls(x2 ))} tion shows that this approach works well even when a large number
(3) of incorrect labels are present (see Section 5).
The Similarity Error Score SES for a pair of data points x1 , x2
can be obtained using similarity measures, which exist for many 4. Visual Error Correction
types of data. The SES is calculated for all pairs of data points in
the data set D that were classified into the same class, whereas the While obtaining potential error candidates, as described above, is
sim function represents a similarity measure for two data points. essential for improving training data sets, only through visual guid-
For images, this function could be the Structural Similarity Index ance users can detect potential errors, and reason about them. Our
Measure (SSIM) [WBSS04]. While proposing candidates with this visual guidance approaches help to do this for all three error types
measure is not complex, Similarity Errors require the most expe- that typically occur in labeling processes. Once errors have been
rience of all error types to be resolved, as highly similar images reasoned about, they can directly be resolved. Again, the visual cor-
are not always a problem for training a classifier. They are only rection of data points, which involves the user tasks of detecting,
harmful if either, they do not represent the real-world distribution, reasoning about, and resolving potential errors, should be in line
or, if they originate from both the training and validation data sets with the error types we propose. This interplay of user tasks and
because then, validation does not test generalizability. This makes error types is shown in Table 1.
c 2020 The Author(s)
Computer Graphics Forum c 2020 The Eurographics Association and John Wiley & Sons Ltd.A. Bäuerle, H. Neumann, and T. Ropinski / Classifier-Guided Visual Correction
Table 1: User tasks involved when improving training data. The user has to first, detect potential errors, then try to reason them, before
he/she can resolve them. The table shows how these tasks are completed for the three identified error types.
Class Interpretation Error Instance Interpretation Error Similarity Error
Detect Many samples misclassified from a to b Samples confidently misclassified Similar/ identical samples
Reason Error or bad classifier performance? Error or bad classifier performance? Error or intentional?
Resolve Reassign multiple labels Reassign individual label Remove item
4.1. Error Detection We propose a visualization approach that employs a modified
version of confusion matrices. To search for possible Class Inter-
Through the error measures we propose, it is possible to support
pretation Errors, users need to be able to investigate lbl/cls com-
users through visual guidance to the most critical items in the data
binations containing many misclassifications. We support this re-
set. For all three error types, users should have indications of which
quirement by sorting matrix cells based on the number of data
data points to review. In Section 3, we showed how candidates for
points they contain, while the distribution of Instance Interpretation
these error types can be extracted from the data set based on clas-
Scores is displayed within each cell. We first sort by the number
sification results. Thus, the user should be guided to lbl/cls pairs
of misclassifications across different labels (rows), before sorting
that contain a large number of misclassifications for Class Inter-
classification results within each label (columns). This places the
pretation Errors. For Instance Interpretation Errors, they should see
most critical classes at the top of this matrix. Additionally, we omit
which samples have been most confidently misclassified. Addition-
cells that do not contain any items, which removes unnecessary
ally, users should be given an indication of where to find very sim-
clutter and makes the visualization more sparse. In our implemen-
ilar images to be able to resolve Similarity Errors. In the following,
tation, we also highlight lbl/cls combinations with many misclas-
we present visual guidelines that support all of these requirements.
sifications in blue, where the saturation of this color depends on
To give users an overview of those measures, we propose a visual-
the number of samples. This guides the visual attention of users
ization of the data set that contains information about the amount,
directly to these, most critical lbl/cls combinations.
probability distribution, and similarity score for each lbl/cls pair. In
line with our approach of guiding the user only to samples that the To also embed the IIES-distribution of those misclassifications
network misclassified, and thus might be labeled incorrectly, we in this overview, which is helpful for spotting potential Instance In-
only highlight misclassifications in this view, while correct classi- terpretation Errors, we propose to show this distribution using hor-
fications are depicted in the leftmost column. The resulting visual- izontal bar-charts within each list item. Here, the y-position of the
ization can be seen in Figure 4. bars represents the IIES-distribution scaled from 1.0/num_classes
(lowest bar) to 1.0 (top bar) while the length of the bars signals the
number of items in an IIES-range.
The third user guidance system, which shows if similar items
are present in a lbl/cls combination, is indicated by a duplicate icon
within cells that contain highly similar data points. With these vi-
sual indicators across the entire data set, this view serves as an
overview that guides users to all three error types we defined in Sec-
tion 3.
Traditional approaches, such as confusion matrices [AJY∗ 18,
KH09] or the confusion wheel [AHH∗ 14], which are commonly
used to provide such an overview have major limitations for the task
of spotting potential errors in the labeled data set. Confusion ma-
trices always require understanding and combining both, the label
and the classification axis, which proved to be too complex for de-
picting the source and destination for misclassifications when pre-
sented to domain experts [RAL∗ 17]. At the same time, most of the
confusion wheels screen real estate is taken up by class overviews
and it provides no clear entry point. This renders both of these vi-
sual approaches suboptimal for guiding users to potential errors in
Figure 4: The list view of classifications shows problematic lbl/cls the data set, which our approach is explicitly designed for.
combinations at a glance. The number of misclassifications for
each cell is encoded in the blue background. The red horizontal
bars in each cell show, how confidently the images have been mis- 4.2. Error Reasoning
classified as computed through Equation (2). Visual separation of
rows makes clear, that this list should be read from left to right. On When the user decides to inspect a potentially problematic lbl/cls
the left, one can see cells for correctly classified samples. combination, they naturally want to inspect individual data points
and the distribution of data points in this subset of the data. This
c 2020 The Author(s)
Computer Graphics Forum c 2020 The Eurographics Association and John Wiley & Sons Ltd.A. Bäuerle, H. Neumann, and T. Ropinski / Classifier-Guided Visual Correction
way, they can reason about the potential errors to decide if they are data points should also be permanently removable from the data
problematic, and should be acted upon. To inspect one such lbl/cls set. To enable a correction, confirmation, and removal of labels for
combination in detail, users select one of the items in our overview data points, we show actionable buttons on the lower right of the
visualization. GUI (see Figure 6). Whenever data points are selected and subse-
quently resolved using these buttons, all visualizations are updated
Reasoning about potential errors includes comparing samples,
as resolved data points are removed from all guidance measure cal-
and extracting outliers as well as investigating similar samples for
culations and visualizations. The effect of this can be seen in Fig-
a lbl/cls combination. Thus, we propose to guide the user by visu-
ure 5. Thus, by resolving error candidates, users can interactively
alizing similarity-based embeddings of the selected lbl/cls combi-
process the visualizations and work their way through the data set
nation. Therefore, to inspect Instance Interpretation Errors, as well
until all error candidates are resolved, and thus removed from the
as Class Interpretation Errors, dimensionality reduction techniques
guidance approach.
that preserve high-dimensional relations are helpful. If many sim-
ilar items have been misclassified, users can quickly reason about After one iteration of data-correction has been completed, users
potential Class Interpretation Errors as these items, which differ can reiterate and restart the process by training a new classifier on
from plain misclassifications, will cluster when dimensionality re- the partially cleaned data set (see Figure 1). With training a new
duction is applied. On the other hand, outliers can be an indica- classifier, proposed error candidates may change, and new error
tion for Instance Interpretation Errors, as can be seen in Figure 5. candidates can be inspected. For subsequent iterations, our pro-
When dealing with images, we propose to use UMAP [MHM18] to posed measure calculation and user guidance can thus be kept as
show clusters of data points, as well as outliers in this lbl/cls com- is, with the exception that all previously relabeled, removed, or
bination, which can be seen in Figure 6. Here, either direct image confirmed data points are not included in the guidance system any-
pixels can be used as projection features. An even more sophisti- more, as they have already been resolved.
cated approach, which we used to generate these projections is, to In our approach, users are guided to confident misclassifica-
use saliency visualizations of those images as a projection basis to tions, large quantities of misclassifications, and almost equal im-
also incorporate what the model looks for in these images. While ages through a data set overview, which helps to investigate poten-
labeling errors will not always be projected as outliers, users can tial errors. To reason about error candidates, clustering mechanisms
iteratively remove items from the visualizations by confirming or and outlier visualization are of great help. It is also essential to di-
changing their labels, which eventually reveals label errors. How- rectly be able to act upon inspected items to remove them from the
ever, if there are few data points, or the user wishes to scan the data process. Through the translation of the three user tasks of detecting,
sequentially, there is also the option to switch to a grid-based view reasoning about, and resolving potential labeling errors into our vi-
on the items. To also support the inspection of Similarity Errors, sualization guidelines, this approach can be implemented to fit any
the most similar images per /c combination should additionally be classifier as well as data type to be cleaned. Thus, our approach en-
presented to the user. In our implementation, those data points are ables a user-centered data cleaning that utilizes the trained classifier
shown below the projection-view. to propose error candidates. The proposed visual design directly
Apart from showing data points with dimensionality reduction follows the principles of our approach to resolve the error types
or sorted by similarity, their properties should also be inspectable we introduced in Section 3, and obeys to the user tasks we defined
in detail individually. This can further help to decide upon whether for the visual correction process. Our implementation along with
a proposed error candidate was indeed labeled incorrectly. Thus, the user-study which we present in Section 5 shows, that our con-
in our proposed visualization approach, the final reasoning step on cepts are applicable to network-supported data-cleanup, and could
an individual data point level should be performed by selecting in- be adopted in many application scenarios.
dividual samples to view them in detail. Additionally, for selected
items, we show the probability distribution that stems from the clas- 5. Evaluation
sifier response to provide the user with another tool to reason about
a potential labeling error. In our implementation, enlarged images To test the proposed approach, we implemented a web-based ap-
and classifier responses are shown on the right of the projection plication that realizes the proposed visualizations, and focuses on
view (see Figure 5). image data in combination with CNNs as classifiers. The general
idea of using the classifier as a guide to potential labeling errors
While each of these visual guides is targeted towards satisfying is, however, not limited to such data or classification algorithms.
a specific user-need, in combination, they provide the visual tools The following will present both, the application of our approach to
necessary to reason about the three error types we propose. renowned data sets, as well as a user study that tests the applicabil-
ity of our approach.
4.3. Error Resolving
5.1. Analyzing Benchmark Data Sets
The final step in our proposed iterative data-correction approach is
Using our approach, we were able to spot errors in well-known
resolving potential errors that have been found within the data set.
machine-learning benchmark data sets. Here, we analyzed both, the
Once error candidates have been reasoned about, it is important to
Cifar10 [KH09], and MNIST [LC10] data sets.
directly be able to resolve them. This can mean assigning new la-
bels, but also confirming labels that are correct to remove items MNIST. The MNIST data set [LC10] is one of the most popular
from the error correction process. For resolving Similarity Errors, machine learning benchmark data sets. It contains greyscale im-
c 2020 The Author(s)
Computer Graphics Forum c 2020 The Eurographics Association and John Wiley & Sons Ltd.A. Bäuerle, H. Neumann, and T. Ropinski / Classifier-Guided Visual Correction
Figure 5: UMAP [MHM18] projection of the label cat and classification frog. One can see that dimensionality reduction helps to spot
outliers in these lbl/cls combinations. The red arrows were added to indicate the position of the frog image. The three subsequent steps
during interactive isolation of the frog wrongly labeled as cat show how after removing some data points, reprojecting the remaining data
helps to isolate outliers. By iteratively removing outliers and through the nondeterministic nature of UMAP, the frog is embedded further
away from the cats. (Images are from Cifar10, original resolution 32 by 32)
ages of handwritten digits from zero to nine with a size of 28 by ization allowed us to only look at these images as potential errors.
28 pixels. We used a simple architecture for training a CNN on that Thus, instead of looking at all 70,000 images in a file explorer, we
data set. It consisted of two convolutional layers, each followed by had to look at only 490 misclassified images through a guided pro-
a max-pooling layer. For obtaining classification results on top of cess.
this embedding, one dense layer was used, followed by a dropout When looking at the classes seven and one, some samples are al-
layer and the final softmax layer. Our classifier reached an accuracy most impossible to distinguish while being from different classes.
of 99.3 percent. To review the data, we then inspected label clas- This can be seen in Figure 3. Here, different cultural interpretations
sification pairs marked as suspicious in the overview visualization. of said classes might lead to Class Interpretation Errors. We found
Since only 0.7 percent of the data set was misclassified, our visual- that the US-American versus European writing style of these digits
might introduce problems to this data set. We also discovered in-
dividual instances that are mislabeled in the MNIST data set. Fig-
ure 2 shows a data point that clearly shows a three, but was labeled
as a five. More of such examples can be found in our supplementary
material.
Cifar10. The Cifar10 data set [KH09] consists of 32 by 32 pixel
colored images from ten different classes. The model used for train-
ing on this data set was built by two blocks, each containing two
convolutional layers followed by a pooling and a dropout layer.
This was then followed up by two dense layers each also preceding
a dropout layer, before the final softmax classification layer was
added. With this intentionally simplistic network, we reached an
accuracy of 77.13 percent, which is representative of real-world
training scenarios on new, domain-specific data sets. Even with the
classification comparably low accuracy we reached, we only had to
look at 22.87 percent of the data.
As can be seen in Figure 5, for Cifar10, we were able to spot an
image that was incorrectly labeled as cat, while showing a frog.
When performing an in-detail inspection of the lbl/cls combination
Figure 6: After gaining an overview of the classification results, of the label cat and the classification frog, we found this incorrectly
the user can inspect the content of individual cells to analyze clas- labeled image by iteratively removing outliers from the embedding
sification results in detail. Images are embedded by applying pro- visualization. Additionally, we found a set of very similar bird im-
jection, e.g. UMAP. Filtering can be done by selecting IIES ranges. ages as shown in Figure 7. While this is not a clear error in the data
Once one or more images have been selected, the according proba- set, having multiple highly similar images of an ostrich in this data
bility distribution is visualized. Using the buttons on the right, users set is at least debatable.
can change or confirm the label of the selected images. (Data set:
Cifar10, resolution of images 32 by 32) Our approach is generally targeted towards domain-experts that
get their data labeled and then train a classifier on that data or use
c 2020 The Author(s)
Computer Graphics Forum c 2020 The Eurographics Association and John Wiley & Sons Ltd.A. Bäuerle, H. Neumann, and T. Ropinski / Classifier-Guided Visual Correction
With our similarity guidance, all participants were able to resolve
all duplicates. We mainly attribute this to our visually prominent
similarity indicators in the data set overview, and the fact, that the
Figure 7: At the bottom of our in-detail visualization, we show most similar items in a lbl/cls combination are shown separately
pairs of similar images. The user can then decide whether these when inspecting such combinations in detail. On average, every
should stay in the labeled data set (e. g. in cases where data aug- participant changed the labels of 2,902 images, of which only 27.5
mentation is used) or if they should be removed (in case of un- were incorrectly changed. They thus managed to bring the num-
wanted duplicates). The images show five similar images of a bird ber of incorrect labels down by 85.65 percent on average. This is a
discovered in the Cifar10 data set (original resolution 32 by 32). reduction to 477 errors from 3,330 after only one iteration of our
approach. We then used the corrected data sets to train the clas-
sifier once again for each participant. On average, the validation
accuracy rose to 99.05 percent, which shows the enormous impact
online services such as AutoML [Goo19] for training classifiers. of such data-cleanup. This shows the applicability of our approach
Here, these control mechanisms are even more important, as data to cleaning noisy labeled datasets.
quality can be worse than in benchmark datasets. However, the fact
Looking at the images that we initially considered as incorrectly
that we were even able to find errors in two of the most popular
changed also provided an interesting insight. When investigating
benchmark data sets in the machine learning community shows
them, we found that some of them seemed to be mislabeled in the
how important approaches as the one we propose are.
original data set. The participants thus found new errors in the well-
established MNIST data set by using our approach. Examples of
5.2. Qualitative Evaluation these errors are included in the supplementary material.
Based on our implementation, we additionally conducted a qualita- To also evaluate the usability of our techniques, we asked the par-
tive study to test the applicability of our approach. In our user study, ticipants to rate the helpfulness of our approach. They had to rate
10 participants had to find and resolve errors in a labeled data set. the helpfulness of the visualizations from one, not helpful at all, to
Participants were recruited in a university setting, whereby out of five, helped a lot, all of them rated the visualizations between four
the 10 participants, only two had experience with neural networks and five, with an average of 4.4. When asked what they found most
and none of them had seen or heard of our approach before. This helpful, most of them said the overview guidance approaches were
shows, that no ML background is needed to use our visualization helpful for spotting errors in the data set. Some additionally men-
guidelines. tioned that it is also essential to be able to inspect individual sam-
ples for resolving errors. When asked what was bad and could be
To generate a setup in which we could recruit participants in a improved, many said that the latency was a problem. This, however,
university setting while still reflecting a real-world scenario, where was a problem specific to the study setup and not to our approach
data-experts would correct their noisy data set using our approach, perse.
we chose to use the MNIST data set in our study. This dataset re-
quires no prior knowledge to review, as it consists of hand-drawn As all participants were able to improve the data set by a large
digits, which anyone can identify. To be able to verify which items margin and thus greatly improve classification accuracy, this study
have been changed by a participant, we corrupted the data set by shows that our proposed approach can, in fact, be a valuable tool to
introducing five errors of each type. For Class Interpretation Er- clean up labeled data. Also, as our participants stated, our guidance
rors, we changed 1,400 images from nine to six, 700 images from system helps users focus on critical training samples which greatly
one to four, 700 images from three to one, 350 images from eight reduces samples that need to be reinspected.
to two and 175 images from seven to three. For Instance Interpre-
tation Errors, we changed the labels of five images from different 6. Limitations
classes. With this, we tried to reflect real-world scenarios, where
Currently, the approach we present within this work is limited to
CIEs would introduce many more incorrect labels than IIEs. Sim-
classification problems. For other problems, different error mea-
ilarity Errors were introduced by duplicating five images. In this
sures, as well as visual guidance systems, would have to be in-
study, we told the participants to remove all duplicates, as reason-
vented, which remains an open research question. Additionally, the
ing about if they are actually harmful could not be done in this
error types we present within this paper cannot be applied out-
setting. In total, we introduced 3,330 mislabeled images and five
side the domain of classification problems. While our approach
duplicates.
is model-agnostic and does not depend on the data that is used,
We then trained on this data set and visualized the results using the exemplar implementation we provide is focused on image-
our implementation. The classification accuracy for this manipu- data in combination with CNNs. We propose three types of er-
lated data set was at 94.37 percent, hence, participants were only rors, which our analysis of labeling processes suggests are most
presented the 5.63 percent that were misclassified. This equals to common. However, one could think of other error cases, for exam-
about 4,000 out of the 70,000 images. We provided a short in- ple, if a labeler assigns completely random labels to all images. We
troduction of about 10 minutes which showed our idea for data- did not include such error cases, as most of them could be filtered
cleanup and explained the task, which was to resolve as many er- by traditional quality assurance methods. Nontheless, investigating
rors as possible in 15 minutes. We then let them use the approach and handling other potential labeling errors remains an open chal-
we propose in this paper to resolve all errors they spotted. lenge. Also, while matrix views are a common metaphor for getting
c 2020 The Author(s)
Computer Graphics Forum c 2020 The Eurographics Association and John Wiley & Sons Ltd.A. Bäuerle, H. Neumann, and T. Ropinski / Classifier-Guided Visual Correction
an overview of classification results for a data set, and our proposed [BHZ∗ 17] B ERNARD J., H UTTER M., Z EPPELZAUER M., F ELLNER
matrix is even more condensed than others, it cannot scale indefi- D., S EDLMAIR M.: Comparing visual-interactive labeling with active
nitely. We tested our approach with data sets containing up to more learning: An experimental study. IEEE transactions on visualization and
computer graphics (2017). 2
than 20 classes. A data set with 22 different classes containing an-
imal skull X-Ray images, can be seen in our supplementary mate- [BZL∗ 18] B ERNARD J., Z EPPELZAUER M., L EHMANN M., M ÜLLER
M., S EDLMAIR M.: Towards user-centered active learning algorithms.
rial. Yet, for data sets that contain even more classes, matrix views In Computer Graphics Forum (2018), vol. 37, Wiley Online Library,
are not optimal. In this case, users would have to look at a subset of pp. 121–132. 2
classes rather than viewing the whole class-pool right away. How-
[CAK17] C HANG J. C., A MERSHI S., K AMAR E.: Revolt: Collaborative
ever, this is a general research question and is not tied only to our crowdsourcing for labeling machine learning datasets. In Proceedings
approach. of the 2017 CHI Conference on Human Factors in Computing Systems
(2017), ACM, pp. 2334–2346. 2, 3
[GAM∗ 14] G SCHWANDTNER T., A IGNER W., M IKSCH S., G ÄRTNER
7. Conclusion J., K RIGLSTEIN S., P OHL M., S UCHY N.: Timecleanser: A visual an-
alytics approach for data cleansing of time-oriented data. In Proceed-
After introducing the problems that mislabeled training data for ings of the 14th international conference on knowledge technologies and
classification algorithms bring with them, we formulate a novel data-driven business (2014), pp. 1–8. 3
categorization of error types that typically occur in labeling settings [Goo19] G OOGLE: Cloud AutoML BETA: Train high-quality custom
for classification tasks. While there are other approaches that aim at machine learning models with minimal effort and machine learning ex-
improving noisy labels in training data, ours introduces the concept pertise. https://cloud.google.com/automl/, October 2019.
of using the trained classifier as a support for resolving these three [Online; accessed 29-October-2019]. 9, 10
different error types. The proposed visual correction approach can [HKBE12] H EIMERL F., KOCH S., B OSCH H., E RTL T.: Visual classi-
be performed at any point in the lifetime of a training data set, and fier training for text document retrieval. IEEE Transactions on Visual-
ization and Computer Graphics 18, 12 (2012), 2839–2848. 2
permanently and reliably improves training data sets after the la-
beling process has been finished. Contrary to other approaches, our [HLW19] H AN J., L UO P., WANG X.: Deep self-learning from noisy
visual error correction tightly couples automated approaches with labels. arXiv preprint arXiv:1908.02160v2 (2019). 3
user interaction to ensure data quality. To model this visual cor- [HMWG18] H ENDRYCKS D., M AZEIKA M., W ILSON D., G IMPEL K.:
rection approach, we define the user-tasks of first, detecting errors, Using trusted data to train deep networks on labels corrupted by severe
noise. In Advances in neural information processing systems (2018),
then, reasoning about them, and finally resolving them, which users pp. 10456–10465. 3
typically perform for cleaning up data sets. Our method fits espe-
[HQJZ19] H UANG J., Q U L., J IA R., Z HAO B.: O2u-net: A simple noisy
cially well into the context of crowdsourced data-labels. With the
label detection approach for deep neural networks. In Proceedings of the
ongoing automation of data acquisition, as well as classifier train- IEEE International Conference on Computer Vision (2019), pp. 3326–
ing, we imagine such data-cleanup techniques to be picked up in 3334. 2, 3
these contexts. Our approach could be a candidate to be plugged in [HSC∗ 13] H ANSEN D. L., S CHONE P. J., C OREY D., R EID M.,
directly into services such as AutoML [Goo19], where labels and G EHRING J.: Quality control mechanisms for crowdsourcing: peer re-
classifiers can be obtained automatically, and correctly labeled data view, arbitration, & expertise at familysearch indexing. In Proceedings
is crucial. of the 2013 conference on Computer supported cooperative work (2013),
ACM, pp. 649–660. 2
[IPSW14] I PEIROTIS P. G., P ROVOST F., S HENG V. S., WANG J.: Re-
Acknowledgments peated labeling using multiple noisy labelers. Data Mining and Knowl-
edge Discovery 28, 2 (2014), 402–441. 3
This work was funded by the Carl-Zeiss-Scholarship for PhD stu- [JZL∗ 17] J IANG L., Z HOU Z., L EUNG T., L I L.-J., F EI -F EI L.: Men-
dents. tornet: Learning data-driven curriculum for very deep neural networks
on corrupted labels. arXiv preprint arXiv:1712.05055 (2017). 3
[KH09] K RIZHEVSKY A., H INTON G.: Learning multiple layers of fea-
References tures from tiny images. 6, 7, 8
[AHH∗ 14] A LSALLAKH B., H ANBURY A., H AUSER H., M IKSCH S., [KH16] K AIRAM S., H EER J.: Parting crowds: Characterizing divergent
R AUBER A.: Visual methods for analyzing probabilistic classification interpretations in crowdsourced annotation tasks. In Proceedings of the
data. IEEE transactions on visualization and computer graphics 20, 12 19th ACM Conference on Computer-Supported Cooperative Work & So-
(2014), 1703–1712. 6 cial Computing (2016), ACM, pp. 1637–1648. 2
[AJY∗ 18] A LSALLAKH B., J OURABLOO A., Y E M., L IU X., R EN L.: [KLA17] K HETAN A., L IPTON Z. C., A NANDKUMAR A.: Learning
Do convolutional neural networks learn class hierarchy? IEEE transac- from noisy singly-labeled data. arXiv preprint arXiv:1712.04577 (2017).
tions on visualization and computer graphics 24, 1 (2018), 152–162. 3, 1, 3
4, 6
[KPHH11] K ANDEL S., PAEPCKE A., H ELLERSTEIN J., H EER J.:
[ASMP16] A RBESSER C., S PECHTENHAUSER F., M ÜHLBACHER T., Wrangler: Interactive visual specification of data transformation scripts.
P IRINGER H.: Visplause: Visual data quality assessment of many time In Proceedings of the SIGCHI Conference on Human Factors in Com-
series using plausibility checks. IEEE transactions on visualization and puting Systems (2011), pp. 3363–3372. 3
computer graphics 23, 1 (2016), 641–650. 3
[KPP∗ 12] K ANDEL S., PARIKH R., PAEPCKE A., H ELLERSTEIN J. M.,
[BHR∗ 19] B ERNARD J., H UTTER M., R ITTER C., L EHMANN M., H EER J.: Profiler: Integrated statistical analysis and visualization for
S EDLMAIR M., Z EPPELZAUER M.: Visual analysis of degree-of-interest data quality assessment. In Proceedings of the International Working
functions to support selection strategies for instance labeling. 2 Conference on Advanced Visual Interfaces (2012), pp. 547–554. 3
c 2020 The Author(s)
Computer Graphics Forum c 2020 The Eurographics Association and John Wiley & Sons Ltd.You can also read