Comments on Second Quarter 2021 - Cobas Asset Management
←
→
Page content transcription
If your browser does not render page correctly, please read the page content below

Comments on Second Quarter 2021

Dear Investor:                                                                 We expect this positive evolution to continue, as histori-
                                                                               cally, when stocks trading at low multiples start to per-
The second quarter continued the positive performance                          form positively, they do so for a long period of time. This
we have been seeing in our funds since the discovery of                        is reflected in the table below, where both the average
the Covid vaccines. We have been saying that our compa-                        duration of the relative positive performance versus
nies, and the value sector in general, have little to do with                  growth companies, 62 months, and the degree of that per-
the opening of economies, but this is the reality we have                      formance, +138%, are very strong.
to live with in the short term.

                 Table 1. Favourable periods for Value Investing, last 50 years
                                                                                                  Relative
                          Cycle                            Value 1           Market    2          Return             Months

                          Jul. 73 - Mar. 78               143.8%               7.6%                127.2%               57
                          Dec. 80 - Aug. 88               414.7%              150.3%               264.4%               93
                          No. 90 - Aug. 95                248.4%              117.1%               131.3%               58
                          Mar. 00 - Feb. 07               190.6%               13.7%               176.9%               84
                          Dec. 08 - Jun. 14               250.3%              142.8%               107.5%               67
                          Feb. 16 - Jan. 17                40.2%               19.6%                20.6%               12
                          Average                         213.2%              75.2%                138.0%               62
                         Source: Sanford C. Bernstein & Co., Pzena analysis.
                         Notes: 1.Cheapest quintile by price - book value of approximately the 1,000 largest companies in the
                         US market (equally weighted data). 2. Data weighted by capitalization.

Comments on Second Quarter 2021                                                                                                       2
As always, we do not know for sure if this will be the case   nal Portfolio close to those highs.
this time, but we are optimistic about this evolution, as
we understand that in the end cash generation is the          This quarter we comment on the evolution of the oil
only factor that counts in the long-term evolution of         sector, an essential sector for our lives in 2021 and possi-
share prices. In our case, this quarter we had more oppor-    bly in 2040, despite its continued demonization. (In this
tunities to rotate the portfolios (we sold companies that     regard, we recommend the latest book published by
have performed well, replacing them with others with          Value School: “The Moral Question of Fossil Fuels”, by Alex
greater upside) which, together with the good performan-      Epstein, which gives us an interesting and accurate pers-
ce of the companies, has allowed us to increase the target    pective on the subject). We have slightly increased our
value of the funds, placing the estimated value of the        exposure to it, accounting for just over 11% of the Interna-
Iberian Portfolio at historical highs, and the Internatio-    tional portfolio and 15% of the Iberian portfolio.
Illustration: Daniel Gete.

  3                                                                                 Comments on Second Quarter 2021

OIL (& GAS)

Demand
Demand before Covid was 100mn barrels/day (growing by
more than 1mn barrels/day each year), levels that are
expected to be reached again during 2022. Thereafter,
continued growth is expected, probably less than seen in
previous years, but growth nonetheless.

The most likely scenario in the medium term is that the
sector's demand will continue to increase at least until
the end of the decade, supported by the increase in popu-
lation and economic growth, due to the development of
emerging economies (for example, experts from the Ber-
nstein analysis house suggest around 108mn barrels in
2030). It should be remembered that, although consump-
tion for transport will be reduced in developed countries,
certain industries (petrochemicals, for example) will
maintain sustained growth over the coming decades. In
transport, although it is foreseeable that the increased
penetration of the electric car will reduce its demand
from the second part of this decade onwards, it does not
seem feasible that it can be replaced in ships or aircraft
Photo: James Jones, Shutterstock.

Comments on Second Quarter 2021                              5

Figure 1. Long term oil demand (EV scenario)
                            Total Oil Demand (before EV & FC impact)                          Evs as % of fleet                    Evs as % of sales
                            Net Gasoline (after EV impact)             Diesel          Jet Fuel            Petchem                Other           Residual

                   180                                                                                                                                       100%

                   160

                   140                                                                                                                                       80%

                   120
                                                                                                                                                             60%
                   100

                    80
                                                                                                                                                             40%
                    60

                    40
                                                                                                                                                             20%
                    20

                     0                                                                                                                                       0%
                     1970   1975   1980   1985   1990   1995   2000   2005   2010   2015   2020   2025E   2030E   2035E   2040E   2045E   2050E   2055E   2060E

Source: Bernstein Global Metals & Mining Rapid Adoption Unit Share EV scenario; IEA; IMF; World Bank; OECD; BP; OICA; EEA; BTS; Bernstein analysis and estimates

over the next few years. Diesel is not only consumed by                                    its mass use, will take more years, or at least that is what
some cars, but mainly by heavy-duty vehicles, such as                                      we foresee today. To conclude, even in more conservative
trucks, industrial machinery, mining, construction, etc.,                                  scenarios than the one outlined above, it seems likely
where a massive substitution by another technology is                                      that demand will be reasonably stable at around 100Mn
not foreseeable in the coming years. Any alternative, and                                  barrels/day by the end of this decade.

 5                                                                                                                            Comments on Second Quarter 2021
Supply                                                              efficient market, the price also fell rapidly. In the short term,
The last ten years have been characterised by the increase in       there was this gap between supply and demand, which
production from US shale oil, which has been covering a             further exacerbated the trend of falling investment that had
large part of the increases in demand that have occurred            already been occurring in the sector.
during this period (1 million barrels per day).
                                                                    From now on, the lack of investment may lead to supply
In 2014 - 2015 there was a greater increase in supply than in       problems in the medium term:
demand, due to the intensification in the supply of shale oil           • Demand will grow again, as we have seen.
production, which caused the price of oil to fall (from around         • Funding for new investment has been drastically redu-
$100/bbl to $30/bbl in 2016). OPEC, to protect itself, instead of      ced, especially in the US shale, where despite the recent
defending prices and lowering production, decided to increa-           rise in oil prices, 60% fewer wells are being drilled than
se production to defend its market share, as it had a much             two years ago. This decline in the number of wells drilled
lower marginal production cost. Faced with this scenario, oil          has meant a drop in production of around 2Mn barrels
companies began to reduce investment in exploration and                this year (13mn barrels/day produced in 2019 vs 11Mn
production of new oil fields and a period of "drought" in oil,          barrels/day in 2021) and today there are not enough indi-
and gas investment began from 2015 to mid-2018.                        cations that US oil companies are strongly increasing the
                                                                       number of wells being drilled. There is some doubt as to
In 2019 and early 2020, after a downward adjustment of its             whether US operators will maintain the discipline shown
costs, the sector showed some stabilisation and improve-               so far, but they seem to have a more rational strategy
ment.                                                                  focused on cash generation. The modification of the
                                                                       incentive systems of their management teams away
In this context, Covid burst in and overnight the economies            from the constant pursuit of growth of the past is another
were closed, and the demand for oil fell sharply, in an                example of this.

Comments on Second Quarter 2021                                                                                                  6
Figure 2. Oil prices and Consensus Capex
                                                 112 largest listed oil companies globally

                   Capex Bn$                                                                                     Brent Oil $/barrel
                                                                                                                               125

                                                                                                                               100
             300

                                                                                                                               75

             200                                                                                                               50

                                                                                                                               25
                   2012                  2014                2016                 2018                 2020

                          Note: Consensus capex reflects rolling, next 12-months. Source: Bloomberg, Morgan Stanley Research.

    • In addition to the expected growth in demand over                            due to the natural decline rate of oil wells which is an
    the next few years, it is worth remembering that oil                           unavoidable geological fact. If we stop investing (as
    supply loses around 4-5% of its annual production                              has been happening, especially in the offshore part)
    (around 2mn bbls/day, excluding OPEC and the US)                               and no new oil fields are discovered or developed, we

7                                                                                                          Comments on Second Quarter 2021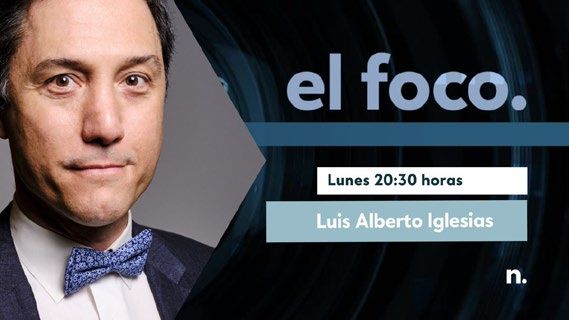
will not be able to compensate for the natural decline        oil and gas companies by the market for reasons of sus-
   of the fields that are already active.                         tainability. In fact recently the International Energy
                                                                 Agency called for no new investment projects in the
Therefore, we could end up with a shortfall of 3mn barrels       sector. To a large extent, the market considers these com-
per day: 2mn due to the natural decline of the fields,            panies to be uninvestable, in fact, despite the strong reco-
which are no longer covered due to the drought of invest-        very in the price of crude oil, the companies have lagged
ment in the sector over the last 5 years, and a slower           in their share prices.
growth of the US Shale, plus 1mn of increased demand
when the economy returns to its growth path after Covid,         For the reasons we have explained, at Cobas AM we are
which is already occurring. As the necessary prior               detecting good investment opportunities in the sector: in
investment has not been made, when demand is reacti-             companies with low risk, thanks to a healthy balance
vated in a normalised way, the price will have to reflect         sheet, producers with low costs (breakeven cash flow
this. On the other hand, we believe that OPEC should             around $30-35/barrel) and good management teams. All
have the capacity to increase production in a disciplined        these companies are trading at 3x-5x earnings, which
way.                                                             gives us a high margin of safety.

Let's remember that it takes, on average, 4-5 years to
develop an oil field, so investments should have been
made in 2015-2016, which was not done, to be able to face
the structural problems we are facing now.

In addition to all the above, there is the recent rejection of

Comments on Second Quarter 2021                                                                                          8
PORTFOLIOS Comments on Second Quarter 2021
Our portfolios
                                                                   Data as of 30/06/2021

Spanish domiciled funds               Luxembourg domiciled funds
                                                                                     AUM         Market Cap              Strategies              Number of
Name                          AUM     Name                            AUM                                       International     Iberian         holdings
Internacional FI          461.8 Mn€   International Fund            22 Mn€        483.8 Mn€       Multi Cap                                         46
Iberia FI                 39.2 Mn€    Iberian Fund                 5.7 Mn€         44.9 Mn€       Multi Cap                                         30
Grandes Compañías FI       19.4 Mn€   Large Cap Fund               7.4 Mn€         26.8 Mn€      70% >- 4Bn€                                        37
Selección FI              697. Mn€    Selection Fund               73.1 Mn€       770.5 Mn€       Multi Cap                                         55

            In Cobas Asset Management we manage three portfolios:
            the International Portfolio, which invests in companies             We remind you that the target value of our funds is based
            worldwide, excluding those listed in Spain and Portugal;            on internal estimates by applying multiples to normali-
            the Iberian Portfolio, which invests in companies listed in         zed cash flows based on estimates of each company.
            Spain and Portugal, or that have their operational hub on           Cobas AM does not guarantee that its calculation is
            the Iberian Peninsula; and, last but not least, the Large           correct or that they will be reached. We invest in assets
            Cap Portfolio that invests in global companies, 70% of              that the managers deem to be undervalued. However,
            which at least have over 4 billion euros in stock market            there is no guarantee that these assets are undervalued
            capitalisation.                                                     or that, even if they are, their price will move in the direc-
            With these three portfolios we built the various equity             tion expected by the managers.
            funds under management as of 30 June 2021.

                                                                                                      Total assets
                                                                                                            under            1,590
                                                                                                     management                 Mn€

            Comments on Second Quarter 2021                                                                                                 10
International Portfolio
Target Price, €
During the second quarter of 2021 our International Port- 200
folio returned +9.2% compared to a return of +6.5% for its
benchmark, the MSCI Europe Total Return Net. Since the 180
Cobas International FI fund began investing in equities in
mid-March 2017 it has returned -16.7%, while its bench- 160
mark has returned 33.2% for the same period.
140
During the second quarter we exited GS Home Shopping, 55% upside
Matas, Israel Chemicals, Saipem, and Hoegh LNG which in 120 upside 124%
March had a combined weighting below 6% and entered
100
CK Hutchison, Inpex, Panoro, Caltagirone, BW Energy, and
Okamoto with a combined weighting close to 4%.
80
Elsewhere in the portfolio, the main movements were: on
the buy side, we increased our weighting in Golar LNG,
60
and Babcock International, while on the sell side, we
lowered our weighting in AMG. Net Asset Value €
40
mar 2017 jun 2021
During the quarter we increased the target value of the
International Portfolio by more than 10% to €186/share,
implying an appreciation upside1 of 124%. This has been Note: For more information on the ratios go to page 29.
11 Comments on Second Quarter 2021made possible by the fact that we have already started to rotate the portfolio, as price movements have allowed us to do so. Obviously, because of this potential and the confidence in the portfolio, we are invested at 98%, close to the legal maximum allowed. The whole portfolio trades at an esti- mated 2021 P/E1 of 7.6x versus 16.3x its benchmark and has a ROCE1 of 28%, but if we look at the ROCE1 excluding shipping and commodity companies, we are close to 38%, which demonstrates the quality of the portfolio. (1) For more information on the ratios see page 29. Comments on Second Quarter 2021 12
Iberian Portfolio
The Iberian Portfolio's net asset value performance during       210
the second quarter of 2021 was +1.5%, compared to +4.2%
                                                                                               Target Price, €
for its benchmark. If we extend the comparison period            190
from when we started investing in equities to the end of
March 2021, it returned -5.0%, while its benchmark retur-        170
ned +11.4% for the same period.
                                                                 150
The takeover bid for Semapa ended in June, which we
decided not to take part in as we considered the price offe-     130
                                                                                 33%     upside
red was far from what we thought the company was                                                                 upside    109%
worth, as we explained in the previous quarterly letter.         110
During the quarter we made few changes in terms of port-
folio entries and exits. We completely exited 2 companies        90
Quabit (now Neinor), and Almirall which had a weighting
close to 1.5% at the end of March as they had a potential        70            Net Asset Value €
below the portfolio average. In terms of entries, we re-en-
tered Prisa with a weight of close to 0.5%. In the rest of the   50
portfolio, we increased our weighting mainly in Galp, and                mar 2017                                             jun 2021
Indra; and decreased it in Tubacex, and Metrovacesa.
                                                                 Note: For more information on the ratios go to page 29.

 13                                                                                         Comments on Second Quarter 2021
During the quarter we increased the target value of the Iberian Portfolio by nearly 8% to €198/share, which brings the upside for revaluation to 109%. We are 98% invested in the Iberian Portfolio, and the port- folio trades at an estimated 2021 P/E1 of 7.2x versus 16.0x for its benchmark and has a ROCE1 of 31%. (1) For more information on the ratios see page 29. Comments on Second Quarter 2021 14
Large Cap Portfolio
During the second quarter of 2021 our Large Cap Portfolio       200
returned +8.9% versus +6.8% for the benchmark, the MSCI
                                                                                                  Target Price, €
World Net. Since the Cobas Large-Cap Fund began inves-          180
ting in equities in early April 2017, it has returned -14.9%.
In that period the benchmark index appreciated by 57.2%.        160

During the second quarter we continued the rotation             140
initiated in the first quarter in the Large Cap Portfolio. We
                                                                             53%     upside
sold our entire positions in Exor, Catcher, Technip, and        120
Israel Chemicals, which at the end of March had a combi-
ned weighting of close to 6%. With these sales we finan-         100                                        upside         112%
ced the purchase of Qurate, Organon, and Galp, which
have an aggregate weighting of close to 5%.                      80

In the rest of the portfolio, we mainly increased our posi-      60
tions in Inpex, and Golar LNG, although in the latter case                         Net Asset Value €
it was largely helped by the share appreciation (+30%           40
during the quarter); while, on the sell side, we reduced              mar 2017                                               jun 2021
our positions in Viatris, and Aryzta.
                                                                Note: For more information on the ratios go to page 29.

 15                                                                                        Comments on Second Quarter 2021
During the quarter, thanks to the rotation we were able to make, the target value of the Large Cap Portfolio increased by 8% to €180/share, representing an upside of 112%. We are 98% invested in the Large Cap Portfolio. Overall, the portfolio trades at an estimated 2021 P/E1 of 7.1x versus 19.8x its benchmark and has a ROCE1 of 32%. (1) For more information on the ratios see page 29. Comments on Second Quarter 2021 16
NEWS

Comments on Second Quarter 2021
In our Cobas Asset Management news section, the aim is
to give a preview of the fund manager's projects and
initiatives, as well as the most important milestones in
the last quarter.

Fifth Annual Investor Conference
On 5 May we held our Fifth Annual Investor Conference
in Madrid.

During the meeting, our investment team led by Francis-
co García Paramés presented its investment strategy
and reviewed the current situation of the fund manager
and our portfolios.

We provide the link to watch the full conference, as well
as a summary of the conference.

Pension Plans
Discover on our web the importance of having a pension
plan to complete our future retirement.
www.cobaspensiones.com.

                                                            Fifth Annual Investor Conference. Illustration: Daniel Gete

Comments on Second Quarter 2021                                                                                    18
Intervention at the Ben Graham Center for Value Inves- he commented on our investment thesis on Dixons Car- ting event in Toronto of Ivey Business School phone. On 14 April, Francisco Garcia Paramés took part in the Virtual Value Investing Conference, which was also You can watch the speech here. attended by other renowned investors. During his speech Poster Ben Graham Centre for Value Investing. Photo: Shutterstock. 19 Comments on Second Quarter 2021
Premiere of the podcast “Invirtiendo a Largo Plazo”        Participation in the Negocio TV programme
Cobas AM's new podcast aims to bring the philosophy of     On 21 June, Negocios TV interviewed Carlos González
value investing to all its listeners.                      Ramos, Head of Retail Investor Relations at Cobas Asset
                                                           Management and Luis García Álvarez, Equity Portfolio
The first episodes on the Annual Conference, inflation,      Manager at Mapfre to talk about the close relationship
and the commodities sector are now available. Visit our    between investment and psychology, which are much
profile to listen to them here.                             more closely linked than we usually think. You can
                                                           watch the video here.
Participation in La Vanguardia's Bolsillo podcast
On 21 June, Gonzalo Recarte, Commercial Director of        On 5 July, Negocios TV interviewed Juan Huerta de Soto,
Cobas AM, took part in Raquel Quelart's talk show on the   from Cobas Asset Management's Investment Team, and
importance of broadening our financial culture to be a      Xavier Brun, Head of Equity Europe at Trea Asset Mana-
good investor. You can listen to the program here.         gement, to explain the history of value investing, its evo-
                                                           lution, its method, and approaches and where to learn
Participation in the Masdividendos podcast                 how to invest in this way. You can watch the video here.
Carmen Pérez, from the Cobas AM Investment Team,
answered listeners' questions in the Masdividendos         Participation in the Tu Dinero Nunca Duerme radio pro-
forum, focusing on the retail and telecoms sectors, as     gramme
well as the day-to-day life of a fund manager. You can     During this quarter, José Belascoáin, Luis Silva and Veró-
listen to the full episode here.                           nica Llera from the Cobas AM Investor Relations Team,

Comments on Second Quarter 2021                                                                                   20
Carlos González, Head of Retail Investor Relations and
Francisco Burgos, Head of Institutional Business, partici-
pated in the radio program Tu Dinero Nunca Duerme, the
first financial culture program on the Spanish general
radio station esRadio in collaboration with Value School.
Jose Belascoáin, spoke about the market niches where to
find investment opportunities and how to analyse them,
in the edition of the programme that took place on 18
April. The audio of the podcast is available here.
For his part, Carlos González analysed two of the most
dangerous biases for investors: the confidence bias and the
anchoring bias, in the edition of the programme that took
place on 25 May. The audio of the podcast is available here.
Luis Silva talked about pension plans and other products
that can be used to save for retirement, in the edition of
the programme that took place on 30 May. The audio of
the podcast is available here
Listening to the first episode of the Cobas AM “Invirtiendo a Largo Plazo” podcast. Photo: Shutterstock.
21 Comments on Second Quarter 2021Verónica Llera explained to listeners the investment in The following videos have been published this quarter:
commodities and the current situation of this sector in
the markets, in the edition of the programme that took How to deal with the herd effect when investing in the
place on 20 June. The audio of the podcast is available stock market? Watch video
here.
How to avoid hyperbolic discounting? Watch video
Francisco Burgos discussed the characteristics of investing
in Luxembourg, in the edition of the programme that took
place on 4 July. The audio of the podcast is available here.
Collaboration with Value School
Cobas Asset Management and Value School are laun-
ching together the programme "12 months, 12 biases", a
series of pills in video format, where we review the most
influential biases and show you how to control them to
mitigate their effects on your investment decision
making.
Comments on Second Quarter 2021 22Other initiatives of Gestion Group
Alice returns to Wall Street
                                                             We bring back a coveted classic of value investing. The
                                                             famous book by the investor Luis Allué, in a digital
Cobas AM collaborates with Value School to promote           edition, revised and greatly expanded. All the keys to
financial literacy from an independent perspective, and       invest successfully and be happy. A book that young and
help savers make informed investment decisions. After        old will love. You will love it. Read it. Give it as a gift. See
all, being a value investor is more than buying cheap, and   book file
being patient. It is a philosophy of life.
                                                             The moral question of fossil fuels
Investing with John Neff                                     In this new essay in the collection, we edit with the Juan
New title in our collection of modern investment clas-       de Mariana Institute, Alex Epstein refutes all the myths
sics. John Neff beat the market twenty-two times, at         surrounding fossil fuels. Drawing on the latest research,
every conceivable market juncture, while multiplying the     he argues that fossil fuels must be used and defended as
value of the initial holding by 57 times. See book file       a fundamental resource for transforming and improving
                                                             our lives. See book file
The investor's library
The June issue of Value School's book magazine is now        El Foco. The Value School program on Negocios TV
available. Javier Ruiz, Partner and Chief Investment Offi-    “El Foco” is your weekly appointment with the principles
cer at Horos AM, offers us an excellent selection of his     of conscious investment. Recently, Daniel Tello and
favourite books. Go to the investor library                  Gabriel Castro explained the keys to their work in the pro-

 24                                                                                  Comments on Second Quarter 2021
gramme dedicated to “Small caps e inversión en crédito”.
You will find all the programmes broadcast to date in the
"El Foco" playlist on Value School´s YouTube Channel.
Cover of the programme El foco. Photo: NegociosTV
Comments on Second Quarter 2021 25Global Social Impact Investments (GSI) Open Value Foundation
Has submitted for CNMV approval Global Social Impact II, During the second quarter of 2021, the Open Value Founda-
its second Impact Investment Fund with a target return tion has continued its work, developing multiple initiati-
of 10% per annum and a direct and measurable contribu- ves, and activities, including:
tion to the economic and social integration of vulnerable
groups (as defined in the Fund's theory of change), parti- - From the projects area, they continue to open opportuni-
cularly in the post Covid-19 context. ties so that all people can develop their full potential. The
latest milestone has been the granting of a loan of 30,000
The fund aims to invest €40MM between 10 and 15 busi- euros to the social enterprise RobinGood, which trains
ness models in Spain with high social impact, which people at risk of social exclusion to make artisan food pro-
have a theory of change developed hand in hand with the ducts.
Open Value Foundation, and GSI. The Fund's success
criteria are directly linked to both financial performance -From the training area:
and social impact and will be reported at least semi-an- • Impact investment training was provided to Repsol
nually. and its foundation with more than 40 participants.
• The Acumen Fellows program continues with the
second cohort of 25 members, who have had the
opportunity to meet face-to-face in June.
• The second edition of the Impact Foundations Fund
26 Comments on Second Quarter 2021program brought together 11 foundations to learn about impact investing, and venture philanthropy. From the communications area, they continue to organise regular inspirational meetings and participate in key events of the impact ecosystem in Spain, such as the annual event of SpainNAB, the National Advisory Board for Impact Investing. In addition, the publication of four reports on impact investment and social entrepreneurship has been promo- ted and are available on the foundation's web: • Impact Investment: Capitalism and Sustainability with the PWC Spain Foundation. • Alternatives to state social policy together with the Juan de Mariana Institute • Financing needs of social enterprises in Spain together with the Esade Center for Social Impact • Impact investment in Spain: Capital supply, segmenta- tion, and characteristics together with SpainNAB and ESADE Entrepreneurship Institute. Comments on Second Quarter 2021 27
ANNEXES

 Comment Second Quarter 2021
Luxembourg Funds
                                                                      Q2 Performance          Performance YTD         Perf. since inception
                                NAV         Target     Upside                                                                                                               AUM      Equity
   Fund                                     Value     potential      Fund     Benchmark       Fund     Benchmark        Fund     Benchmark       PER     ROCE      VaR      mn€     exposure
   International EUR           78.0 €       174 €       123%         9.0%         6.5%        30.9%        15.4%       -22.1%       26.1%        7.1x     28%      20%      21.1       98%

   International USD           $96.6         $216       123%         9.3%         6.5%        31.5%        15.4%       -14.5%       26.7%        7.1x     28%      20%       0.9       98%

   Selection EUR             16.607.0 €    37.065 €     123%         8.1%         6.5%        29.6%        15.4%       -15.2%       38.6%        7.0x     28%      20%      62.2       97%

   Selection USD             $29.492.5     $65.823      123%         8.4%         6.5%        30.3%        15.4%        -6.0%       38.6%        7.0x     28%      20%      10.9       97%

   Iberian EUR                 103.2 €      215 €       109%         1.6%         4.2%        20.3%        9.9%         3.2%         4.2%        7.2x     31%       15%      5.7       98%

   Large Cap EUR               110.8 €      235 €        112%        8.7%         6.8%        27.0%        16.6%        10.8%       32.5%        7.2x     32%       21%      7.4       98%

                                                                                       Data as of 03/31/2021
• The target value of our funds is based on internal calculations and estimates and Cobas AM does not guarantee that its calculation is correct or that they will be reached.
• Inception of the funds. Cobas International Fund EUR: 1-jun-17; Cobas International Fund USD: 6-jun-17; Cobas Selection Fund EUR and USD: 1-jul-17; Cobas Concentrated Fund EUR and
USD: 31-dec-17; Cobas Iberian EUR and Cobas Large Cap EUR: 14-oct-19.
• Benchmark. MSCI Europe Total Return Net for Cobas Selección FI, Cobas Internacional FI, Cobas Concentrados FI and Cobas Global PP; MSCI World Net EUR for Cobas Grandes Compa-
ñías FI; IGBM Total 80% and PSI 20 Total Return 20% for Cobas Iberia FI.               Data as of 06/30//2021
• Ratios.• The
           PER:target
                It is calculated by  dividing the market  capitalization of each company   by its
                       value of our funds is based on internal calculations and estimates and     normalized
                                                                                                Cobas AM does cash
                                                                                                               not flow  basedthat
                                                                                                                   guarantee  on our  current estimates;
                                                                                                                                  its calculation         ROCE:
                                                                                                                                                  is correct      Wethey
                                                                                                                                                             or that calculate
                                                                                                                                                                         will beitreached.
                                                                                                                                                                                   by dividing the
normalized operating result based on our own estimates, after taxes, by the capital employed; FCF Yield Unleveraged: It is the result of dividing the normalized cash flow, based on our
• Inception of the funds. Cobas International Fund EUR: 1-jun-17; Cobas International Fund USD: 6-jun-17; Cobas Selection Fund EUR and USD: 1-jul-17; Cobas Concentrated Fund EUR and
estimates, by the Enterprise Value; Upside potential: Best scenario. It is the difference between the target value and the aggregate market price of the portfolio. To calculate the target value,
                                                             USD: 31-dec-17; Cobas Iberian EUR and Cobas Large Cap EUR: 14-oct-19.
we apply a multiple to the normalized cash flow based on our estimate of each company.
• Benchmark. MSCI Europe Total Return Net for Cobas Selección FI, Cobas Internacional FI, Cobas Concentrados FI and Cobas Global PP; MSCI World Net EUR for Cobas Grandes Compa-
                                                             ñías FI; IGBM Total 80% and PSI 20 Total Return 20% for Cobas Iberia FI.
• Ratios. Upside potencial: Best scenario: it is the difference between the target value and the aggregate market price of the portfolio. To calculate the target value, we apply a multiple to
 the normalized cash flow based on our estimate of each company. VAR:Maximun expected monthly loss. Calculated with the Value at Risk methodology 2.32 sigmas, 99% confidence
level at the normal distribution at one month. PER: It is calculated by dividing the market capitalization of each company by its normalized cash flow based on our estimates. ROCE:
We calculate it by dividing the normalized operating result based on our own estimates, after taxes, by the capital employed (ex - goodwill) in order to get the business profitability.
Spanish Funds
Q2 Performance Performance YTD Perf. since inception
NAV Target Upside AUM Equity
Fund Value Potential Fund Benchmark Fund Benchmark Fund Benchmark PER ROCE VaR Mn€ exposure
Selección FI Class C 86.9 € 195 € 125% 8.1% 6.5% 29.4% 15.4% -13.1% 48.1% 7.0x 29% 20% 692.5 98%
Selección FI Class D 128.5 € 289 € 125% 8.0% 6.5% 28.5% 15.4% 28.5% 15.4% 7.0x 29% 20% 4.9 98%
Internacional FI Class C 83.3 € 186 € 124% 9.2% 6.5% 31.1% 15.4% -16.7% 33.2% 7.6x 28% 20% 456.2 98%
Internacional FI Class D 130.0 € 291 € 124% 9.1% 6.5% 30.0% 15.4% 30.0% 15.4% 7.6x 28% 20% 5.6 98%
Iberia FI Class C 95.0 € 198€ 109% 1.5% 4.2% 20.1% 9.5% -5.0% 11.4% 7.2x 31% 15% 38.7 98%
Iberia FI Class D 113.4 € 237 € 109% 1.4% 4.2% 13.4% 4.8% 13.4% 4.8% 7.2x 31% 15% 0.5 98%
Grandes Compañías FI Class C 85.1 € 180 € 112% 8.9% 6.8% 27.4% 16.6% -14.9% 57.2% 7.1x 32% 21% 19.3 98%
Grandes Compañías FI Class D 118.7 € 251 € 112% 10.0% 6.8% 18.7% 16.6% 18.7% 16.6% 7.1x 32% 21% 0.1 98%
Renta FI 98.2 € 1.7% -0.1% 7.1% -0.2% -1.8% -1.8% 11.5 15%
Pension Funds
Q1 Performance Performance YTD Perf. since inception
NAV Target Upside AUM Equity
Fund Value Potential Fund Benchmark Fund Benchmark Fund Benchmark PER ROCE VaR Mn€ exposure
Global PP 80.9 € 181 € 124% 8.2% 6.5% 29.6% 15.4% -19.1% 28.9% 7.0x 28% 20% 62.2 98%
Mixto Global PP 86.4 € 167 € 94% 6.1% 3.2% 22.4% 7.4% -13.6% 14.3% 7.0x 21% 15% 4.5 74%
06/30//2021
• The target value of our funds is based on internal calculations and estimates and Cobas AM does not guarantee that its calculation is correct or that they will be reached.
• Inception of the funds. Cobas International Fund EUR: 1-jun-17; Cobas International Fund USD: 6-jun-17; Cobas Selection Fund EUR and USD: 1-jul-17; Cobas Concentrated Fund EUR and
USD: 31-dec-17; Cobas Iberian EUR and Cobas Large Cap EUR: 14-oct-19.
• Benchmark. MSCI Europe Total Return Net for Cobas Selección FI, Cobas Internacional FI, Cobas Concentrados FI and Cobas Global PP; MSCI World Net EUR for Cobas Grandes Compa-
ñías FI; IGBM Total 80% and PSI 20 Total Return 20% for Cobas Iberia FI.
• Ratios. Upside potencial: Best scenario: it is the difference between the target value and the aggregate market price of the portfolio. To calculate the target value, we apply a multiple to
the normalized cash flow based on our estimate of each company. VAR: Maximun expected monthly loss. Calculated with the Value at Risk methodology 2.32 sigmas, 99% confidence
level at the normal distribution at one month. PER: It is calculated by dividing the market capitalization of each company by its normalized cash flow based on our estimates. ROCE:
We calculate it by dividing the normalized operating result based on our own estimates, after taxes, by the capital employed (ex - goodwill) in order to get the business profitability.Radiography of our funds Second Quarter 2021
Cobas LUX SICAV Cobas LUX SICAV Cobas LUX SICAV Cobas LUX SICAV
Cobas Internacional FI Cobas Iberia FI Cobas Grandes Compañías FI Cobas Selección FI Cobas Renta FI Cobas Selection Fund Cobas International Fund Cobas Iberian Fund Cobas Large Cap
Class C - ES0119199000 Class C - ES0119184002 Class C - ES0113728002 Class C - ES0124037005 ES0119207001 LU1372006947 EUR LU1598719752 EUR LU1598721493 EUR LU1598720172 EUR
Class D - ES0119199018 Class D - ES0119184010 Class D - ES0113728010 Class D - ES0124037013 LU1372007168 USD LU1598719919 USD
Top 10 Current Previous Current Previous Current Previous Current Previous Current Previous Current Previous Current Previous Current Previous Current Previous
quarter quarter quarter quarter quarter quarter quarter quarter quarter quarter quarter quarter quarter quarter quarter quarter quarter quarter
Company weight weight Company weight weight Company weight weight Company weight weight Company weight weight Company weight weight Company weight weight Company weight weight Company weight weight
Golar LNG 8.6% 6.6% Vocento 9.0% 8.9% Golar LNG 7.6% 6.3% Golar LNG 7.8% 5.9% Golar LNG 3.4% 1.8% Golar LNG 7.7% 5.9% Golar LNG 8.6% 6.6% Vocento 9.0% 8.9% Golar LNG 7.6% 6.3%
CIR 6.3% 6.5% Semapa 8.3% 9.0% Dassault Aviation 6.1% 6.2% CIR 5.7% 5.8% Teekay Corp. 1.9% 1.7% CIR 5.6% 5.8% CIR 6.3% 6.5% Semapa 8.3% 9.0% Dassault Aviation 6.2% 6.2%
Marie Tecnimont 5.7% 5.3% Técnicas Reunidas 8.2% 8.6% Energy Transfer 4.6% 3.9% Marie Tecnimont 5.1% 4.7% Babcock 1.2% 0.7% Maire Tecnimont 5.1% 4.7% Maire Tecnimont 5.7% 5.3% Técnicas Reunidas 8.2% 8.6% Energy Transfer 4.6% 3.9%
Dixons Carphone 5.4% 6.2% Atalaya Mining 8.1% 8.3% Inpex Corp. 4.5% 3.8% Dixons Carphone 4.9% 5.6% Maire Tecnimont 1.2% 1.0% Dixons Carphone 4.8% 5.5% Dixons Carphone 5.4% 6.2% Atalaya Mining 8.1% 8.3% Inpex Corp. 4.6% 3.8%
Aryzta 5.3% 5.9% Elecnor 5.1% 4.5% Samsung C&T 4.1% 4.2% Aryzta 4.7% 3.0% CIR 1.1% 1.0% Aryzta 4.7% 5.2% Aryzta 5.2% 5.8% Elecnor 5.2% 4.5% Samsung C&T 4.1% 4.2%
Babcock 4.4% 3.3% Miquel y Costas 4.9% 4.5% Renault 3.9% 3.8% Babcock 4.0% 3.0% Vocento 1.1% 1.0% Babcock 3.9% 2.9% Babcock 4.3% 3.3% Miquel y Costas 4.9% 4.5% Renault 4.0% 3.8%
Teekay LNG 4.3% 4.7% Indra 3.9% 2.8% Viatris 3.7% 5.1% Teekay LNG 3.9% 4.2% Dixons Carphone 1.0% 0.9% Teekay LNG 3.9% 4.2% Teekay LNG 4.3% 4.7% Indra 3.9% 2.9% Viatris 3.7% 5.1%
Danieli 4.0% 3.9% Metrovacesa 3.9% 4.6% Bolloré 3.7% 3.3% Danieli 3.6% 3.0% Atalaya Mining 1.0% 0.9% Danieli 3.5% 3.5% Danieli 3.9% 3.9% Metrovacesa 3.9% 4.6% Bolloré 3.7% 3.3%
Kosmos Energy 3.9% 3.3% Ibersol 3.4% 3.0% CK Hutchison 3.1% 2.8% Kosmos Energy 3.5% 3.0% Técnicas Reunidas 0.9% 1.1% Kosmos Energy 3.5% 3.0% Kosmos Energy 3.9% 3.3% Ibersol 3.4% 3.0% CH Hutchison 3.1% 2.8%
Wilhelmsen 3.7% 3.8% Sonae 3.3% 3.6% Aryzta 3.0% 4.1% Wilhelmsen 3.4% 3.5% Teekay LNG 0.8% 0.8% Wilhelmsen 3z3% 3.4% Wilhemsen 3.7% 3.8% Sonae 3.3% 3.5% Aryzta 3.0% 4.1%
Geographical USA 32.5% Spain 68.5% Eurozone 36.7% Eurozone 36.7% Eurozone 83.0% Eurozone 37.6% USA 32.1% Spain 68.4% USA 36.0%
breakdown Eurozone 30.9% Portugal 23.4% USA 29.4% USA 29.4% USA 11.5% USA 28.8% Eurozone 31.5% Portugal 23.5% Eurozone 33.7%
Rest of Europe 27.9% Other 8.1% Rest of Europe 26.1% Rest of Europe 26.1% Rest of Europe 5.4% Rest of Europe 25.8% Rest of Europe 27.7% Other 8.1% Asia 18.4%
(Current Quarter
Asia 7.7% Asia 7.1% Asia 7.8% Asia 7.8% Asia 8.7% Rest of Europe 11.9%
Weight %)
Currency US Dollar 32.5% Euro 91.9% US Dollar 36.3% Euro 36.7% Euro 83.0% Euro 37.6% US Dollar 32.1% Euro 91.9% US Dollar 36.0%
breakdown Euro 30.9% Sterling Pound 8.1% Euro 33.6% US Dollar 29.4% US Dollar 11.5% US Dollar 28.8% Euro 31.5% Pound Sterling 8.1% Euro 33.7%
Pound Sterling 15.4% South Korean Won 9.4% Pound Sterling 14.8% Pound Sterling 3.3% Pound Sterling 14.6% Pound Sterlig 15.2% South Korean Won 9.5%
(% Gross)
South Korean Won 5.4% Pound Sterling 8.9% South Korean Won 4.9% Norwegian Krone 2.2% South Korean Krone 4.8% South Korean Won 5.4% Pound Sterling 8.9%
Norwegian Krone 5.3% Yen 4.5% Norwegian Krone 4.8% Norwegian Krone 4.7% Norwegian Krone 5.2% Yen 4.6%
Swiss Franc 5.3% Hong Kong Dollar 4.3% Swiss Franc 4.7% Swiss Franc 4.7% Swiss Franc 5.2% Hong Kong Dollar 4.3%
Yen 2.2% Swiss Franc 3.0% Yen 2.0% Yen 2.0% Yen 2.2% Swiss Franc 3.0%
Swedish Krona 2.2% Swedish Krona 1.8% Swedish Krona 1.8% Swedish Krona 2.0%
Other 1.1% Hong Kong Dollar 1.0% Hong Kong Dollar 0.9% Hong Kong Dollar 1.1%
(*) EUR/ USD 66% hedged
(*) EUR/ USD 65% hedged (*) EUR/ USD 64% hedged (*) EUR/ USD 68% hedged (*) EUR/ USD 65% hedged (*) EUR/ USD 67% hedged (*) EUR/ USD 65% hedged
Performance Contributors Contributors Contributors Contributors Contributors Contributors Contributors Contributors
contributors Golar LNG 2.1% CTT Correios de Portugal 1.4% Energy Transfer LP 1.5% Golar LNG 1.9% Golar LNG 1.9% Golar LNG 2.1% CTT Correiros de Portugal 1.4% Golar LNG 1.8%
(Contribution Maire Tecnimont 1.5% Ibersol 0.3% Golar LNG 1.5% Maire Tecnimont 1.3% Aryzta 1.0% Aryzta 1.2% Miquel y Costas 0.3% Energy Transfer LP 1.5%
to return %) Aryzta 1.2% Miquel y Costas 0.3% Aryzta 0.8% Aryzta 1.0% Babcock 0.8% Marie Tecnimont 1.0% Ibersol 0.3% Aryzta 0.9%
Babcock 0.9% Sonae 0.3% Maire Tecnimont 0.6% Babcock 0.8% Marie Tecnimont 0.7% Babcock 0.9% Sonae 0.3% Marie Tecnimont 0.6%
International Petroleum 0.7% Inmobilaria del Sur 0.3% Fresenius 0.5% International Petroleum 0.6% International Petroleum 0.6% International Petroleum 0.7% Inmobiliaria del Sur 0.3% Fresenius 0.5%
Detractors Detractors Detractors Detractors Detractors Detractors Detractors Detractors
Teva Pharmaceutical -0.2% Atalaya Mining -0.2% Catcher Technology -0.1% Renault -0.2% Renault -0.2% Teva Pharmaceutical -0.2% Atalaya Mining -0.2% Catcher Technology -0.1%
Renault -0.2% Galp Energía -0.2% Galp Energía -0.1% Técnicas Reunidas -0.2% Técnicas Reunidas -0.2% Renault -0.2% Galp Energía -0.2% Galp Energía -0.1%
Cairn Energy -0.3% Metrovacesa -0.2% Dixons Carphone -0.4% Cairn Energy -0.3% Cairn Energy -0.3% Cairm Energy -0.3% Metrovacesa -0.2% Renault -0.3%
CGG SA -0.4% Tubacex -0.5% Renault -0.4% CGG SA -0.4% CGG SA -0.4% CGG SA -0.5% Tubacex -0.5% Dixons Carphone -0.4%
Dixons Carphone -0.6% Técnicas Reunidas -1.3% Teva Pharmaceutical -0.5% Dixons Carphone -0.5% Dixons Carphone -0.5% Dixons Carphone -0.6% Técnicas Reunidas -1.4% Teva Pharmaceutical -0.5%
In & out of In the portfolio In the portfolio In the portfolio In the portfolio In the portfolio In the portfolio In the portfolio In the portfolio
the portfolio BW Energy Prisa Galp Energía BW Energy Panoro BW Energy Panoro BW Energy Prisa Galp Energía
Caltagirone Organon Caltagirone Caltagirone Caltagirone Organon
CK Hutchison Qurate Retail CK Hutchison CK Hutchison CK Hutchison Qurate Retail
Inpex Corp. Inpex Corp. Inpex Corp. Inpex Corp.
Okamoto Miquel y Costas Miquel y Costas Okamoto
Panoro Okamoto Okamoto Panoro
Out of the portfolio Out of the portfolio Out of the portfolio Out of the portfolio Out of the portfolio Out of the portfolio Out of the portfolio Out of the portfolio
GS Home Shopping Almirall Israel Chemicals GS Home Shopping GS Home Shopping GS Home Shopping Almirall Israel Chemicals
Israel Chemicals Quabit (Neinor) Catcher Technology Israel Chemicals Israel Chemicals Israel Chemicals Quabit Catcher Technology
Matas Technip FMC Matas Matas Matas Technip FMC
Saipem Exor Saipem Saipem Saipem Exor
Hoegh LNG Hoegh LNG Hoegh LNG Hoegh LNG
The positions of Maire Tecnimont, CIR and Wilhelmsen bring together the joint exposure to the different types of portfolio shares of these companies, whose ISINs are shown below.:
- Maire Tecnimont: IT0004931058 and XXITV0000107 - CIR: XXITV0000180, IT0005241762 and IT0000070786 - Wilhelmsen: NO0010571698 and NO0010576010 Information broken down by ISIN code is available in the report available on the CNMV wbesite.Disclaimer
This document is of a commercial nature and is provided exposed to factors, risks and circumstances that could
for informational purposes only, and can in no way be affect the financial results implying a difference with the
considered as a contractual element, a recommendation, estimates and projections.
personalized advice or an offer.
Cobas Asset Management, SGIIC, SA has no obligation to
Nor can it be considered as a replacement for key investor publicly update or communicate the update of the content
information documents (KIIDs) or any other mandatory of this document if the facts are not exactly as they are
legal information which must be consulted before any collected here or if there are changes in the information it
investment decision is made. contains.
In the case of any discrepancy, legal information prevails. We also remind you that past performance does not guar-
All this legal information will be made available to you at antee future performance.
the manager's headquarters and via the website: www.co-
basam.com. References to Cobas Asset Management, The transmission of this document does not imply the
S.G.I.I.C., S.A. cannot be understood as generating any transfer of any intellectual or industrial property rights
type of legal obligation for said entity. over its content or any of its integral elements, and its
reproduction, transformation, distribution, public commu-
This document includes or may contain estimates or fore- nication, making available, extraction, reuse, transmis-
casts concerning the development of the company in the sion are expressly prohibited as well as its use of any kind,
future and financial results, which come from the expec- by any means or procedure whatsoever, except in cases
tations of Cobas Asset Management, SGIIC, SA and are where this is legally authorized.
Copyright © 2021 Cobas Asset Management, all rights reserved.José Abascal, 45. Third floor
28003 Madrid (Spain)
T +34 91 755 68 00
info@cobasam.com
www.cobasam.comYou can also read