COMMODITIES AT A GLANCE - Special issue on cashew nuts
←
→
Page content transcription
If your browser does not render page correctly, please read the page content below
U N I T E D N AT I O N S C O N F E R E N C E O N T R A D E A N D D E V E L O P M E N T

COMMODITIES AT A GLANCE
                             Special issue on cashew nuts

                                                                               No. 14
U N I T E D N AT I O N S C O N F E R E N C E O N T R A D E A N D D E V E L O P M E N T

COMMODITIES AT A GLANCE
                             Special issue on cashew nuts

                                                                               No. 14

                                  Geneva, 2021
© 2021, United Nations

This work is available through open access, by complying with the Creative Commons licence created for
intergovernmental organizations, at https://creativecommons.org/licenses/by/3.0/igo/.

The findings, interpretations and conclusions expressed herein are those of the author(s) and do not necessarily
reflect the views of the United Nations or its officials or Member States.

The designations employed and the presentation of material on any map in this work do not imply the expression
of any opinion whatsoever on the part of the United Nations concerning the legal status of any country, territory,
city or area or of its authorities, or concerning the delimitation of its frontiers or boundaries.

Mention of any firm or licensed process does not imply the endorsement of the United Nations.

Photocopies and reproductions of excerpts are allowed with proper credits.

This publication has not been formally edited.

United Nations publication issued by the United Nations Conference on Trade and Development.

                                         UNCTAD/DITC/COM/2020/1

                                                 eISSN: 2522-7866
                                          eISBN: 978-92-1-005383-9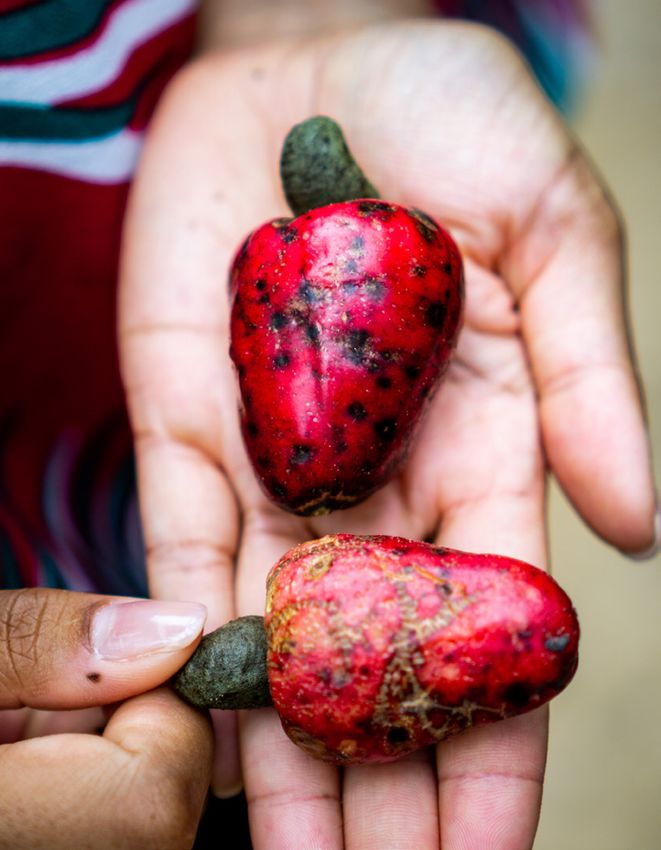
1

                                 ACKNOWLEDGEMENTS

The Commodities at A Glance series aims to collect, present and disseminate accurate and relevant statistical
information linked to international primary commodity markets in a clear, concise and reader-friendly format.

This edition of Commodities at A Glance was prepared by Stefan Csordas, Economic Affairs Officer, Commodities
Branch, Division on International Trade and Commodities, UNCTAD, under the overall guidance of Janvier
Nkurunziza, Chief, Commodity Research and Analysis Section, Commodities Branch.

                                                    NOTE

The term “dollars” ($) refers to United States dollars unless otherwise specified.

The term “tons” refers to metric tons.

All prices are in nominal terms unless otherwise specified.

For further information about this publication, please contact the Commodities Branch, Division on International
Trade and Commodities, UNCTAD, Palais des Nations, CH-1211 Geneva 10, Switzerland; email: commodities@
unctad.org; tel: 41 22 917 6286/1648.
2                                            COMMODITIES AT A GLANCE - Special issue on cashew nuts

                                  ABBREVIATIONS

CNSL		      cashew nut shell liquid

ComCashew   Competitive Cashew Initiative

DCCD		      Directorate of Cashewnut and Cocoa Development of India

FAO		       Food and Agriculture Organization of the United Nations

OECD		      Organization for Economic Cooperation and Development

RCN		       raw (unshelled) cashew nuts
Contents                                                                                                                                                   3

                                                            CONTENTS

Abbreviations             ���������������������������������������������������������������������������������������������������������� 2

CHAPTER I		 INTRODUCTION........................................................................................7

CHAPTER II		 CASHEW TREES, KERNELS AND BY-PRODUCTS........................................11

         2.1 Trees .......................................................................................................................................12
         2.2 Kernels.....................................................................................................................................13
                2.2.1 Shelling...........................................................................................................................13
                2.2.2 Grading raw cashew nuts...............................................................................................14
                2.2.3 Grading cashew kernels.................................................................................................14

         2.3 By-products.............................................................................................................................15
                2.3.1 Nut shell liquid................................................................................................................15
                2.3.2 Shell cake.......................................................................................................................15
                2.3.3 Apple..............................................................................................................................15
                2.3.4 Testa..............................................................................................................................16
                2.3.5 Gum...............................................................................................................................16

CHAPTER III SUPPLY, DEMAND AND PRICES...............................................................17

         3.1 Production................................................................................................................................18
         3.2 Trade �������������������������������������������������������������������������������������������������������������������������������������� 21
                3.2.1 Raw cashew nuts...........................................................................................................21
                3.2.2 Kernels...........................................................................................................................24

         3.3 Prices �������������������������������������������������������������������������������������������������������������������������������������� 27

CHAPTER IV POLICIES AND DEVELOPMENT OPPORTUNITIES.......................................29

         4.1 Adding value to raw cashew nuts and cashew by-products.................................................30
                4.1.1 Raw cashew nuts...........................................................................................................31
                4.1.2 Cashew by-products......................................................................................................32

         4.2 Policies for value addition in the cashew sector....................................................................33
                4.2.1 India and Viet Nam.........................................................................................................33
                4.2.2 Challenges for cashew processors in Africa....................................................................34
                4.2.3 Policies in cashew-growing countries in Africa................................................................35

         4.3 Summary..................................................................................................................................36

CHAPTER V           CONCLUSION.........................................................................................39

REFERENCES                �������������������������������������������������������������������������������������������������������� 41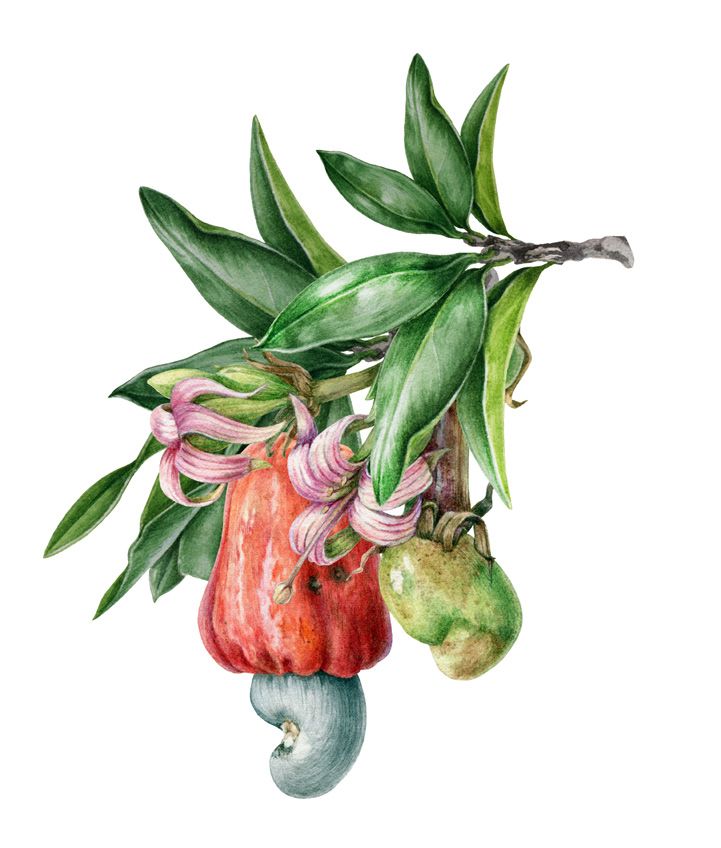
4                                                                      COMMODITIES AT A GLANCE - Special issue on cashew nuts

FIGURES

Figure 1     Cashew nut or acajou (Anacardium occidentale L.): Flowering and fruiting branch with
             separate sectioned flowers and fruit, chromolithograph by P Depannemaeker, c. 1885,
             after B Hoola van Nooten.................................................................................................................. 8

Figure 2     Cashew products............................................................................................................................ 12

Figure 3     Raw cashew nut yields, selected countries...................................................................................... 12

Figure 4     India: Raw cashew nut yields, selected states................................................................................. 13

Figure 5     Processing of cashew products....................................................................................................... 14

Figure 6     World production of raw cashew nuts............................................................................................. 19

Figure 7     Raw cashew nut production by region............................................................................................. 19

Figure 8     Top 10 raw cashew nut producing countries, average production 2014–2018................................. 20

Figure 9     Share of global cashew nut production, average 2014–2018 .......................................................... 20

Figure 10 Raw cashew nut production, selected countries.............................................................................. 21

Figure 11 Global trade in raw cashew nuts, imports........................................................................................ 22

Figure 12 Global trade in raw cashew nuts, average shares, 2014–2018........................................................ 22

Figure 13 Top 10 raw cashew nut exporters by volume, average 2014–2018.................................................. 23

Figure 14 Top 10 raw cashew nut exporters by value, average 2014–2018..................................................... 23

Figure 15 Share of raw cashew nut exports in total merchandise exports, selected countries......................... 24

Figure 16 Global trade in cashew kernels........................................................................................................ 25

Figure 17 Global cashew kernel trade shares, average 2015–2019................................................................. 25

Figure 18 Sources of cashew kernel imports to the European Union............................................................... 26

Figure 19 Sources of cashew kernel imports to the United States................................................................... 26

Figure 20 Average raw cashew nut prices, India.............................................................................................. 27

Figure 21 Cashew kernel import prices, United States and European Union.................................................... 28

Figure 22 Coefficient of variation of raw cashew nut and cashew kernel prices, 2000–2018............................ 28

Figure 23 Shares in cashew production and primary processing by region, 2018............................................ 30

Figure 24 Côte d’Ivoire, India and European Union: Farm gate to retail prices, 2018....................................... 32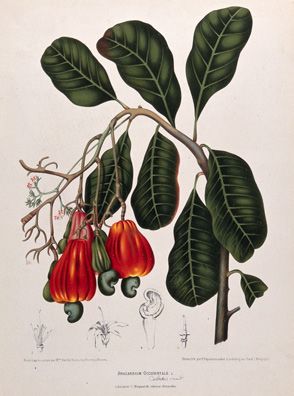
Contents                                                                                                                                           5

TABLES

Table 1    Cashew kernel classification............................................................................................................ 14

Table 2    Cashew-growing countries by region............................................................................................... 18

Table 3    Processing capacity and utilization, selected cashew-growing countries.......................................... 31
CHAPTER I

INTRODUCTION
8                                                    COMMODITIES AT A GLANCE - Special issue on cashew nuts

                                      1. INTRODUCTION

Cashew nuts are enjoying increasing popularity all        Cashew nuts became popular in Europe and the
around the globe. The top three cashew-consuming          United States at the beginning of the twentieth
countries – India, the United States of America and       century, spurring commercial, export-oriented cashew
Germany – are on three different continents. Cashews      plantation. Today, the bulk of cashew nuts are grown
accounted for 17 per cent of world tree nut production    in Africa and Asia, with a relatively small share of global
in 2019/20, making it the third most popular tree nut     production in Latin America and the Caribbean. All
after almonds and walnuts (International Nut and          46 countries producing cashew nuts on a significant
Dried Fruit Council Foundation, 2020). Cashew nuts        scale are developing countries, with 18 of the least
are consumed in a variety of forms, including as salty    developed countries among them. However, not all
or sweet snacks and as ingredients in desserts and        cashew-growing countries participate in the global
savoury dishes, or are further processed into cashew      value chain in an equal manner. In particular, the
butter or as ingredients in a variety of spreads,         majority of cashew nuts grown in the least developed
sauces, bars and drinks. Increasing demand for these      countries are exported as raw nuts before deshelling,
products led global cashew production to more than        which takes place mainly in two countries: India and
double between 2000 and 2018.
                                                            Figure 1
This report takes stock of the global cashew market         Cashew nut or acajou (Anacardium occidentale
and gives an overview of cashew production, trade           L.): Flowering and fruiting branch with separate
patterns and policies. It also highlights opportunities     sectioned flowers and fruit, chromolithograph
for the cashew sector, to foster value addition and         by P Depannemaeker, c. 1885,
diversification in cashew-growing countries, and            after B Hoola van Nooten
its potential contribution to the achievement of the
Sustainable Development Goals.

The cashew tree (Anacardium occidentale L.) is a
tropical evergreen that originated in the semi-arid
coastal areas of north-eastern Brazil. In the sixteenth
century, traders from Portugal introduced the cashew
tree to India and Mozambique and from there it
spread further across tropical regions of Africa and
Asia. Initially, cashew trees were planted to combat
soil erosion in coastal areas, since they are fast-
growing, tolerate salinity and thrive on sandy soils.
Today, cashew trees are used primarily for cashew
nut production in 46 countries across Africa, Asia and
Latin America and the Caribbean.

Cashew trees typically bear fruit after three years and
produce mature yields after seven or eight years. The
economic lifespan of cashew trees is 20–25 years,
after which yields begin to drop. The true fruit of the
cashew tree is the cashew nut, which is attached to
the bottom of a swollen stalk, known as the cashew
apple (figure 1). The part commonly known as a
cashew nut is the kernel, which is protected by a
thin skin (testa) and a thicker outer shell. The latter
contains an acidic oil, cashew nut shell liquid (CNSL),   Source: Wellcome Library, No. 16303i. available at https://
                                                          search.wellcomelibrary.org/iii/encore/record/C__Rb1174193__
which is a key by-product of cashew nut production,       SDepannemaeker__P0%2C9__Orightresult__U__
with a variety of uses.                                   X6?lang=eng&suite=cobalt.
CHAPTER I - Introduction 9 Viet Nam. Countries that grow cashew nuts but do opportunities in communities involved in cashew not process them on a significant scale retain only a production and/or processing. small share of the value created in the global cashew market. In these countries, value addition in the The remainder of this report is structured as follows. cashew sector holds significant potential to contribute The growth of cashew trees, the uses of cashew nuts to the achievement of the Sustainable Development and the various by-products are highlighted in chapter Goals through poverty reduction, job creation and 2. Cashew production, trade patterns and prices are rural development. In addition, the commercialization reviewed in chapter 3. An analysis of policy options of cashew by-products, which are often discarded as and opportunities to stimulate development and value agricultural waste, can help diversify revenue sources addition in the cashew sector is contained in chapter 4. and generate more value, employment and business Finally, a conclusion is provided in chapter 5.
CHAPTER II

CASHEW TREES, KERNELS
   AND BY-PRODUCTS
12                                                                                        COMMODITIES AT A GLANCE - Special issue on cashew nuts

      2.  CASHEW TREES, KERNELS AND BY-PRODUCTS

The cashew industry is based on and focused on the                                               2.1 TREES
production of cashew kernels. However, the cashew
value chain contains a number of by-products that                                                Cashews are found in different climatic regions between
have the potential to add value to and diversify                                                 the 27th parallel north and 28th parallel south, but the
revenue from cashew production (figure 2). This                                                  bulk of commercial plantation takes place between
chapter reviews the value chains of the cashew kernel                                            the 15th parallel north and 15th parallel south.
and its various by-products.                                                                     Cashew trees thrive in moist tropical climates and do
                                                                                                 not tolerate frost. An average monthly temperature of
  Figure 2                                                                                       26–28°C is optimal for cashew tree growth (Paull and
  Cashew products                                                                                Duarte, 2011). Ideal climatic conditions also include
                                                                                                 1,000–2,000 mm of rainfall during a rainy season of
                                                                                                 5–7 months (Food and Agriculture Organization of the
                            Kernel                                                               United Nations (FAO), 1988), as well as an extended
                                                                                                 dry season during flowering and fruit set. While
                                              Cashew                                             cashew trees tolerate a broad range of soil types, they
            Apple                             nut shell
                                               liquid                                            grow best on well-drained and deep sandy soils.
                         Cashew                                                                  In addition to the natural soil and climatic conditions,
                           tree                                                                  cashew growth and yields are also linked to
                                               Shell                                             plantation management. For instance, water and
             Gum
                                               cake                                              soil conservation (Indian Council of Agricultural
                                                                                                 Research-National Research Centre for Cashew,
                            Testa                                                                2008), appropriate fertilizer use and supplementary
                                                                                                 irrigation have been shown to have the potential to
Source: UNCTAD.                                                                                  improve yields (Prabhakaran Nair, 2010). Cashew

  Figure 3
  Raw cashew nut yields, selected countries
  (Kilograms per hectare)

              1200

              1000

                800

                600

                400

                200

                    0
                         Benin

                                                    Burkina Faso
                                     Brazil

                                                                                                                      Mozambique

                                                                                                                                   Sierra Leone

                                                                                                                                                  Viet Nam
                                                                                                 Ghana

                                                                                                            India
                                                                          Côte d’Ivoire

                                                                   2015                   2016       2017      2018
Source: UNCTAD calculations, based on data from the Brazilian Institute of Geography and Statistics, the Competitive Cashew
Initiative (ComCashew), the Directorate of Cashewnut and Cocoa Development (DCCD) of India and Viet Nam statistical yearbooks.
CHAPTER II - Cashew trees, kernels and by-products 13
Figure 4
India: Raw cashew nut yields, selected states
(Kilograms per hectare)
1400
1200
1000
800
600
400
200
0
Tamil Nadu
Odisha
Goa
Andhra Pradesh
Karnataka
Kerala
Maharashtra
Source: UNCTAD calculations, based on data from DCCD.
yields are also linked to average tree age, which average yields in many cashew-growing countries,
makes replantation and rejuvenation key aspects including in many countries in Africa, point to a
of plantation management. Furthermore, pest and significant potential to boost productivity and increase
disease management also play important roles. Finally, revenues for cashew farmers. This potential appears
cashew yields can differ between varieties. greatest among smallholding farmers that grow the
bulk of cashew nuts but have limited access to the
Due to the factors highlighted above, cashew yields finance, quality seed material and technical know-how
vary greatly between and within countries and required to enhance productivity.
fluctuate from season to season. Figure 3 shows the
average yields of nine cashew producers in different 2.2 KERNELS
regions in the period 2015–2018.
Cashew kernels represent the main product of the
It should be noted that these average yield figures cashew industry. They are consumed in various forms,
can mask large disparities between different areas including as a salty or sweet snack or an ingredient in
within these countries. This is illustrated in figure 4, desserts and savoury dishes, or are further processed
which shows yields across major cashew-growing as cashew butter or as an ingredient in a variety of
states in India in the 2018/19 season, ranging from spreads, sauces, bars and drinks. In addition, cashew
476 kg/hectare in Tamil Nadu to 1,169 kg/hectare in oil can be extracted from cashew kernels.
Maharashtra.
2.2.1 Shelling
The large disparities and fluctuations in cashew yields
are partially due to differences in soil and climatic A number of processing steps must be undertaken
conditions that cannot be controlled by farmers. to extract the kernel from raw cashew nuts (RCN;
However, strengthening farm management practices figure 5). In the first step, RCN are exposed to thermal
and improving the genotypical composition of cashew treatment in order to make the outer shells brittle.
orchards can contribute to higher and more stable The three main methods are steaming, roasting and
cashew yields (Dadzie et al., 2014; Mangalassery et immersing RCN in a hot oil bath. In the second step,
al., 2019; Nayak et al., 2018). In this context, the low RCN are shelled, that is, the kernels are separated from14 COMMODITIES AT A GLANCE - Special issue on cashew nuts
the outer shells. This process can be done manually, a moisture meter; the moisture content should not
mechanically or in a fully automated manner. The next exceed 9 per cent to limit degradation during storage.
step involves drying the kernel, followed by peeling off Other indicators that determine the value of RCN are
the testa. The testa and cashew shell are by-products the share of foreign matter and the float rate, that is, the
of the cashew-processing industry and can be further share of RCN that float in water, with a lower float rate
processed to generate numerous products. Cashew corresponding to a higher quality.
kernels are often sold in bulk and typically undergo
secondary processing, including roasting, frying and 2.2.3 Grading cashew kernels
the addition of salt, sugar or flavouring, and may also
There is a wide spectrum of cashew kernel qualities.
be mixed with other nuts before being packaged for
The United Nations Economic Commission for Europe
retail sale.
(2013) standards for the commercial quality of cashew
kernels provide a system to categorize unprocessed
Figure 5 kernels. The standards include a number of general
Processing of cashew products quality requirements for commercial kernels, such as
a maximum moisture content of 5 per cent. They also
define characteristics to enable the categorization of
Raw cashew nut
cashew kernels into the three main quality classes of
Cleaning extra, class I and class II (table 1). Whole nuts are further
Thermal treatment classified into seven categories ranging from 150 to
Shelling
500 according to the maximum number of kernels per
pound. Broken nuts are classified according to the
sizes of the pieces, ranging from large (not passing
Kernel
with testa
Shell through a sieve with an aperture of 4.75 mm) to baby
bits or granules (not passing through a sieve with an
Drying aperture of 1.70 mm).
Peeling Testa Cake Oil extraction
Table 1
Cashew kernel classification
Commercial
Cashew nut Class Description
Kernel shell liquid designation
Extra White White, pale ivory, pale ash-grey or
light yellow
Source: UNCTAD. Class I Scorched or Light brown, light ivory, light
lightly ash-grey, deep ivory or yellow
blemished
2.2.2 Grading raw cashew nuts Class II Scorched Light brown, amber, light blue,
seconds or deep brown, deep blue, discoloured,
The quality and therefore the price of RCN depends on dessert black spotted, immature, shrivelled,
several factors that are typically determined through a blemished or stained kernels are
permitted
sampling process. A key quality indicator for RCN is
their kernel outturn ratio, which is the weight in pounds Source: United Nations Economic Commission for Europe,
2013.
of usable kernels per 80 kg of RCN. A higher kernel
outturn ratio yields a higher price since it means that more In addition to the United Nations Economic
kernels can be extracted from RCN. Another indicator Commission for Europe standards, there are other
for assessing the value of RCN is the nut count, which quality classification systems for cashew kernels.
measures RCN/kg. A smaller nut count corresponds These include the industry standards of the Association
to larger kernels, which generally yield a higher price. of Food Industries, which apply to the United States
Furthermore, the defective rate is an important indicator market, as well as standards developed by kernel-
of RCN quality; it measures the share of nuts that exporting countries, including Brazil and India. These
are not usable for various reasons, such as missing, systems generally also grade the quality of cashew
stunted or moth-eaten kernels. Sampling also includes kernels based on colour and size and whether the
the measurement of the moisture content of RCN using kernels are whole or broken.CHAPTER II - Cashew trees, kernels and by-products 15
2.3 BY-PRODUCTS shell cake can be carbonized and mixed with a
binder to produce briquettes that can be used to fire
2.3.1 Nut shell liquid industrial boilers (Sawadogo et al., 2018). Shell cake
can also be processed into vermiculite, a product
CNSL is a viscous liquid that represents 20–25 per used in gardening and hydroponics.
cent in weight of RCN (ComCashew, 2019a) and
is mainly composed of anacardic acid, cardol and 2.3.3 Apple
cardanol (Kumar et al., 2009). CNSL-based polymers
have numerous desirable properties such as low The cashew apple is often referred to as the false
fade characteristics, water repellence, wear and fruit or pseudofruit of the cashew tree. Botanically,
electrical resistance, solubility in common organic the cashew apple is a swollen stalk, which carries
solvents, compatibility with many other polymers and the true fruit of the cashew tree: the cashew nut.
antimicrobial activity, which make them a suitable Since the ripe cashew apple starts to ferment
raw material for a range of industrial, chemical and and degrade quickly after falling from the tree, it
pharmaceutical applications (Telascrêa et al., 2014). is often discarded during the cashew nut harvest.
However, the cashew apple is rich in vitamin C
One of the main uses of CNSL is in the manufacture and antioxidants and can be used to produce a
of brake linings and clutch facings for the automobile range of food products, including pectin and juices,
industry (Lubi and Tchachil, 2000). CNSL is also alcoholic beverages, vinegars, syrups and jams.
used in the paint and coatings industries, in which In addition to these products, the fibrous residues
it is a potential substitute for petroleum-based raw of the cashew apple juice-making process can be
materials (Balgude and Sabnis, 2014). Furthermore, further processed to produce animal feed (Gomes
the potential use of CNSL as a biofuel or additive et al., 2018) and research has shown the potential
to biofuel has been demonstrated (Sanjeeva et al., of juice residue as a source of carotenoids for food
2014). In addition, CNSL has a range of applications supplements or natural food colourants (Abreu et
in the production of rubber, adhesives and plastic al., 2013).
materials. Finally, research has shown the potential of
CNSL as a component of non-toxigenic insecticide A small share of cashew apples is consumed directly
(Vani et al., 2018). on orchards or processed into artisanal food products
for local consumption in cashew-growing regions, yet
There are various methods of extracting CNSL commercial utilization of the cashew apple remains
from the cashew shell. The two most widely used low in most cashew-growing countries. Brazil has
technologies are mechanical extraction with screw the highest cashew apple utilization rate, estimated
expellers and extraction through a hot oil bath before at 15 per cent (Luciano et al., 2011). In Brazil, the
shelling. Other methods include solvent extraction majority of harvested cashew apples are processed
(Tyman et al., 1989) and extraction through pyrolysis into cashew apple juice, which is widely consumed
(Das et al., 2004). The chemical composition of CNSL domestically and also exported. Cashew apples are
depends on the extraction method (Srinivas and also sold as fresh fruit or processed into candy and
Anilkumar, 2017), which can yield CNSL with a high cajuína, a clarified juice. In India, a small share of
share of either anarcadic oil (natural CNSL) or cardanol cashew apples is used to produce juices, candies,
(technical CNSL). jams, pickles and chutneys. An alcoholic beverage
known as feni is also made from cashew apples in
The biggest producers of CNSL are Brazil, India
Goa. In 2014, the Pepsi Company announced plans
and Viet Nam. There is also some degree of
to add cashew apple juice to fruit juice blends for the
commercialization of CNSL in many countries that
market in India (Strom, 2014), which could increase the
process cashew nuts, including Benin, Burkina Faso,
Côte d’Ivoire, Ghana, Indonesia and Mozambique. share of utilized cashew apples. Cashew apple juice
production also takes place in Senegal and Viet Nam,
2.3.2 Shell cake as well as in Ghana, where a brandy is also produced
from cashew apples. Finally, several initiatives that aim
Cashew shell cake is the de-oiled cashew shell and to add value to cashew apples have recently emerged
thus a by-product of CNSL production. It can be used in other cashew-growing countries, including Benin
as a raw material for several products. In particular, and Nigeria.16 COMMODITIES AT A GLANCE - Special issue on cashew nuts
2.3.4 Testa encapsulating agent, clarifying agent and emulsifying
agent in the food and beverages industry (Porto and
The cashew testa or husk is the thin skin covering the Cristianini, 2014).
kernel. It contains a high concentration of tannins and
can be used to produce tanning agents for the leather This section has highlighted that there are several
industry. There has also been research on the potential by-products in the cashew kernel value chain that
of the use of testa as animal feed (Fang et al., 2018). have the potential to contribute to diversification of
the cashew-related economy and to value addition
2.3.5 Gum in communities involved in cashew production and/
or processing. Overall, value addition to and utilization
Cashew gum, also known as anacardium gum, is an of cashew by-products remains low, except for in
exudate from the bark of the cashew tree. It can be Brazil and India, which have actively promoted the
harvested from natural exudate or after tapping, that development of cashew by-product industries. This
is, incision of the trunk or branch. Cashew gum is a is partly due to the fact that many cashew-growing
complex polysaccharide that has a range of industrial countries such as most cashew producers in Africa
applications, including in pharmaceuticals and the export the bulk of their nuts as RCN, which also limits
food industry (Kumar et al., 2012). For instance, it the availability of raw materials for shell-based by-
can be used as a pharmaceutical excipient in drug products. In these countries, the promotion of cashew
delivery systems (Ribeiro et al., 2016). Research by-product utilization could go hand in hand with
has also shown the potential of cashew gum as an efforts to increase local processing.CHAPTER III SUPPLY, DEMAND AND PRICES
18                                                               COMMODITIES AT A GLANCE - Special issue on cashew nuts

                         3.  SUPPLY, DEMAND AND PRICES

3.1 PRODUCTION                                                        Africa accounted for 63 per cent of global RCN
                                                                      production growth after 2000 (figure 7), followed by
Cashew nuts are grown in at least 46 countries across                 Asia, with a share of 35 per cent. Production in Latin
Africa, Asia and Latin America and the Caribbean,                     America and the Caribbean has not experienced
18 of which are among the least developed countries                   significant growth since the mid-1990s and accounted
(table 2).                                                            for only 5 per cent of global output in 2018, half of its
                                                                      share of 10 per cent in 2000.
In the past three decades, global production of
RCN has experienced rapid growth (figure 6).                          In the period 2014–2018, India was the largest
The global output of RCN more than doubled,                           producer of RCN, with an annual average output
from 706,500 tons in 1990 to 1.53 million tons in                     of 745,000 tons, followed by Côte d’Ivoire, with
2000, and from there more than doubled again, to                      675,000 tons, and Viet Nam, with 296,000 tons
3.9 million tons in 2018.                                             (figure 8).

     Table 2
     Cashew-growing countries by region

  Region                      Country
                              Angola*                                              Kenya
                              Benin*                                               Madagascar*
                              Burkina Faso*                                        Malawi*
                              Cameroon                                             Mali*
  Africa                      Côte d’Ivoire                                        Mozambique*
  (20)                        Gabon                                                Nigeria
                              Gambia*                                              Senegal*
                              Ghana                                                Sierra Leone*
                              Guinea*                                              Togo*
                              Guinea-Bissau*                                       United Republic of Tanzania*
                              Bangladesh*                                          Malaysia
                              Cambodia*                                            Myanmar*
  Asia                        China                                                Philippines
  (12)                        India                                                Sri Lanka
                              Indonesia                                            Thailand
                              Lao People’s Democratic Republic*                    Viet Nam
                              Belize                                               Jamaica
                              Bolivia (Plurinational State of)                     Nicaragua

  Latin America               Brazil                                               Mexico
  and the Caribbean           Colombia                                             Panama
  (14)
                              Costa Rica                                           Peru
                              Dominican Republic                                   Suriname
                              Honduras                                             Venezuela (Bolivarian Republic of)
* Least developed country
Source: UNCTAD, based on data from the United Nations Comtrade database and FAOstat.
Notes: Includes countries that have either produced at least 100 tons of RCN in any year in the period 2010–2018 according to FAOstat
data and/or are suitable for cashew farming and have exported at least 50 tons of RCN and/or at least 25 tons of cashew kernels in
any year in this period according to Comtrade data. In addition to these countries, cashew trees are also found in other countries,
where they are part of the natural vegetation or grown on a small scale and typically marketed locally for domestic consumption.
CHAPTER III - Supply, demand and prices 19
Figure 6
World production of raw cashew nuts
(Millions of tons)
4.5
4.0
3.5
3.0
2.5
2.0
1.5
1.0
0.5
0
1961
1964
1967
1970
1973
1976
1979
1982
1985
1988
1991
1994
1997
2000
2003
2006
2009
2012
2015
2018
Source: UNCTAD calculations, based on data from Comtrade, DCCD, FAOstat, the United Republic of Tanzania Cashewnut Board,
the General Department of Viet Nam Customs and Viet Nam statistical yearbooks.
Figure 7
Raw cashew nut production by region
(Millions of tons)
1.8
1.6
1.4
1.2
1
0.8
0.6
0.4
0.2
0
1961
1964
1967
1970
1973
1976
1979
1982
1985
1988
1991
1994
1997
2000
2003
2006
2009
2012
2015
2018
Asia West Africa East Africa Latin America and the Caribbean
Source: UNCTAD calculations, based on data from Comtrade, DCCD, FAOstat, the General Department of Viet Nam Customs and
Viet Nam statistical yearbooks.20 COMMODITIES AT A GLANCE - Special issue on cashew nuts
Figure 8
Top 10 raw cashew nut producing countries, average production 2014–2018
(Tons)
800 000
700 000
600 000
500 000
400 000
300 000
200 000
100 000
0
Côte d’Ivoire
Viet Nam
United Republic
of Tanzania
Philippines
Nigeria
Guinea-Bissau
Indonesia
Brazil
India
Benin
Source: UNCTAD calculations, based on data from Comtrade, DCCD, FAOstat, the General Department of Viet Nam Customs and
Viet Nam statistical yearbooks.
Figure 9 Africa produced more than half of the global cashew
Share of global cashew nut production, nut output in the period 2014–2018, with West
average 2014–2018 Africa and East Africa accounting for average annual
(Percentage) shares of 42 per cent and 10 per cent of global
RCN production, respectively. Asia accounted for
an average annual share of 43 per cent and Latin
Latin America and
the Caribbean 5 America and the Caribbean, for the remaining 5 per
cent (figure 9).
While cashew production has increased steadily
at the global level since the 1960s, it has followed
different paths in individual countries (figure 10). For
instance, Benin and Côte d’Ivoire only began large-
Asia scale cashew production in the 1990s, but have since
43 recorded high growth rates, which put them among
West Africa the top 10 producers in the period 2014–2018.
42
Production in India has followed a path of steady
growth since the early 1960s. Mozambique was the
world’s largest cashew producer in the early 1960s,
East but production declined significantly in the early
Africa 1970s and, as a consequence, production in 2018
10 was at the same level as in 1962 (see chapter 4). The
United Republic of Tanzania experienced a similar
decline in cashew output throughout the 1970s and
Source: UNCTAD calculations, based on data from Comtrade,
DCCD, FAOstat, the General Department of Viet Nam Customs
1980s but has seen a revival since 2010. Viet Nam
and Viet Nam statistical yearbooks. did not grow cashew nuts on a significant scale
before the 1980s, when the Government began to
promote the development of the cashew sector.CHAPTER III - Supply, demand and prices 21
Figure 10
Raw cashew nut production, selected countries
(Tons)
Benin Côte d’Ivoire
250 000 800 000
700 000
200 000
600 000
150 000 500 000
400 000
100 000 300 000
200 000
50 000
100 000
0 0
1961
1964
1967
1970
1973
1976
1979
1982
1985
1988
1991
1994
1997
2000
2003
2006
2009
2012
2015
2018
1961
1964
1967
1970
1973
1976
1979
1982
1985
1988
1991
1994
1997
2000
2003
2006
2009
2012
2015
2018
India Mozambique
900 000 300 000
800 000
250 000
700 000
600 000 200 000
500 000
150 000
400 000
300 000 100 000
200 000
50 000
100 000
0 0
1961
1964
1967
1970
1973
1976
1979
1982
1985
1988
1991
1994
1997
2000
2003
2006
2009
2012
2015
2018
1961
1964
1967
1970
1973
1976
1979
1982
1985
1988
1991
1994
1997
2000
2003
2006
2009
2012
2015
2018
United Republic of Tanzania Viet Nam
350 000 400 000
300 000 350 000
300 000
250 000
250 000
200 000
200 000
150 000
150 000
100 000 100 000
50 000 50 000
0 0
1961
1964
1967
1970
1973
1976
1979
1982
1985
1988
1991
1994
1997
2000
2003
2006
2009
2012
2015
2018
1961
1964
1967
1970
1973
1976
1979
1982
1985
1988
1991
1994
1997
2000
2003
2006
2009
2012
2015
2018
Source: UNCTAD calculations, based on data from DCCD, FAOstat and Viet Nam statistical yearbooks.
3.2 TRADE almost fivefold in this period, reflecting increasing
RCN prices in the 2010s.
3.2.1 Raw cashew nuts
India and Viet Nam are, by a wide margin, the largest
Global trade in RCN has more than doubled, from importers of RCN. Together they accounted for an
872 million kg in 2009 to 2.1 billion kg in 2018 average share of 98 per cent of global RCN imports by
(figure 11). In value terms, trade in RCN increased volume in the period 2014–2018. The main sources22 COMMODITIES AT A GLANCE - Special issue on cashew nuts
Figure 11
Global trade in raw cashew nuts, imports
(Billions of dollars and billions of kilograms)
4.5 2.5
4
3.5 2
3
1.5
2.5
2
1
1.5
1 0.5
0.5
0 0
2009
2010
2011
2012
2013
2014
2015
2016
2017
2018
United States dollars (billions; left axis) Kilograms (billions; right axis)
Source: UNCTAD calculations, based on data from Comtrade and the General Department of Viet Nam Customs.
Note: RCN corresponds to Harmonized System 080131: Cashew nuts, fresh or dried, in shell.
Figure 12
Global trade in raw cashew nuts, average shares, 2014–2018
(Percentage of volume traded)
Imports Exports
1
1
10
13
46
52
77
India Viet Nam Brazil Other West Africa East Africa Asia
Source: UNCTAD calculations, based on data from Comtrade and the General Department of Viet Nam Customs.
Notes: To maximize data coverage and consistency, RCN exports are based on data reported by the main importers, namely, Brazil,
India and Viet Nam, which jointly accounted for an average share of 99 per cent of global RCN imports in the period 2014–2018.
Cashews are not grown in the United Arab Emirates but significant quantities of RCN are re-exported, mainly sourced from Africa.
Therefore, in the figure, under exports, data from the United Arab Emirates is excluded. However, including the United Arab Emirates
would have a negligible effect on the aggregate shares.CHAPTER III - Supply, demand and prices 23
of RCN imports were West Africa, East Africa and annual exports, followed by the United Republic
Asia, accounting for average shares of 77, 13 and of Tanzania, with 208,000 tons, and Ghana, with
10 per cent of globally traded volumes, respectively 172,000 tons (figure 13).
(figure 12). Africa as a continent therefore accounted
for 90 per cent of global RCN exports. With regard to RCN exports by value, Côte d’Ivoire
recorded the highest revenue in the period 2014–2018,
Côte d’Ivoire was the largest exporter of RCN in the with estimated average annual exports of $827 million,
period 2013–2018, with 605,000 tons of average followed by the United Republic of Tanzania, with
Figure 13
Top 10 raw cashew nut exporters by volume, average 2014–2018
(Thousands of tons)
700
600
500
400
300
200
100
0
Burkina Faso
Côte d’Ivoire
United Republic
of Tanzania
Benin
Ghana
Indonesia
Nigeria
Guinea-Bissau
Guinea
Cambodia
Source: UNCTAD calculations, based on data from Comtrade and the General Department of Viet Nam Customs.
Notes: To maximize data coverage and consistency, RCN exports are based on data reported by the main importers, namely, Brazil,
India and Viet Nam, which jointly accounted for an average share of 99 per cent of global RCN imports in the period 2014–2018.
Figure 14
Top 10 raw cashew nut exporters by value, average 2014–2018
(Millions of dollars)
900
800
700
600
500
400
300
200
100
0
Côte d’Ivoire
United Republic
of Tanzania
Benin
Cambodia
Indonesia
Guinea
Burkina Faso
Gambia
Mozambique
Ghana
Nigeria
Guinea-Bissau
Source: UNCTAD calculations, based on data from Comtrade, the General Department of Viet Nam Customs and OECDstat[Organization
for Economic Cooperation and Development].
Notes: To maximize data coverage and consistency, RCN exports are based on data reported by the main importers, namely, Brazil,
India and Viet Nam, which jointly accounted for an average share of 99 per cent of global RCN imports in the period 2014–2018. Since
imports as reported in Comtrade include cost, insurance and freight, free on board export values have been estimated using, where
available, cost, insurance and freight/free on board ratios from the OECD International Transport and Insurance Costs of Merchandise
Trade database (Miao and Fortanier, 2017).24 COMMODITIES AT A GLANCE - Special issue on cashew nuts
$364 million, and Ghana, with $247 million (figure 14). to be among the highest in the world (United States
The 10 largest exporters of RCN in terms of value Department of Agriculture, Foreign Agricultural
comprise the same countries as the 10 largest in Service, 2018).
terms of volume except for Mozambique, which is on In Guinea-Bissau, RCN are the main export good,
the list instead of Burkina Faso. Guinea-Bissau is in representing an average share of 81.3 per cent of total
fourth place (sixth place in terms of volume), indicating merchandise export value in the period 2014–2018
that the country receives a higher average price (figure 15). RCN also represent substantial shares of
for RCN than Benin and Nigeria. The latter may be total merchandise exports in the Gambia (30.0 per
explained by differences in kernel outturn ratio, since cent), Benin (14.6 per cent), Côte d’Ivoire (6.6 per cent)
the kernel outturn ratio of Guinea-Bissau is estimated and the United Republic of Tanzania (5.5 per cent).
Figure 15
Share of raw cashew nut exports in total merchandise exports, selected countries
(Percentage)
100
90
80
70
60
50
40
30
20
10
0
Guinea-Bissau Gambia Benin Côte d’Ivoire United Republic
of Tanzania
2014 2015 2016 2017 2018
Source: UNCTAD calculations, based on data from Comtrade, OECDStat and Zignago and Gaulier, 2010.
Notes: To maximize data coverage and consistency, RCN exports are based on data reported by the main importers, namely, Brazil,
India and Viet Nam, which jointly accounted for an average share of 99 per cent of global RCN imports in the period 2014–2018. Since
imports as reported in Comtrade include cost, insurance and freight, free on board export values have been estimated using, where
available, time-varying, country pair-specific cost, insurance and freight/free on board ratios from the OECD International Transport
and Insurance Costs of Merchandise Trade database (Miao and Fortanier, 2017).
3.2.2 Kernels The main sources of cashew kernel imports to the
European Union are India and Viet Nam, which
Increasing demand for cashew nuts has led to a jointly accounted for 84 per cent of total imports
steep increase in trade in cashew kernels since 2000 in 2019 (figure 18). Viet Nam overtook India as a
(figure 16). major source of cashew kernel imports to the
The main importers of cashew kernels are the United European Union in 2008 and increased its cashew
States and the European Union (including the United kernel exports to the region by 156 per cent, from
Kingdom of Great Britain and Northern Ireland, unless 41,000 tons in 2008 to 106,000 tons in 2019.
otherwise specified), which jointly accounted for Cashew kernel imports from Africa represented
61 per cent of global imports by volume and 64 per 5.9 per cent in 2019, more than five times greater
cent of imports by value in the period 2015–2019. The than the 1.15 per cent share in 2000. In terms of
main exporters of cashew kernels are India and Viet volume, cashew kernel exports from Africa to the
Nam, which together accounted for 77 per cent of European Union increased more than twentyfold,
global cashew kernel exports by volume and by value from 445 tons in 2000 to 9,125 tons in 2019. In
in the period 2015–2019 (figure 17). the period 2000–2019, the intra-European UnionCHAPTER III - Supply, demand and prices 25
Figure 16
Global trade in cashew kernels
(Billions of dollars and millions of kilograms)
6 700
5 600
500
4
400
3
300
2
200
1 100
0 0
2000
2001
2002
2003
2004
2005
2006
2007
2008
2009
2010
2011
2012
2013
2014
2015
2016
2017
2018
2019
United States dollars (billions; left axis) Kilograms (millions; right axis)
Source: UNCTAD calculations, based on data from Comtrade and the General Department of Viet Nam Customs.
Figure 17
Global cashew kernel trade shares, average 2015–2019
(Percentage)
Imports (volume) Exports (volume)
European Union 27 + 2
United Kingdom Viet Nam 10
17 2
3
United States 2 India
3 33
China Netherlands 5
3
United Arab Emirates United Arab Emirates 63
5
Australia Germany 14
Canada 10 Brazil
Japan 28 Other
Other
Imports (value) Exports (value)
European Union 27 + 12
15 Viet Nam 2 2
United Kingdom
2 India 3
United States 3
China 3 35 Netherlands
5
United Arab Emirates 4 Germany
62
Australia Brazil
9 15
Canada United Arab Emirates
Japan Other
30
Other
Source: UNCTAD calculations, based on data from Comtrade and the General Department of Viet Nam Customs.
Notes: Kernels correspond to Harmonized System 080132: Cashew nuts, fresh or dried, shelled. European Union 27 + United
Kingdom refers to the 27 member States of the European Union and the United Kingdom. Import figures for China are based on export
data reported by India, Indonesia, Myanmar and Viet Nam, which accounted for an average share of 99 per cent of reported cashew
kernel exports to China in the period 2015–2019. Data on the volume (weight) of cashew kernel imports into Canada in 2017 and 2018
is missing in Comtrade and has been replaced by manually cleaned mirror data. Percentages may not add to 100 due to rounding.26 COMMODITIES AT A GLANCE - Special issue on cashew nuts
Figure 18
Sources of cashew kernel imports to the European Union
(Tons)
120 000
100 000
80 000
60 000
40 000
20 000
0
2000
2001
2002
2003
2004
2005
2006
2007
2008
2009
2010
2011
2012
2013
2014
2015
2016
2017
2018
2019
Brazil India
Viet Nam Africa
Asia, excluding India and Viet Nam Other
Source: UNCTAD calculations, based on data from Eurostat.
Notes: Based on data on cashew kernel imports originating outside the European Union 27 + United Kingdom. “Africa” refers to the
following countries: Burkina Faso, Benin, Côte d’Ivoire, Ghana, Guinea, Guinea-Bissau, Kenya, Madagascar, Mali, Mozambique,
Nigeria, Togo, United Republic of Tanzania. “Asia, excluding India and Viet Nam” refers to the following countries: Cambodia,
Indonesia, Sri Lanka, Philippines, Thailand.
Figure 19
Sources of cashew kernel imports to the United States
(Tons)
140 000
120 000
100 000
80 000
60 000
40 000
20 000
0
2000
2001
2002
2003
2004
2005
2006
2007
2008
2009
2010
2011
2012
2013
2014
2015
2016
2017
2018
2019
Viet Nam India
Brazil Africa
Asia, excluding India and Viet Nam Other
Source: UNCTAD calculations, based on data from the United States International Trade Commission dataweb.
Notes: “Africa” refers to the following countries: Burkina Faso, Benin, Côte d’Ivoire, Gambia, Ghana, Guinea, Guinea-Bissau, Kenya,
Madagascar, Mali, Mozambique, Nigeria, Togo, United Republic of Tanzania. “Asia, excluding India and Viet Nam” refers to the
following countries: Cambodia, China, Hong Kong (China), Indonesia, Lao People’s Democratic Republic, Malaysia, Philippines,
Republic of Korea, Sri Lanka, Thailand.CHAPTER III - Supply, demand and prices 27
trade of cashew kernels represented an average of (2009–2013) was characterized by a steep increase
31 per cent of total cashew kernel imports to the of prices caused by strong competition for RCN in
European Union, with the Netherlands as the largest global markets due to rising demand and limited
re-exporter in the European market. supply. The price spike in 2011 caused demand
to weaken, which corrected prices downwards to
In the United States market, the picture is similar, below $1/kg in 2013. In the third phase, prices
but Viet Nam plays an even more dominant role, doubled from below $1/kg in 2013 to around $2/kg
accounting for 85 per cent of cashew kernel imports in 2017. This price spike was due to a combination
in 2019 (figure 19). Cashew kernel imports from Viet of increasing demand and a crop shortfall in Viet
Nam to the United States increased by 154 per cent, Nam, which gave rise to strong import demand for
from 52,000 tons in 2009 to 133,000 tons in 2019. RCN. Prices dropped sharply in 2019 due to an
The joint share of Brazil and India decreased from oversupply in international markets.
82 per cent in 2000 to 7 per cent in 2019. Cashew
kernel exports from Africa to the United States In the period 2000–2019, cashew kernel prices in
increased significantly, from an annual average of the main import markets (the United States and the
2,053 tons in the period 2000–2009 to 6,862 tons European Union) followed the same general trends
in the period 2010–2019. as prices of RCN (figure 21). In 2000–2009, cost,
insurance and freight import prices for cashew
3.3 PRICES kernels remained roughly within the range of
$4–6/kg. Cashew kernel prices then increased in
Prices of RCN went through three phases in the 2011 to over $8/kg before declining in 2013 to
period 2000–2018 (figure 20). In the first phase around $7/kg. In 2014–2017, cashew kernel prices
(2000–2009), prices were volatile but stayed roughly increased to over $10/kg but dropped thereafter,
within the range of $0.5–1/kg. The second phase to $7.8/kg in 2019.
Figure 20
Average raw cashew nut prices, India
(Dollars per kilogram)
2.5
2
1.5
1
0.5
0
2000
2001
2002
2003
2004
2005
2006
2007
2008
2009
2010
2011
2012
2013
2014
2015
2016
2017
2018
2019
India, domestic price (dollars/kg)
India, imports from East Africa (CIF, dollars/kg)
India, imports from West Africa (CIF, dollars/kg)
Abbreviation: CIF, cost, insurance and freight.
Source: UNCTAD calculations, based on data from Comtrade and DCCD.
Notes: “India, domestic price” shows the simple average of prices in the five cashew-growing states for which data are available
(Andhra Pradesh, Goa, Karnataka, Kerala, Tamil Nadu). Prices in rupees have been converted to dollars using exchange rates from
UNCTADstat. “India, imports from East Africa” shows unweighted average cost, insurance and freight import prices for RCN from
Madagascar, Mozambique and the United Republic of Tanzania. “India, imports from West Africa” shows unweighted average cost,
insurance and freight import prices for RCN from Benin, Côte d’Ivoire, Ghana, Guinea-Bissau and Nigeria.28 COMMODITIES AT A GLANCE - Special issue on cashew nuts
Figure 21
Cashew kernel import prices, United States and European Union
(Cost, insurance and freight prices, dollars per kilogram)
12
10
8
6
4
2
0
2000
2001
2002
2003
2004
2005
2006
2007
2008
2009
2010
2011
2012
2013
2014
2015
2016
2017
2018
2019
European Union 27 + United Kingdom United States
Source: UNCTAD calculations, based on data from Eurostat and the United States International Trade Commission dataweb.
Notes: Data on the European Union 27 + United Kingdom include only imports that originated outside of this area, that is, intra-
European exports are excluded. Prices in euros have been converted to dollars using exchange rates from UNCTADstat.
It is important to note that, while prices of RCN to multiple sources of supply of RCN are better
and of cashew kernels showed a similar pattern, equipped to react to market signals and limit supply
the former were more volatile than the latter in and demand gaps than are individual cashew-
the period 2000–2018 (figure 22). One reason for producing countries that supply RCN to the two
this could be that cashew processors with access main importers.
Figure 22
Coefficient of variation of raw cashew nut and cashew kernel prices, 2000–2018
0.45
0.42 0.41
0.40
0.36
0.35
0.31
0.30 0.29
0.25
0.20
0.15
0.10
0.05
0.00
India, RCN India, RCN, India, United States, European Union 27
imports from domestic RCN imports kernel imports + United Kingdom,
East Africa from West Africa kernel imports
Source: UNCTAD calculations, based on data from Comtrade, DCCD, Eurostat and the United States International Trade Commission
dataweb.CHAPTER IV
POLICIES AND DEVELOPMENT
OPPORTUNITIES30 COMMODITIES AT A GLANCE - Special issue on cashew nuts
4. POLICIES AND DEVELOPMENT OPPORTUNITIES
4.1 ADDING VALUE TO RAW CASHEW directly benefit the achievement of the Sustainable
NUTS AND CASHEW BY-PRODUCTS Development Goals through poverty reduction and
various other channels. For instance, in Africa in
The cashew value chain is largely divided between
2018, an estimated 3.06 million smallholding farmers
cashew-growing countries that produce RCN mainly for
generated income from cashew production (African
export and countries that have a processing industry.
Cashew Alliance, 2019).
Countries that produce RCN but do not process them
on a significant scale retain only a small share of the There is also an important gender dimension in cashew
value that is generated in the cashew industry. This production and processing, in which women play an
represents a significant potential in terms of local value important role. For instance, in India, more than 90 per
creation, employment and rural development. This cent of labourers employed in cashew processing
potential exists in all cashew-growing regions, but the are women who consequently bear the brunt of
bulk of it is located on the African continent. While Africa health hazards related to cashew processing (VV Giri
accounted for 52 per cent of global RCN production in National Labour Institute, 2014). In Africa, manual
2018, it only processed 7.1 per cent of this share (figure processing tasks such as peeling and cleaning are
23). On the other hand, Asia produced 42.7 per cent predominantly performed by women (African Cashew
of global output of RCN but processed 87.5 per cent.
Initiative, 2012; Root Capital, 2018). However, there
However, within the group of cashew producers in Asia,
is evidence that most cashew processing plants in
there are countries that largely export RCN, notably
Africa are headed by men (Centre for the Promotion
Cambodia. Latin America and the Caribbean essentially
of Imports from Developing Countries, 2018) and that
processed its own production of RCN in 2018, plus
most cashew plantations are owned by men (African
a small volume of RCN imported to Brazil from Côte
Cashew Initiative, 2010). These inequalities in the
d’Ivoire and minus a smaller quantity exported from
cashew value chain highlight that policy interventions
Central America to India.
in the cashew sector need to take a gender-aware
Since most global cashew production takes place on approach and include measures to strengthen the role
small farms in rural areas, local value retention can of women throughout the cashew value chain.
Figure 23
Shares in cashew production and primary processing by region, 2018
(Percentage)
100 5.3 5.4
90 7.1
80
70 52.0
60
50
87.5
40
30
42.7
20
10
0
Production Primary processing (deshelling)
Asia Africa Latin America and the Caribbean
Source: UNCTAD calculations, based on data from Comtrade, DCCD, FAOstat, the General Department of Viet Nam Customs and
Viet Nam statistical yearbooks.You can also read