COMMODITY INSIGHTS INFOCUS - ANZ AGRI FEBRUARY 2022
←
→
Page content transcription
If your browser does not render page correctly, please read the page content below
ANZ AGRI
   INFOCUS
    FEBRUARY
      2022

COMMODIT Y
 INSIGHTS
FOREWORD

While everyone involved in agriculture is well                Crucially, it is just as important to remember that
accustomed to the cycles of the industry, it has              the glass is also half full. While every challenge is a
been a long time since the year began with so                 day closer so is every great opportunity. Taking the
many positives. Despite all the complexities from             time to research and implement a change to any
many aspects of farming, nothing is as important              operation can bring a wide range of benefits – not
as the season itself, and in almost every farming             just economic and agronomic, but also increasing
region of Australia, the level of rainfall, combined          the enjoyment and mental stimulation of running
with the summer temperatures over the past few                the business. This could take a vast array of forms
months have been excellent. This particularly                 – whether increasing farm plantations for stock
includes livestock or dairy producers making the              benefits and income diversity, exploring new crop
most of some of the best late summer pasture                  varieties, or implementing new developments in
in years to keep stock in top condition and save              agtech, genetics or sustainability management.
on supplementary feeding costs, as well as grain
                                                              This potential to grasp new opportunities at the
producers, fresh from a record harvest, preparing to
                                                              right time extends right down the agri supply
sow into areas of excellent soil moisture.
                                                              chain, as companies right from the farm-gate to
At the same time, while prices for agri commodities           the consumer’s table look for new efficiencies, new
may start to level after some of the extraordinary            markets, and new technologies. The importance of
peaks of 2021, they remain historically very high             developing a number of these changes will have
across the board. Whether it is cattle, sheep,                been as a reaction to the ongoing Covid-related
dairy products or grains and oilseeds, most agri              supply chain interruptions, but there is every reason
commodity prices are continuing to be boosted.                why these developments could have long terms
There are challenges faced by Australia’s main                benefits for many businesses.
global competitors, increasing global demand as
                                                              For agribusinesses who are doing well at the start
economies continue their Covid recoveries, and a
                                                              of 2022, the benefits are only partially due to the
heightened push to procure exports based on the
                                                              impact of good weather and favourable global
global geopolitical uncertainties – all topped off by
                                                              factors, and more to do with all the hard work
the high production volumes, Australian producers
                                                              the industry has experienced in tougher years
have largely continued to enjoy in the last two
                                                              leading up to this point – and for that, farmers and
years since the drought.
                                                              agribusinesses should justly be proud. The need to
As agricultural producers and supply chain                    make the most of these good times will be the next
operators look ahead to see what the year may                 iteration of that hard work.
hold, it will be important to view the glass (of good
local milk or perhaps Chardonnay) as being both
half empty and half full.
The half empty glass reminds all those in
agribusiness that while a great season may be                 Mark Bennett
a time to enjoy the fruits of your hard work, and             Head of Agribusiness & Specialised Commercial,
to take a break at some point, it is not a period             Business & Private Bank
for complacency. At some point, the season will
                                                                 @bennett2_mark
inevitably turn, commodity prices will come
down from their highs, and interest rates will
eventually rise again. For these and other possible
eventualities, agribusinesses across Australia need
to continue to plan their strategies accordingly.

                                                        PAGE 01
GLOBAL CROPPING INSIGHTS

OVERVIEW

+		Global stock-to-use ratios remain highest in             +		Soybeans aside, China’s share of the global
    the geopolitically sensitive staple grains of                imports for other crops is less concentrated
    wheat and rice                                               than may be widely thought
+		China’s high end-stock policy will continue              +		The percentage of Australian wheat, canola
    to impact the global grain trade                             and barley exported has seen recent strong
                                                                 growth based on robust global demand

While the grains and oilseeds sector may have                Using data from the USDA from 1999 to 2021,
two fundamental events each year, globally it                it is possible to examine several aspects of the
is in a constant cycle. Granted, the central tasks           world’s grains and oilseeds landscape over the
for every grain grower in the world are sowing               past two decades and to discuss both the causes
and harvesting, while crop monitoring, input                 and possible opportunities, particularly for the
application and machinery maintenance also                   Australian sector.
remain vital.
Yet while these factors are central to each farm,
it is global factors and cycles which will normally
be the major determinants of the price of each
commodity. In addition, analysis of these cycles,
particularly over the longer term, will play an
indirect but important role in the cropping
strategies both of farmers and individual
countries, as they clarify potential issues such as
crop concentration risk, market concentration,
opportunities for alternative crops, and areas
where greater research may be required.
This longer-term analysis is particularly pertinent at
the current time, with most grain and oilseed prices
sitting at multi-year highs. This has largely been
the result of geopolitical volatility, but also due
to poorer crop forecasts in some regions, as well
as ongoing strong demand as many economies
gradually recover from Covid-related disruptions.

                                                         PAGE 02
GLOBAL STOCK TO USE RATIOS OF MAJOR GRAINS AND OILSEEDS
40
35
30
Stock to Use Ratios
25
20
15
10
5
0
0
1
2
3
4
5
6
7
8
9
0
1
2
3
4
5
6
7
8
9
0
1
00
00
00
00
00
00
00
00
00
00
01
01
01
01
01
01
01
01
01
01
02
02
/2
/2
/2
/2
/2
/2
/2
/2
/2
/2
/2
/2
/2
/2
/2
/2
/2
/2
/2
/2
/2
/2
99
00
01
02
03
04
05
06
07
08
09
10
11
12
13
14
15
16
17
18
19
20
19
20
20
20
20
20
20
20
20
20
20
20
20
20
20
20
20
20
20
20
20
20
Barley Corn Wheat Soybeans Canola Oats Rice
Source: USDA PSD, ANZ
One of the most-watched aspects of the global many countries are likely to seek to retain or increase
grain sector is the stock-to-use (SU) ratios or the food reserves, demand for these staples is unlikely to
level of grain in storage compared to the demand weaken markedly. This is even despite a gradual shift
at the time. SU ratios have a major impact on the from rice to meat in the diets of consumers in the
price, as low levels can trigger concerns of possible countries where incomes are increasing.
shortages, leading to enhanced buying levels, as
Any discussion around global grain and oilseed
countries seek to increase their stocks. These levels
stocks needs to have a major focus on China. This is
are also likely to increase at times of geopolitical
not just because China has around twenty per cent
volatility, as countries weigh the risk of possible
of the world’s population and will therefore always
export bans from their main suppliers.
be a major food consumer. Importantly, this is also
Looking at the data, it is unsurprising that both rice due to the policies of the Chinese government in
and wheat are by far from the two main crops with terms of maintaining a healthy level of grain and
the highest SU levels. Each of these is a staple food oilseed stocks, as well as the feed needs of China’s
for many countries, including noodles and bread. complex animal supply chain.
The upward trend in SU ratios has largely continued
For almost the past decade, China’s end stocks of
since 2006/07, which was around the time that
both corn and rice have accounted for between 60
several countries and governments experienced
and 70 per cent of the global total. In terms of corn,
food riots due to concerns over shortages, as many
China relies on having adequate levels of it for feed
global exporters instituted temporary bans. In this
for the pork supply chain, particularly as it rebuilds
period, many countries have strategically built up
its hog herd after the impact of African Swine Fever
their food reserves, including the infrastructure to
over the past few years. In addition, China also needs
achieve this over the long term in a bid to protect
to ensure that it will have adequate corn reserves
themselves should the same level of uncertainty
for a reasonable term, given the fluctuations in its
arise again.
domestic corn industry. As the country has adjusted
While grain can be stored for a reasonable period, it its program around stockpiling domestic corn, as
remains a perishable product, thus requiring reserves well as paying minimum purchase prices, domestic
to be regularly replenished. As a result, given that production has shown a level of volatility.
PAGE 03
CHINA % OF MAJOR GLOBAL GRAIN AND OILSEED END STOCKS
80%
70%
60%
50%
40%
30%
20%
10%
0%
0
1
2
3
4
5
6
7
8
9
0
1
2
3
4
5
6
7
8
9
0
1
00
00
00
00
00
00
00
00
00
00
01
01
01
01
01
01
01
01
01
01
02
02
/2
/2
/2
/2
/2
/2
/2
/2
/2
/2
/2
/2
/2
/2
/2
/2
/2
/2
/2
/2
/2
/2
99
00
01
02
03
04
05
06
07
08
09
10
11
12
13
14
15
16
17
18
19
20
19
20
20
20
20
20
20
20
20
20
20
20
20
20
20
20
20
20
20
20
20
20
Barley Corn Oats Canola Soybeans Wheat Rice
Source: USDA PSD, ANZ
While China’s high rice stocks are also a protection of its soybeans and barley consumption. Given
against possible, at times they are also as a result of the strength of the latter, it is little surprise that
fiscal levers used to maintain high domestic prices Australian barley exporters, shut out of China by
through government purchases. For rice, as well as high tariffs were quickly able to find new markets,
for corn and, to a degree, wheat, the high stocks can as China quickly sought other major global barley
be interpreted as a positive sign that demand will exporters to fill this gap.
stay strong for the long term. However, particularly
Interestingly, China is also reasonably reliant on
for exporters to China, a very high level of stocks
imports of oats for its domestic consumption, a
could also be a sign that China may reduce buying
smaller but important opportunity for Australian
for a period, increasing the need for alternative
growers.
markets.
From an Australian production perspective, it is
In terms of China’s level of concentration as
interesting to observe the difference in export
an importer for global grains and oilseeds, it is
dependency between different crops over the
interesting to look at this from two angles. As far as
period. Certainly, the major crops of wheat,
China’s percentage of total global imports of any
barley and canola remain overwhelmingly export
grain or oilseed, it is the dominant buyer of soybeans,
focussed, with wheat and canola at times seeing
largely as animal feed, as well as for cooking oil. After
exports exceed 80 per cent of production. One
this, however, it is a major gap to the next highest,
aspect which does stand out is the volatility of
barley and canola, both roughly between 20 and 30
exports over that period. This could be driven by
per cent of global imports. This highlights the largely
factors including enhanced domestic demand,
diverse global market opportunities for grain and
particularly through feed, reduced production
oilseed exports, particularly for Australia.
levels leading to the tight supply, and increased
From a different angle, China’s reliance on some global competition. Nevertheless, it is a further
of the major crops remains extremely high. In reminder that the high export levels cannot be
particular, China relies on imports for almost all taken for granted.
PAGE 04
19 19
0%
10%
20%
30%
40%
50%
60%
70%
99
0%
10%
20%
30%
40%
50%
60%
70%
80%
90%
100%
99 /2
/2 00
20 000 20 0
00 00
/2 /2
20 00
20 001 01 1
01 /2
/2 00
20 2
Source: USDA PSD, ANZ
Source: USDA PSD, ANZ
20 002 02
02 /2
/2 00
20 003 20 3
03 03
/2 /2
20 00
20 004 04 4
04 /2
Barley
/2 00
20 005 20 5
05 05
Barley
/2 /2
20 00
20 006
06 6
06
/2
Corns
/2 00
20 007 20 7
07 07
Corn
/2 /2
20 00
20 008
08 8
08
/2 /2
Canola
20 00
20 009 9
Oats
09 09
/2 /2
20 01
20 010 0
PERCENTAGE OF MAJOR AUST CROPS EXPORTED
10 10
PAGE 05
/2 /2
20 01
20 011
11 1
11
Canola
Soybeans
/2 /2
20 01
20 012
12 12 2
/2 /2
CHINA % OF MAJOR GLOBAL GRAIN AND OILSEED IMPORTS
20 01
20 013
13 13 3
Wheat
/2 /2
20 01
Soybeans
20 014
14 14 4
/2 /2
20 01
20 015
15 5
Oats
15
/2 /2
20 01
20 016 6
Wheat
16 16
/2 /2
20 01
20 017 7
Rice
17 17
/2 /2
20 01
20 018
18 18 8
/2 /2
20 01
20 019
19 19 9
/2 /2
20 02
20 020
20 20 0
/2 /2
02 02
1 1
BEEF INSIGHTS

OVERVIEW

+		While restocking activity may slow over the             +		The past two years of good seasons should
    warmer months, an upcoming good season                      see very strong calving percentages in 2022
    and strong pasture growth should see it return
                                                            +		Many Australia’s competitors in the Chinese
+		The structural decline in the US cattle herd                beef import market will continue to have a
    could see excellent potential for the growth in             level of uncertainty around food safety as well
    the imports of both Australian manufacturing                as reliability
    and premium beef

On most fronts, the Australian cattle and beef              correction to finally hit the market, having been
industry is heading into 2022 in an excellent               predicted by many observers over the past two
position. Most importantly, the seasonal outlook            years, yet never actually happening.
remains good for the foreseeable future, providing
                                                            There are several factors behind this fall, both
a particular positive for restockers. Nationally, the
                                                            direct and indirect, but it will be the trend to watch
country’s cattle herd is forecast to continue to
                                                            through this year. At the saleyard level, the fact
climb, which will ease the tight supply issues which
                                                            that the fall happened at the start of February may
have impacted the sector as it has continued to
                                                            well reflect the fact that many farmers had actively
recover from the drought over the past two years.
                                                            participated in the annual weaner sales early in
Both domestically and globally, demand for                  January, and had less need to restock than had
beef will continue to grow. At the same time,               been the case through 2021.
in Australia’s favour, many major international
                                                            Looking further ahead, the industry will be buoyed
competitors are likely to experience a range of
                                                            by a number of the forecasts in 2022 Australian
supply challenges, including herd declines, supply
                                                            Cattle Industry Projections, recently released by Meat
chain disruption, and food safety concerns.
                                                            and Livestock Australia (MLA). Broadly, underpinned
Arguably the most discussed aspect of the                   by a favourable weather outlook for at least the
Australian cattle sector over the past two years            coming year. In the medium term, the Bureau of
has been the rise in prices. As the industry moves          Meteorology is forecasting above-average rainfall for
through the first quarter of the 2022 year, while           the major cattle regions of NSW and Queensland,
prices remain high, it appears that the new story           with an average rainfall forecast for almost every
may potentially be one of price volatility over the         other cattle region in Australia. This should mean
coming months.                                              that most of the country will see a continuation
                                                            of the good pastures experienced over the past
At the start of February, the EYCI saw a two-day
                                                            two years. In addition, a forecast of above-average
fall of almost 80 c/kg, its biggest drop in? While
                                                            temperatures for Queensland, combined with the
this meant that prices still stayed above 1,100 c/
                                                            rain should see enhanced pasture growth, lifting the
kg, it did highlight the potential for some kind of
                                                            potential for heightened restocking activity.

                                                        PAGE 06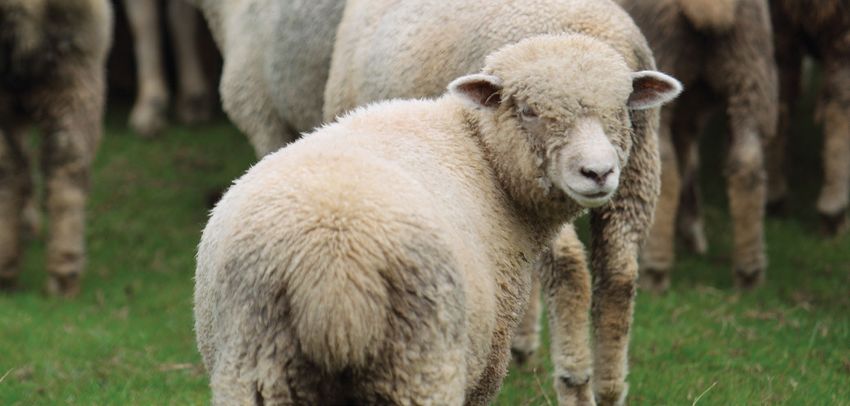
For processors, the forecast rise in slaughter
       HEADING INTO 2022, WHILE THE
                                                                numbers will be very welcome news, primarily
                                                                because it is likely to see an easing of high prices,
 AUSTRALIAN CATTLE HERD IS FORECAST
                                                                but also in that, it will allow them to not only
  TO CONTINUE ITS STEADY REBUILD, THE
                                                                see greater utilisation of plant capacity but to fill
  GROWTH RATES ARE LIKELY TO DIFFER
                                                                domestic and export demand. That said, processors
           ACROSS MAJOR REGIONS.                                will be very mindful of potential Covid-related
                                                                disruptions, not only from possible labour shortages
                                                                but also from disruptions to freight and logistics.
In southern Australia, given the likelihood of a                Given the rise in slaughter numbers, combined
third straight good season, the large herd of young             with improved animal weights, overall beef
breeding females and heifers, already in a good                 production is forecast to rise by twelve per cent in
condition and on favourable pasture, are likely to              2022, to around 2.1 million tonnes. Looking further
see high calving percentages, further boosting                  ahead, the forecast beef production in 2024 of 2.44
herd growth.                                                    million tonnes would be a new record, higher than
In the northern cattle area, where rainfall over the            the previous mark set in 2019 amid the drought-
past two years has been less favourable, the herd               induced high sell-off.
growth is likely to remain slower, at least until those
regions have seen two successive seasons of good
conditions.                                                         GLOBALLY, THE OUTLOOK FOR MAJOR
Overall, the national cattle herd is forecast to                    EXPORT MARKETS REMAINS STRONG,
grow by four per cent over the year, reaching 27.2                    DRIVEN BY DIFFERENT FACTORS.
million head in 2022. On the current projects, this
could see the herd continuing to grow to 28.2
million head by 2024, which would be the highest
level since 2014. One feature of the growing herd               The US market is likely to strengthen for Australian
will be an abundance of relatively young cattle,                exporters, as that country’s cattle herd enters a
following the sell-off during the drought, as well as           structural decline, and will require greater exports
subsequent restocking and calving.                              to meet ongoing strong domestic demand. The
                                                                South Korean market is also likely to present
One important result of the strong herd growth                  increased opportunities for Australia, due to
will be an easing of the tight supply of slaughter              reduced supplies of the US beef.
numbers which have impacted the beef supply
chain throughout the post-drought restocking                    For China, overall beef imports are forecast to
period. In 2022, particularly with calves from late             increase by ten per cent in 2022 to around 200,000
2020 and early 2021 reaching processor weight,                  tonnes. Current predictions are that the bulk of this
national slaughter numbers are forecast to rise by              will be filled by exports from Brazil and Argentina,
an impressive eleven per cent to 6.7 million head.              with Australia likely to see a minor increase in
Looking further ahead, given optimal conditions,                exports. Beef exports to China remain somewhat
slaughter numbers are forecast to continue to                   unpredictable, driven by factors at both ends of
grow strongly, reaching 7.85 million head by 2024.              the supply chain. Australian processors remain
This would be a rise of over 30 per cent in 2021,               aware of the potential of further bans on individual
highlighting the tight conditions for processors                abattoirs, while South American exporters could
over the past year. Notably, however the fact that              also be impacted by any discoveries of BSE, or
even this figure would still be below the ten-                  export bans, as seen in Argentina last year. At the
year slaughter average emphasises the scale of                  import end, China’s strong “Covid-Zero” policy could
the impact of the drought, and the time it takes                also potentially impact economic growth, and
to recover.                                                     subsequently consumer beef demand. In addition,
                                                                the level of Covid activity in a particular country’s
                                                                meat sector could also impact which exporters and
                                                                markets China utilises more or less.

                                                          PAGE 07
NATIONAL CATTLE SLAUGHTER FORECAST TO RISE WITH HERD REBUILD

                                     30,000                                                                                                           10,000
Australian Cattle Herd ('000 head)

                                     25,000
                                                                                                                                                      8,000

                                                                                                                                                                 Cattle Slaughter ('000 head)
                                     20,000
                                                                                                                                                      6,000

                                     15,000

                                                                                                                                                      4,000
                                     10,000

                                                                                                                                                      2,000
                                      5,000

                                             -                                                                                                        -
                                                 2016   2017       2018        2019         2020      2021e      2022f       2023f           2024f

                                                               Cattle Numbers ('000 head)                     Cattle Slaughter ('000 head)
   Source: MLA, ANZ

 BEEF PRODUCTION FORECAST TO GROW, THOUGH CARCASE WEIGHT GROWTH WILL FLATTEN

                                     3,000                                                                                                                315

                                     2,500
Beef Production ('000 tonnes cwe)

                                                                                                                                                          305
                                                                                                                                                                Avg. Carcase weight (kg)

                                     2,000

                                     1,500                                                                                                                295

                                     1,000
                                                                                                                                                          285
                                      500

                                         -                                                                                                                275
                                                 2016   2017      2018         2019         2020      2021e       2022f        2023f          2024f
                                                           Beef Production ('000 tonnes cwe)                        Avg. Carcase weight (kg)
      Source: MLA, ANZ

                                                                                            PAGE 08
EASTERN YOUNG CATTLE INDICATOR (EYCI) VOLATILE, BUT MAINTAIN STRONG LEVELS
1,400
1,200
1,000
EYCI - c/kg cwt
800
600
400
200
-
2000
2001
2002
2003
2004
2005
2006
2007
2008
2009
2010
2011
2012
2013
2014
2015
2016
2017
2018
2019
2020
2021
2022
EYCI 2011 Avg 2013 Avg 2021 Avg
Source: MLA, ANZ
PAGE 09GRAINS INSIGHTS
OVERVIEW
+ While the pre-harvest rain failed to impact crop + Saudi Arabia is now Australia’s largest barley
volumes, it did cause a notable downgrade in export market, with overall barley exports rising,
grain quality in some of the regions despite China’s prohibitive barley import tariffs
+ China has remained as a major destination + High input prices could see some reduction in
for Australian wheat exports, largely driven by crop yields for the 2022/23 harvest
strong feed needs for its recovering hog herd
Australian grain farmers know all too well that For wheat, while the record harvest of 34 million
contrary to what some people may think, there’s tonnes was up around 0.7 million tonnes, or two
never really a “downtime” of year. Certainly, the per cent, on the previous year, it was a massive
sowing and particularly harvest periods are rise of around 135 per cent on the drought-
intensively busy, but the rest of the year involves impacted crop of 2019/20. The record volume
either monitoring the crop in the ground and was particularly boosted by an optimal growing
providing the inputs needed to maximise its conditions in Western Australia, which accounts for
potential, maintaining and upgrading all the around 40 per cent of the national wheat crop.
plant and equipment needed to run an efficient
While there had been concern late in 2021 around
operation, as well as all the other aspects of the
the possible impact of weather conditions on the
modern farm.
crop in some regions, it ultimately had a minor
That said, the period around February, when the bearing on the overall harvest volume. If anything,
harvest is effectively finished across the country, the main impact of the heavy rainfall in November
at least provides the industry with some kind of 2021 on cropping regions in NSW and Northern
a breather to reflect on the harvest just passed Victoria was on the quality of the crop. The rain
and evaluate the factors likely to impact the year caused some of the grains to sprout, resulting in a
ahead. This could include both the choice of crops reasonable volume of grain being downgraded to
to be sown, as well as the variables which may feed wheat in these regions.
impact grain prices.
The sharp increase in the proportion of feed wheat
Despite some concerns toward the end of as part of the overall harvest had a notable impact
the season, the 2021/22 Australian grain crop on wheat prices. Ordinarily, the price gap between
is estimated to have hit new record levels. In feed wheat and milling wheat is around $20 to $40
particular, the wheat crop reached another record, per tonne. However, given the major volume of feed
while Australia’s barley reached its third-highest wheat, this gap grew to around $110 to $150 per
level, despite earlier concerns on the impact tonne. Notably, milling wheat prices rose sharply
of Chinese tariff’s on barley farmers’ planting from their pre-harvest levels, while feed wheat prices
intentions.
PAGE 10declined from those levels, although remained Just as the weather had impacted the wheat crop
relatively high based on strong global demand. in different regions, the quality of barley in some
regions of NSW, as well as northern Victoria, was
In line with the record wheat harvest, Australia
also downgraded as a result of heavy rainfall.
is also likely to see record wheat export levels of
That said, given that most barley from these areas
around 25.5 million tonnes, up around seven per
is feed quality, the impact on price and exports
cent on the previous year. This will be driven not
was minimal.
just by the record crop, but by ongoing strong
global grain import demand. In terms of barley export, overall volumes rose by
around two per cent to 8.5 million tonnes. With the
While Indonesia would ordinarily be Australia’s
Chinese tariffs meaning that barley exports to that
largest wheat export market, the 2021/22 export
country have fallen to zero, the largest market is
season has seen exports to China reach around
now Saudi Arabia, which now accounts for around
0.93 million tonnes, over double those to Indonesia
36 per cent of all exports. Other major barley
in the same period. While the bulk of exports
markets include Japan, Thailand and Vietnam.
continues to be Asian markets, exports to African
markets continue to grow strongly. Domestically, strong feedlot utilisation has
continued to drive domestic barley demand, with
While not at the same heights as the wheat crop,
this trend likely to continue, on the back of the
the Australian barley harvest of thirteen million
continuing growth of the domestic cattle herd.
tonnes in 2021/22 is still estimated to have been
the third-largest ever, not far behind the record Looking ahead, Australian grain producers will be
crop of 13.5 million tonnes in 2016/17. factoring in the outlook for fertiliser and chemical
prices into their planting strategies, particularly
The imposition by China of prohibitive tariffs
given the ongoing uncertainty around global
in 2020 have not had a major impact on barley
supply chain disruptions and Chinese export bans.
plantings. If anything, the shift of some barley
One impact may be a slight shift by some producers
acreage towards canola was driven by high oilseed
to more legume crops, while other producers may
prices at the time.
accept that reduced fertiliser usage may lead to
lower yields than over the past two years.
WHEAT PRODUCTION AND EXPORTS WELL ABOVE THIRTY YEAR AVERAGE
35,000
30,000
25,000
'000 tonnes
20,000
15,000
10,000
5,000
-
1990–91
1991–92
1992–93
1993–94
1994–95
1995–96
1996–97
1997–98
1998–99
1999–00
2000–01
2001–02
2002–03
2003–04
2004–05
2005–06
2006–07
2007–08
2008–09
2009–10
2010–11
2011–12
2012–13
2013–14
2014–15
2015–16
2016–17
2017–18
2018–19
2019–20
2021-22f
2020-21s
Wheat Production (000 MT) Wheat Exports (000 MT)
Production Avg. 1990-2020 Exports Avg. 1990-2020
Source: Source USDA, ANZ
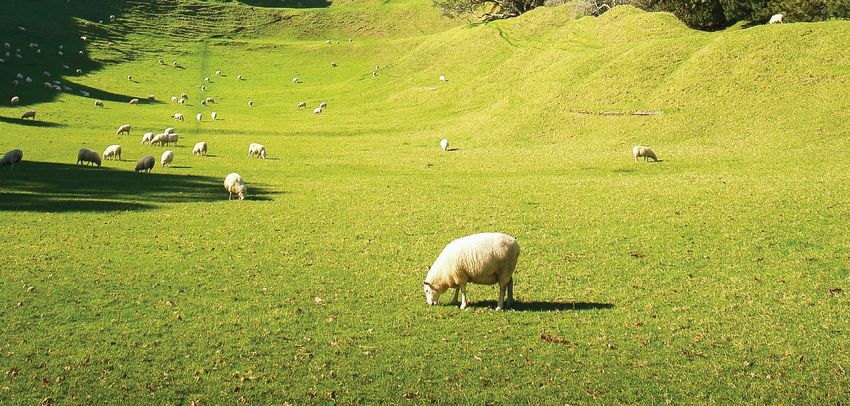
PAGE 11SHEEP INSIGHTS
OVERVIEW
+ The recovery in processor demand has + Export demand has been a driving force
introduced some volatility into the market, with for strong saleyard prices for many years –
some producers holding stock back from the which is expected to continue as Australian
saleyard until prices stabilise; producers take advantage of their strong
competitive position;
+ Yardings fell heavily throughout January before
recovering slightly, although slaughter numbers
at the end of January remained strong across
most States except South Australia.
Disruptions to the processing sector stemming available labour. While the National Trade Lamb
from increased covid infections have flowed on Indicator has been in a steady decline from the
to saleyard prices with the market showing some heights of 950c in August last year, in line with
volatility. Yardings have also fallen as producers seasonal expectations, lower prices have also
hold back stock from the saleyard until prices seen yardings decline considerably. Since mid-
stabilise. However, the strong season means that 2021, prices across categories have been mixed,
there is likely to be a significant backlog of heavier with mutton prices now lower than winter 2021
lambs ready to hit the market in the coming as a result of the decline in demand from export
months, which may put some downward pressure markets, while lighter lamb categories have
on prices. underperformed the heavier categories during
the same time. Prices for restocker lambs remain
a strong category – again, in line with seasonal
expectations as producers expand their flocks prior
LOOKING FORWARD, EXPORTS HAVE to joining.
PROVEN CRITICAL TO SUPPORTING
DOMESTIC PRICES IN RECENT YEARS, AND
Contrary to the fall in prices across the eastern
States, the saleyard prices in Western Australia
THAT TREND LOOKS SET TO CONTINUE
have climbed sharply in recent weeks, as processor
WITH AUSTRALIAN LAMB IN A VERY
activity continue, while New South Wales prices
COMPETITIVE POSITION.
rallied strongly in late January as yarding activity
fell sharply. Producers continued to send lambs to
market in the Southern States, although in lesser
Australian saleyard prices entered 2022 with a numbers, and as a result, Victoria, Tasmania and
slight slump as demand for processors suffered South Australian saleyards have seen the largest
a hiatus as a result of covid infections limiting decline in prices.
PAGE 12NATIONAL SALEYARD SHEEP AND LAMB PRICES
1100
1000
900
800
Prices (Ac/kg)
700
600
500
400
300
2018 2019 2020 2021 2022
Restocker lamb 0-18kg Merino lamb 16-22kg Light lamb 12-18kg
Trade lamb 18-22kg Heavy lamb 22+kg Mutton 18-24kg
Source: MLA, ANZ
TRADE LAMB SALEYARD PRICES BY STATE
1100
1000
900
Prices by State (Ac/kg)
800
700
600
500
2020 2021 2022
NSW Victoria Tas SA WA
Source: MLA, ANZ
PAGE 13This downward trend is not expected to continue international scene than beef, poultry or chicken,
however, as abattoirs resume processing and and the United Nations Food and Agriculture
buyers return to the saleyards, producers are Organisation forecasts a continued increase in per
expected to follow. However, a strong season capita consumption in the medium-term. So as
means many producers have continued to fatten one of the world’s largest sheep meat producers
lambs on farm instead of sending them to market, – where is the Australian industry placed to take
as such there are likely to be a significant number advantage of this global demand?
of trade and heavy lambs hitting the market in
Historically, Australian lamb has traded at a
the coming weeks and months. As a measure
discount to European and United Kingdom lamb,
of how many lambs have been kept back from
but slightly more expensive than New Zealand
the saleyards, in the first four weeks of the year
lamb. A recent strong increase in New Zealand
yardings were down almost one third on the same
lamb prices stemming primarily from export
period last year – meaning an additional 200,000
demand from the United States, China and Europe
lambs may be expected to hit the saleyards in the
has seen New Zealand lamb recently return to
short-term.
par with Australian lamb. At the same time, the
While domestic demand and the national flock relatively small flock size across Europe and the
rebuild has been the primary driving force behind UK has meant that they have generally higher
the strong performance of the Australian sheep operational costs which, to a certain extent, is
industry in recent years, the growing international accepted by European consumers who see local
demand has also been a key factor. Sheep meat lamb as the higher quality product.
consumption remains far less per capita on the
GLOBAL LAMB PRICES (AUD/KG)
13
12
11
10
Prices (AUD/kg)
9
8
7
6
5
2018 2019 2020 2021 2022
Australia (Trade lamb) New Zealand (lamb) (AUD/kg) Great Britain (lamb) (AUD/kg)
Source: MLA, AHDB, ANZ
2020 saw a sharp increase in the saleyard prices lamb, and a decline in UK lamb production, it
of Australian lamb which leapt away from our is expected that Australian produce will find a
New Zealand competition, giving New Zealand a demand against the generally more expensive
competitive edge going into the price-sensitive UK and European lamb. Added to New Zealand
China market. The continued demand from China mutton now surpassing the price of Australian
for lamb as a pork substitute also helped push New mutton, the outlook for the competitiveness of
Zealand back up to par with the Australian product. Australian sheep exports are very strong.
With the opening of the British market to Australian
PAGE 14WOOL INSIGHTS
OVERVIEW
- The Australian wool industry has started 2022 - A strong flock rebuild and season is expected to
strongly, with the Eastern Market Indicator now see exceptional growth in the Australian wool
sitting higher than at the beginning of the clip in 2021/22;
pandemic;
- The cost of shearing as a percentage of wool
- Global demand for woollen apparel is recovering receipts are sitting above the 10-year average,
strongly as workers start to return to the office; but lower than its 2005 peak.
Wool prices have seen a strong start to the year performed particularly strongly in late January,
with the Eastern Market Indicator (EMI) entering with 17-micron wool reaching its highest level for
January nearing an annual high of just under both 2021 and 2022 – as did 21 – 23 micron wool.
1450Ac/kg. Price gains have been seen across all Looking forward, the number of bales on offer is
micron categories, although the coarser categories expected to be down on last year in the latter part
are still down on the higher levels reached early in of February which may put further upward pressure
2021. This has meant that the first 5 weeks of 2022 on prices.
has seen the market trading in the green. Australia
The recovery of the United States and European
wide, the sense of optimism in both sheep and
economies are seeing a return to ‘normal’ demand
wool is anticipated to see the domestic flock reach
for apparel, including demand for woollen suits
70 million head this year, while wool production is
as workers start to return to the office. A harsh
also expected to jump an exceptional 8 per cent
winter in India has also boosted demand for warm
on the back of higher flock numbers and a strong
clothing and woollen material.
season.
With a strong flock rebuild underway, the Australian
The Australian wool market entered February after
Wool Production Forecasting Committee has
5 solid weeks of growth, and the EMI bettering
forecast an 8.0 per cent increase in 2021/22 for
the psychologically significant threshold of March
shorn wool production. This predicated on an
2020 – the start of the covid downturn for the
increase of at least 6.6 per cent in all States, with an
wool industry. The EMI has also been substantially
increase of 21 per cent in Queensland and 14 per
supported by global nervousness around Russia
cent in Tasmania. This level of production assumes
and Ukraine which has led to the appreciation of
an increase in domestic flock numbers of over 3
the US dollar against the Australian dollar as capital
million head, to 70 million head across the country.
flows towards the major global currencies.
One of the key issues facing the Australian wool
Demand from China, India and Europe all
industry currently is the availability of shearers and
performed strongly and prices for all microns
the resulting increase in the cost of shearing. With
improved despite a greater number of bales on
the rise in popularity of shedding breeds such as
offer for the season. The finer end of the market
PAGE 15Australian Whites, attention has returned to the on the 10-year average of 18.2 per cent. It is also of
cost-return equation, particularly for meat breeds. note that as a percentage of total costs and total
Figures from the Australian Bureau of Agricultural receipts for sheep producers, the cost of shearing is
and Resource Economics and Sciences (ABARES) at the lower end of its historic levels at 7.7 per cent
show that for sheep producers shearing costs now of total costs compared with a peak of 11.9 per cent
sit at just over 20 per cent of total wool receipts – of total costs in 2001.
down from a high of 26.6 per cent in 2005, but up
SHEARING AND CRUTCHING COSTS (ALL INDUSTRIES)
5.00% 30.00%
4.50%
25.00%
4.00%
3.50%
20.00%
3.00%
Per cent
Costs
2.50% 15.00%
2.00%
10.00%
1.50%
1.00%
5.00%
0.50%
0.00% 0.00%
90
92
94
96
98
00
02
04
06
08
10
12
14
16
18
20
19
19
19
19
19
20
20
20
20
20
20
20
20
20
20
20
Shearing costs as a percentage of total cash costs
Shearing costs as a percentage of total cash receipts
Shearing costs as a percentage of wool receipts (RH axis)
Source: AgSurf
SHEARING AND CRUTCHING COSTS (SHEEP INDUSTRY)
14% 30%
12% 25%
10%
20%
8%
15%
Per cent
6%
Costs
10%
4%
2% 5%
0% 0%
98
14
16
18
20
90
92
94
96
00
02
04
06
08
10
12
20
20
20
19
19
19
19
19
20
20
20
20
20
20
20
20
Shearing costs as a percentage of total cash costs
Shearing costs as a percentage of total cash receipts
Shearing costs as a percentage of wool receipts (RH axis)
Source: Agsurf
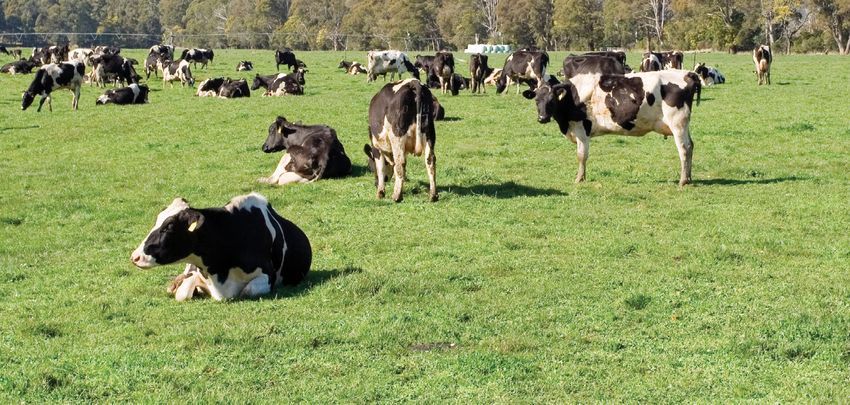
PAGE 16DAIRY INSIGHTS
OVERVIEW
+ While Australia’s overall dairy production has + Domestic and global demand for dairy
continued to decline, this is largely due to products continue to grow, particularly driven
changing land usage, with the growth in the by the post-Covid disruption recovery
beef cattle herd and sheep flock
+ Tight supply levels across the major global dairy
exporters have pushed farmgate and trade
prices to strong highs
While the Australian agricultural headlines have previous year. If this trend continues, working on
been dominated by the ongoing post-drought the average gap of these months over the previous
strength of the beef cattle and sheep markets, with year, then Australia’s 2021/22 milk production could
high prices accompanying rebuilding numbers potentially be heading for an overall figure of 8.6
in the national herd and flock, the recovery in the billion litres, which would be around 200 million
national dairy sector is arguably slower. This has litres down on the previous marketing year.
been reflected in both milk production levels, as
Interestingly, based on those figures, the trends in
well as the scale of the national dairy herd. That
YOY milk production differed markedly by region.
said, given that dairy products are a reasonably
Gippsland, Western Victoria, and Tasmania all saw
generic global commodity, the challenges
falls on the month for the previous year, while
impacting some of Australia’s global competitors
Northern Victoria, NSW, and SA all saw increases.
are translating into a period of strong prices for
dairy products, a development that will be of relief It is difficult to read too much into these variations,
to many producers across the sector. given that they could be driven by a variety of
factors. Differences in rainfall by region may have
In terms of Australia’s milk production, in the most
impacted pasture growth, which could have a
recent figures available, for November 2021, the
flow-on effect on milk production, given the
monthly milk production fell by around five per
regional herd sizes remained the same. However,
cent to just under 900 million litres. On its own,
particularly in areas that border each other, it could
this decline is not surprising – Australia’s monthly
also be a result of the ongoing strength of the beef
milk production normally reaches an annual peak
cattle market, and the impact of more dairy country
in October each year, before beginning a regular
being turned over to beef operations. For some
decline until it bottoms out in February.
dairy regions, a similar challenge could be coming
What was notable, however, was that this was from the ongoing strength in the sheep industry,
the fifth successive month that Australia’s milk backed by strong lamb and mutton prices.
production had been below the same month in the
PAGE 17One further indication of the challenge to a sharp For Australia’s estimated 4,600 dairy farmers, the
revival for the dairy industry is reflected in the current market is also a time for optimism, given
trends for the overall dairy herd. Under these the current high farmgate prices. In particular,
figures, both Australia’s dairy cattle herd, as well as the record farmgate prices currently being paid
the milking herd, show no sign at the moment of to the dairy farmers in New Zealand, the world’s
reversing the downward trend they have now been largest dairy exporter, is reflective of the current
following for the past decade. Indeed, the current global conditions and bode well for Australian
2021/22 forecasts of a dairy cattle herd of 2.3 producers for the months ahead. As most global
million head and a milking herd of 1.4 million head economies continue their recovery from the major
would both equal the lowest points in at least the Covid disruptions, consumer demand for the dairy
last thirty years. products continue to strengthen. In many cases,
this could even be enhanced, as the stronger focus
Importantly, while the overall volume of
on healthy diets sees even more of a shift to greater
production, as well as the dairy herd, are each
dairy consumption. However, in terms of supply,
remaining low, this is not necessarily reflective of
each of the major global producers is seeing little
the current fortunes of Australia’s dairy producers.
to no growth, putting upward pressure on the
For a start, at a farm management level, an average
prices. Production from New Zealand has been
milk yields per cow have continued their ongoing
essentially flat for the twelve months year-on-year,
steady rise. To the industry’s credit, it is admirable
while the EU has seen a similar trend, based on
that the forecast average yield for 2021/22 of
declines in Germany, France, and the Netherlands.
around 6,600 litres is more than double the average
In the US, while milk production was up slightly
figure in 1983/84.
over the last twelve months, this trend is likely
to decline in the coming years, as the herd goes
through a contraction in size.
AUSTRALIA MONTHLY MILK PRODUCTION (MILLION LITRES)
1,000
950
900
850
Million Litres
800
750
700
650
600
October
March
April
August
May
November
June
December
July
February
January
September
2019/20 2020/21 2021/22
Source: Dairy Australia, ANZ
PAGE 18Million Head Million Head
-
0.5
1.0
1.5
2.0
2.5
-
0.5
1.0
1.5
2.0
2.5
3.0
3.5
1979–80 1989–90
1981–82 1990–91
Source: ABARES, ANZ
Source: ABARES, ANZ
1991–92
1983–84
1992–93
1985–86 1993–94
1987–88 1994–95
1995–96
1989–90 1996–97
1991–92 1997–98
1998–99
1993–94
1999–00
1995–96 2000–01
1997–98 2001–02
Dairy Cattle (Million)
2002–03
DAIRY CATTLE VS. MILKING HERD (MILLION)
Milk Yield Per Cow (Litre Per Cow) (RHS)
1999–00
MILKING HERD (MILLION) VS. LITRE PER COW
2003–04
2001–02 2004–05
PAGE 19
2003–04 2005–06
2006–07
2005–06 2007–08
2007–08 2008–09
2009–10
2009–10
2010–11
2011–12 2011–12
2013–14 2012–13
2013–14
Milking Herd (Million)
2015–16
2014–15
Milking Herd (Million)
2017–18 2015–16
2019–20 2016–17
2017–18
2021–22f 2018–19
-
2019–20
1,000
2,000
3,000
4,000
5,000
6,000
7,000
2020–21s
2021–22f
Litre Per CowPAGE 20
AUSTRALIAN
                           ECONOMIC INSIGHTS

                            Interest rate increases loom in 2022

THE ECONOMY ENDED 2021                                            RBA TO LIFT CASH RATE TO 0.75% END OF
ON A STRONG NOTE                                                  2022 AND 2% END OF 2023

December data was strong across the board                         The RBA doesn’t expect growth in the Wage Price
in Australia, providing a good foundation for                     Index (WPI) to reach 3% until mid-2023, which
both households and businesses in 2022.                           we think is too pessimistic. Lowe suggested that
The unemployment rate fell to 4.2% and                            the RBA will be patient but a rate hike in 2022 is a
the underutilization rate (unemployment +                         “plausible scenario”. We expect a stronger wages
underemployment) fell to a 13-year low. Total                     result to trigger a cash rate hike in September 2022.
retail volumes were 3.4% higher in Q4 compared                    Once the RBA moves it will be all about the pace of
with before Delta lockdowns (Q2 2021), as                         rate hikes. We have the cash rate target at 0.75% by
spending more than bounced back after the                         the end of 2022, lifting to 2% by the end of 2023.
Delta lockdown malaise.                                           The end-point for tightening may be higher than
                                                                  the market expects, with a cash rate above 3% a
Housing market activity also showed stronger
                                                                  possibility.
momentum than expected in the last months of the
year, with new owner-occupier lending surging in
December to just 4% below the historic peak in May                INTEREST RATES WILL INCREASE GLOBALLY
                                                                  AND WILL HELP KEEP AUD RISES AT BAY
2021. Quarterly underlying inflation accelerated to
its highest rate since Q3 2008, and the annual figure             In the latest European Central Bank (ECB) press
pushed above the mid-point of the RBA’s target                    conference, “transitory” was not mentioned. We
band for the first time since mid-2014.                           have brought forward our expectations of a rate
                                                                  rise in the euro area to H2 2022. The Bank of
OMICRON DISRUPTIONS ARE UNLIKELY                                  England has already increased their cash rate to
TO DERAIL THE ECONOMY IN 2022                                     0.25% and announced Quantitative Tightening
                                                                  (QT), which would drive up the cost of lending and
ANZ-Roy Morgan consumer confidence is running
                                                                  borrowing money.
a little lower than usual due to Omicron and the
prospect of higher interest rates. ANZ data showed                We are also expecting the US to tighten their rates,
a downfall in consumer spending at the beginning                  and are forecasting five rate hikes over the course
of the year despite no formal lockdowns, as                       of this year. The US labour market is running hot
Omicron outbreaks led to less socialising and staff               and there was unanimity among Federal Reserve
shortages across retail and hospitality. But the ANZ              speakers last week about the need for a rate hike in
data also showed some recovery in spending in the                 March and about starting quantitative tightening
second half of January.                                           soon. We expect the AUD to drift up to 0.75 USD
                                                                  through 2022, tempered by interest rate increases
Despite Omicron outbreaks in 2022 and lots of
                                                                  globally including in the US.
jobs being filled in late 2021, ANZ Job Ads only
fell 0.3% in January. This is a very good sign that
unemployment will fall further and push wages
up through 2022.

                                                        PAGE 21
THE FALLING RATE OF PEOPLE WITHOUT WORK OR ENOUGH HOURS IS A GOOD SIGN FOR
WAGES GROWTH
5 6
8
4
10
%, sa, inverted
3
12
% y/y, sa
14
2
16
1
18
0 20
07 08 09 10 11 12 13 14 15 16 17 18 19 20 21 22
Wage price index (LHS) Underutilisation (RHS)
Source: ABS, Macrobond, ANZ Research
INFLATION HAS ACCELERATED
6
5
4
3
% y/y, sa
2
1
0
-1
04
05
06
07
08
09
10
11
12
13
14
15
16
17
18
19
20
21
22
1/
1/
1/
1/
1/
1/
1/
1/
1/
1/
1/
1/
1/
1/
1/
1/
1/
1/
1/
1/
1/
1/
1/
1/
1/
1/
1/
1/
1/
1/
1/
1/
1/
1/
1/
1/
1/
1/
Trimmed mean Inflation Headline Inflation Australia, RBA 2-3% target
Source: ABS, Macrobond, ANZ Research
PAGE 22PAGE 23
CONTACTS
MARK BENNETT                                                   IAN HANRAHAN
Head of Agribusiness & Specialised Commercial,                 Head of Food, Beverage & Agribusiness,
Commercial Banking                                             Australia – Institutional Banking
T: +61 3 8655 4097                                             T: +61 7 3947 5299
E: mark.bennett@anz.com                                        E: ian.hanrahan@anz.com

AUTHORS
MICHAEL WHITEHEAD                                              MADELEINE SWAN
Head of Agribusiness                                           Associate Director Agribusiness Research,
Insights, Institutional                                        Commercial Banking
T: +61 3 8655 6687                                             T: +61 419 897 483
E: michael.whitehead@anz.com                                   E: madeleine.swan@anz.com

SWATI THAKUR                                                   ADELAIDE TIMBRELL
Senior Analyst Institutional Client Insights & Solutions       Economist, ANZ Research
T: +91 8067 953 039                                            T: +61 466 850 588
E: swati.thakur@anz.com                                        E: adelaide.timbrell@anz.com

                                                           PAGE 24
DISCLAIMER
The distribution of this document or streaming of this video broadcast (as applicable, (“Affiliates”), do not make any representation as to the accuracy, completeness or
“publication”) may be restricted by law in certain jurisdictions. Persons who receive currency of the views or recommendations expressed in this publication. Neither
this publication must inform themselves about and observe all relevant restrictions. ANZ nor its Affiliates accept any responsibility to inform you of any matter that
1. Disclaimer for all jurisdictions, where content is authored by ANZ Research: subsequently comes to their notice, which may affect the accuracy, completeness
or currency of the information in this publication.
Except if otherwise specified in section 2 below, this publication is issued and
distributed in your country/region by Australia and New Zealand Banking Group Except as required by law, and only to the extent so required: neither ANZ nor its
Limited (ABN 11 005 357 522) (“ANZ”), on the basis that it is only for the information Affiliates warrant or guarantee the performance of any of the products or services
of the specified recipient or permitted user of the relevant website (collectively, described in this publication or any return on any associated investment; and, ANZ
“recipient”). This publication may not be reproduced, distributed or published by and its Affiliates expressly disclaim any responsibility and shall not be liable for
any recipient for any purpose. It is general information and has been prepared any loss, damage, claim, liability, proceedings, cost or expense (“Liability”) arising
without taking into account the objectives, financial situation or needs of any directly or indirectly and whether in tort (including negligence), contract, equity or
person. Nothing in this publication is intended to be an offer to sell, or a solicitation otherwise out of or in connection with this publication.
of an offer to buy, any product, instrument or investment, to effect any transaction If this publication has been distributed by electronic transmissions such as
or to conclude any legal act of any kind. If despite the foregoing, any services or e-mail, then such transmission cannot be guaranteed to be secure or error-free
products referred to in this publication are deemed to be offered in the jurisdiction as information could be intercepted, corrupted, lost, destroyed, arrive late or
in which this publication is received or accessed, no such service or product is incomplete, or contain viruses. ANZ and its Affiliates do not accept any liability as
intended for nor available to persons resident in that jurisdiction if it would be a result of electronic transmission of this publication.
contradictory to local law or regulation. Such local laws, regulations and other ANZ and its Affiliates may have an interest in the subject matter of this publication
limitations always apply with the non-exclusive jurisdiction of local courts. Before as follows:
making an investment decision, recipients should seek independent financial,
legal, tax and other relevant advice having regard to their particular circumstances. • They may receive fees from customers for dealing in the products or services
described in this publication, and their staff and introducers of business may
The views and recommendations expressed in this publication are the authors. share in such fees or receive a bonus that may be influenced by total sales.
They are based on information known by the author and on sources that the
author believes to be reliable but may involve material elements of subjective • They or their customers may have or have had interests or long or short
judgement and analysis. Unless specifically stated otherwise: they are current positions in the products or services described in this publication, and may at
on the date of this publication and are subject to change without notice; and, any time make purchases and/or sales in them as principal or agent.
all price information is indicative only. Any of the views and recommendations • They may act or have acted as market-maker in products described in this
which comprise estimates, forecasts or other projections, are subject to significant publication.
uncertainties and contingencies that cannot reasonably be anticipated. On this ANZ and its Affiliates may rely on information barriers and other arrangements to
basis, such views and recommendations may not always be achieved or proven to control the flow of information contained in one or more business areas within
be correct. Indications of past performance in this publication will not necessarily ANZ or within its Affiliates into other business areas of ANZ or of its Affiliates.
be repeated in the future. No representation is being made that any investment
will or is likely to achieve profits or losses similar to those achieved in the past, or Please contact your ANZ point of contact with any questions about this publication
that significant losses will be avoided. including for further information on these disclosures of interest.
Additionally, this publication may contain ‘forward-looking statements’. Actual 2. Country/region specific information:
events or results or actual performance may differ materially from those reflected Australia. This publication is distributed in Australia by ANZ. ANZ holds an
or contemplated in such forward-looking statements. All investments entail a risk Australian Financial Services Licence no. 234527. A copy of ANZ’s Financial
and may result in both profits and losses. Foreign currency rates of exchange may Services Guide is available at http://www.anz.com/documents/AU/aboutANZ/
adversely affect the value, price or income of any products or services described FinancialServicesGuide.pdf and is available upon request from your ANZ point of
in this publication. The products and services described in this publication are contact. If trading strategies or recommendations are included in this publication,
not suitable for all investors, and transacting in these products or services may they are solely for the information of ‘wholesale clients’ (as defined in section 761G
be considered risky. ANZ and its related bodies corporate and affiliates, and the of the Corporations Act 2001 Cth). Persons who receive this publication must
officers, employees, contractors and agents of each of them (including the author) inform themselves about and observe all relevant restrictions.Australia and New Zealand Banking Group Limited (ANZ) ABN 11 005 357 522. Item No. 98077 02.2022 WZ116593
anz.comYou can also read