Spatio-Temporal Assessment of Thunderstorms' Effects on Wildfire in Australia in 2017-2020 Using Data from the ISS LIS and MODIS Space-Based ...
←
→
Page content transcription
If your browser does not render page correctly, please read the page content below
atmosphere

Article
Spatio-Temporal Assessment of Thunderstorms’ Effects on
Wildfire in Australia in 2017–2020 Using Data from the ISS LIS
and MODIS Space-Based Observations
Alexander N. Safronov

                                          Obukhov Institute of Atmospheric Physics, Russian Academy of Sciences, Pyzhevskii Per. 3,
                                          119017 Moscow, Russia; safronov_2003@mail.ru

                                          Abstract: The impact of thunderstorms on the wildfire situation in Australia in 2017–2020 was
                                          investigated using data from the ISS LIS and MODIS space-based observations. To determine
                                          lightning-caused wildfires, a Geographic Information System (GIS) method was carried out, which
                                          consisted of a combined investigation of the spatial and temporal distributions of strikes and ignition
                                          hotspots. The seasonal variability of thunderstorms and wildfire activity was analyzed. It was
                                          established that the maximum seasonal distribution of thunderstorm activity does not coincide with
                                          wildfire activity. The interannual changes in strikes were recorded, but this was not revealed for
                                          the major vegetation types. Of 120,829 flashes, recorded by the ISS LIS sensor, only 23 flashes could
                                          be characterized as lightning-caused wildfire events, i.e., the frequency of lightning ignition was
                                          equal to 0.00023 fires/stroke. The lightning ignitions usually took place along the boundary of a
                                          thunderstorm, in semiarid areas covered by open scrublands. During the dry Australian period
                                          (April–September), very few lightning events were detected by the ISS LIS sensor, while fire activity
                                          was quite high. Additionally, it was concluded that the impact of thunderstorms on the fire situation
                                          is too small to explain the numerous wildfires during the wet period.
Citation: Safronov, A.N.
Spatio-Temporal Assessment of             Keywords: Australia; lightning-caused fire; ISS LIS flash; MODIS active fire; land cover; GIS system
Thunderstorms’ Effects on Wildfire in
Australia in 2017–2020 Using Data
from the ISS LIS and MODIS
Space-Based Observations.                 1. Introduction
Atmosphere 2022, 13, 662. https://
                                               In recent years, there has been an increase in the number of wildfires, including in
doi.org/10.3390/atmos13050662
                                          California, Australia, and Siberia. As is known, wildfires can occur for various reasons. This
Academic Editor: Martino Marisaldi        work explores the relationship between landscape wildfires and lightning cloud–ground
Received: 22 February 2022
                                          (CG) strikes. In this work, wildfire and thunderstorm events in Australia in the period
Accepted: 19 April 2022
                                          2017–2020 are selected as the object of research.
Published: 21 April 2022
                                               Lightning is a common cause of wildland fires; however, a significant increase in the
                                          number of ignitions in wildland in the dry period, in the absence of thunderstorms, raises
Publisher’s Note: MDPI stays neutral
                                          many questions. Some suggest that wildland fire activity has already increased due to
with regard to jurisdictional claims in
                                          climate change. In particularly, Flannigan et al., in [1], indicated that a warmer climate will
published maps and institutional affil-
                                          increase evapotranspiration, since the ability of the atmosphere to retain moisture increases
iations.
                                          rapidly at higher temperatures, thereby reducing the groundwater level and reducing fuel
                                          moisture. In addition, higher temperatures lead to more lightning activity, which usually
                                          leads to an increase in fires [2–5]. The interannual variability of lightning-induced fire
Copyright:    © 2022 by the author.
                                          activity in western US was investigated by Abatzoglou et al. in [6].
Licensee MDPI, Basel, Switzerland.             Stock et al., in [7], noted that lightning fires predominate in the northern Canada,
This article is an open access article    and they account for 80% of the total area burned by large fires. Later, in [8], it was also
distributed under the terms and           reported that in North America, most recent large forest fires were caused by lightning.
conditions of the Creative Commons        According to [9], lightning wildfires represented 16% of all wildfires in the Continental
Attribution (CC BY) license (https://     United States from 1992 to 2013, and accounted for 56% of the total burned area. In [10,11],
creativecommons.org/licenses/by/          it was mentioned that in Canada, igniting lightning is responsible for 45% of all wildfires
4.0/).                                    and accounts for more than 85% of the total area burned. In the work of Abdollahi et al.,

Atmosphere 2022, 13, 662. https://doi.org/10.3390/atmos13050662                                          https://www.mdpi.com/journal/atmosphere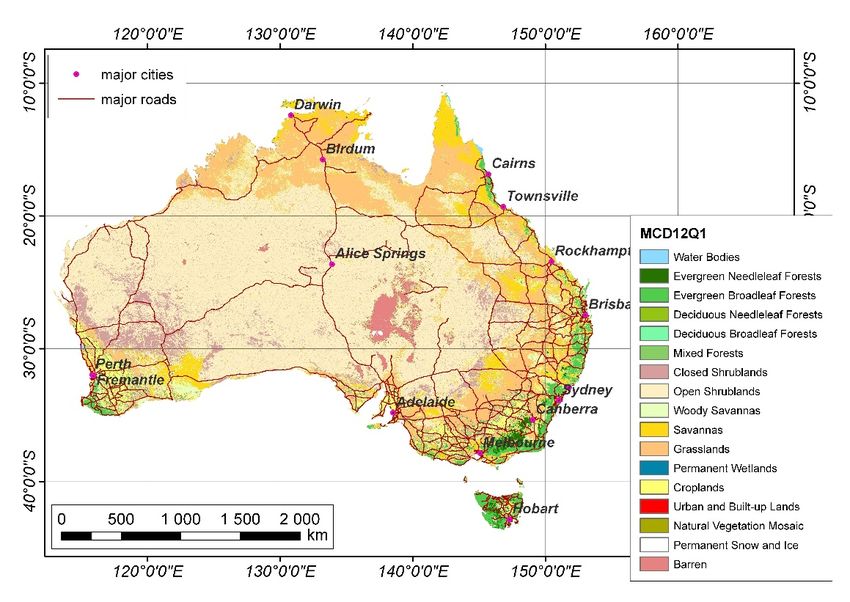
United States from 1992 to 2013, and accounted for 56% of the total burned are
[10,11], it was mentioned that in Canada, igniting lightning is responsible for 45%
Atmosphere 2022, 13, 662 wildfires and accounts for more than 85% of the total area burned.2 ofIn22 the wo
Abdollahi et al., in [11], the applicability of a remote sensing normalized difference
index (NDWI) as an indicator of vegetation/fuel water content to model lightning-ca
inforest
[11], the applicability
wildfires of a remote
in Northern sensing normalized
Alberta, Canada, was difference water index (NDWI) as
investigated.
an indicator of vegetation/fuel water content to model lightning-caused forest wildfires in
The processes of thunderstorm electrification were described in detail in the rev
Northern Alberta, Canada, was investigated.
[12–15]. In our study,
The processes it is expedient
of thunderstorm to allocate
electrification thedescribed
were followingintypes
detail of
in lightning
the re- wild
those[12–15].
views causedInbyourwet thunderstorms;
study, it is expedientsloping or the
to allocate boundary
followingthunderstorms;
types of lightning and dry
derstorms. These types of lightning wildfires are presented in Figure 1a–c. Usually
wildfires: those caused by wet thunderstorms; sloping or boundary thunderstorms; and
dry thunderstorms.
lightning Thesetake
wildfires typesplace
of lightning
duringwildfires
strongarethunderstorms
presented in Figure
in1a–c. Usually,
forests. In this ty
wet lightning wildfires take place during strong thunderstorms in forests.
lightning wildfire, the strikes hit objects which have bulk dry material inside, so th In this type
of lightning wildfire, the strikes hit objects which have bulk dry material inside, so the
jects are usually dead trees, haystacks, and wood buildings. With this type of ligh
objects are usually dead trees, haystacks, and wood buildings. With this type of lightning
wildfire,
wildfire, ignitions
ignitions often often
do notdo not because
spread spreadthe because the area
area covered covered
by the by theis thundersto
thunderstorm wet
wet (Figure
(Figure 1a). 1a).
Figure
Figure 1. The
1. The schemes
schemes of theof thelightning
main main lightning wildfire
wildfire types are astypes are(a)aswet
follows: follows: (a)wildfire
lightning wet lightning
of w
of objects which contain loose, dry materials, such as a dead tree, haystack, or
objects which contain loose, dry materials, such as a dead tree, haystack, or house; (b) edge lightning house; (b)
orlightning or sloping
sloping lightning lightning
wildfire; (c) a drywildfire; (c) a wildfire
thunderstorm dry thunderstorm wildfire
that mainly takes that hot
place over mainly takes plac
deserts.
hot deserts. The investigation scheme is additionally
The investigation scheme is additionally presented in (d). presented in (d).
The next type of lightning wildfire is an edge or sloping lightning wildfire, sometimes
The next type of lightning wildfire is an edge or sloping lightning wildfire, s
called a sheet lightning wildfire. This type usually takes place at the boundary of a
times called afront.
thunderstorm’s sheetBecause
lightning
rain wildfire. This the
does not cover type usually
strike area, takes placematerials
the burning at the boundar
thunderstorm’s front. Because rain does not cover the strike area, the
are dry and the wildfires can extend slowly or quickly, depending on the wind conditionsburning mat
are dry
(Figure 1b).and the wildfires can extend slowly or quickly, depending on the wind c
tions (Figure 1b).
The last type of lightning wildfire is the dry thunderstorm lightning wildfire
kind of lightning wildfire mainly occurs in hot desert areas. Raindrops evaporate as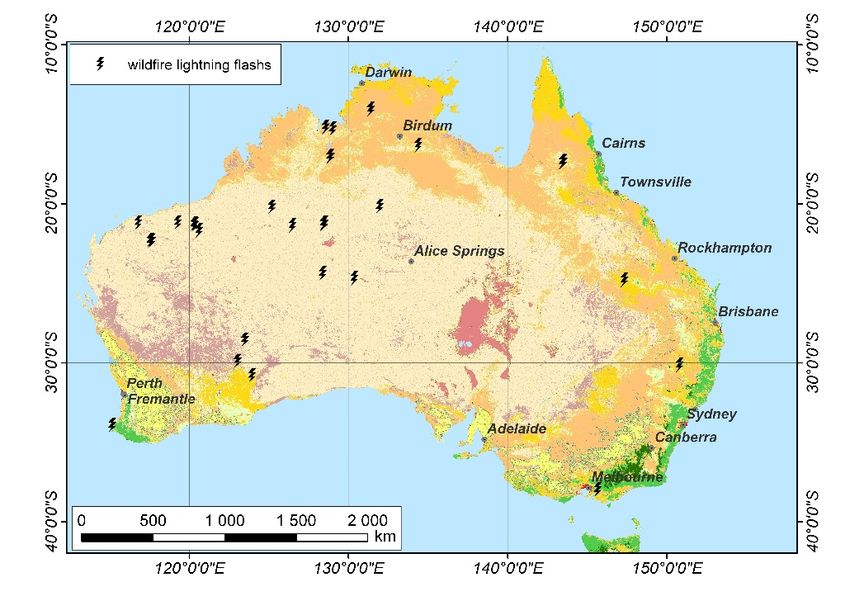
Atmosphere 2022, 13, 662                                                                                             3 of 22

                                  The last type of lightning wildfire is the dry thunderstorm lightning wildfire. This
                           kind of lightning wildfire mainly occurs in hot desert areas. Raindrops evaporate as they
                           fall, so there is a lot of dry vegetation in desert or semi-desert areas under a thundercloud,
                           which can ignite when a thunderstorm hits them. Note that with this type of lightning
                           ignition, the increase in clouds does not occur due to the convection process, but as a result
                           of the adjective process of passing the air mass over a mountain range (Figure 1c).
                                  As discovered in our research, it appears that a lightning fire study was conducted
                           recently [16], so we pay more attention to this. Schumacher et al., in [16], during their
                           investigation of lightning fires, combined cloud–ground (CG) lightning and CG dry light-
                           ning (CGDL), detected by a ground network with fire pixels mapped by satellite remote
                           sensing (AQUA, S-NPP, and NOAA-20) in Central Brazil, between 2015 to 2019. During
                           the study, the lightning ignition candidates were selected based on the distance between
                           fires and lightning in time and space. It was stated that lightning ignition has a higher
                           impact compared to that caused by humans; this is because it occurs mainly in a forest in
                           the remote wildland, making it difficult to manage fire suppression, which leads to a more
                           significant burned area. Moreover, it was noted in [16] that satellite detection of active fires
                           is a useful tool to identify lightning-induced wildfires.
                                  Discussions of wildfires in Australia, the features of Australian thunderstorms, rainfall,
                           and dry and wet lightning can be found in [17–20], and in other sources cited therein. In
                           addition, there are several reviews that describe the relationship between climate and
                           Australian megafires. Harris and Lucas, in [21], investigate the variability of Australian
                           fire weather in the period from 1973 to 2017. It was shown that Australian fire weather
                           shows spatio-temporal variability on interannual and multi-decadal time scales. Using
                           correlation analysis, the authors examined the relationship of these time series with the
                           El Niño Southern Oscillation (ENSO), the Southern Annular Mode (SAM), and the Indian
                           Ocean Dipole (IOD). On a time scale from 1973 to 2017, the linear trends in the Forest Fire
                           Danger Index (FFDI) increased at most observation stations, but this trend was strongest
                           in the southeast and in spring. However, in the different regions of Australia at different
                           times of the year, the influence of ENSO, SAM, and IOD varied greatly. The authors also
                           wrote that the positive FFDI trends were not driven by the trends in the climate drivers,
                           and they were not consistent with the hypothesized impacts of the Interdecadal Pacific
                           Oscillation (IPO).
                                  In [22,23] the authors drew our attention to the fact that in the second half of 2019,
                           the combination of positive IOD and ENSO, together with a negative SAM, led to the
                           failure of critical winter–spring rains and primed Australia for severely arid conditions.
                           The review [24] analyzed the cause of wildfires. In particular, it was written that the
                           cause of wildfires differs from place to place all over the world. Haque et al., in [24],
                           wrote that lightning is the main cause of ignition in Canada and northwest China. In
                           Africa, Central America, Fiji, Mexico, New Zealand, South America, and Southeast Asia,
                           wildfires are caused by human activities such as agricultural activities, dairy production,
                           and land-conversion burning. In the Mediterranean Basin, human negligence is a key
                           cause of wildfires. Lightning strikes and human activities together are the main causes
                           of wildfires in the USA and Australia. Coal seam fires burning in New South Wales
                           and Centralia, Pennsylvania, and different coal-sustained fires in China can also spread
                           contiguous combustible elements.
                                  Abram et al., in [25], indicate that anthropogenic sources in Australia—including
                           accidental ignitions, such as fallen power lines; arson; and other professional activity by
                           farmers, cowboys, loggers, rangers, and the travel and tourism industries—are likely to
                           be located near populated areas. Lightning strikes can naturally cause a fire, especially in
                           remote and impassable areas where fire detection and control are difficult. The Australian
                           Black Summer (December 2019–February 2020) megafires in Australia were caused mainly
                           by natural and accidental ignitions. There are indications of deliberate community misinfor-
                           mation attempting to attribute the Black Summer fires to arson [25]. However, we should
                           note that an increase in temperature, even by 1.5◦ , cannot lead to forest, grassland, or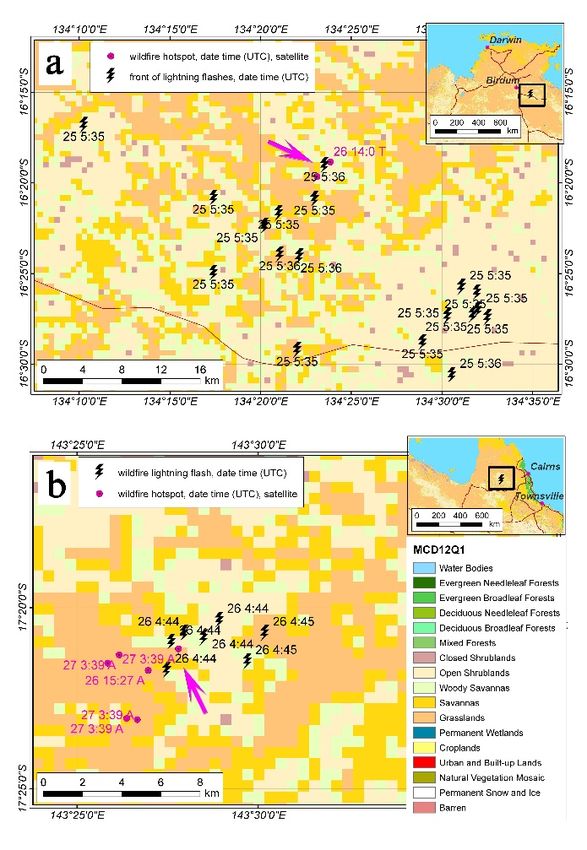
Atmosphere 2022, 13, 662                                                                                          4 of 22

                           scrubland wildfires. Thus, the question about whether the Australian Black Summer wild-
                           fires were caused accidentally by humans, by arson, or due to lightning-caused ignitions
                           remains relevant.
                                 Further, it is interesting to note that according to [22], the enhancement of negative
                           strokes over land during the wildfire season had contributions from both negative IC (by
                           78%) and CG strokes (by 30%), and they were allocated along the north coast of Australia
                           (see Figure 3a,b in [22]). The negative CG strokes, which caused lightning ignitions, had a
                           weakly increasing frequency and mainly occurred in north part of Australia, far from the
                           Victoria district. The major changes in the number of strokes were found over ocean, so this
                           increase in lightning activity was not the cause of the Australian Black Summer megafires.
                                 In this work, a study of the spatial and temporal resolution of lightning strikes and
                           wildfires, recorded using MODIS and LIS sensors, was carried out. The goal of this study
                           is to find an answer to the question: How many flashes, recorded between 2017–2020 by
                           the ISS LIS, led to ignitions in Australia? It has been shown that although ignitions due to
                           lightning strikes occur, they account for a small percentage of all wildfires. This study may
                           be of interest to specialists in remote sensing, fire service personnel, and climatologists.

                           2. Materials and Methods
                           2.1. Lightning Imaging Sensor
                                 The Lightning Imaging Sensor (LIS) is established on the board of the International
                           Space Station (ISS). It is optimized to locate and detect lightning with a storm-scale res-
                           olution of 4 km at nadir (directly below the instrument), increasing to 8 km at limb at
                           the edge of the measurement region of the satellite. The LIS sensor has a swath width of
                           about 550 km of the Earth’s surface, and daily, covers an area with latitudes ranging from
                           −55◦ S to +55◦ N. For more detailed information about the development and accuracy of
                           the ISS LIS product, please see [26] and the references therein. The original ISS LIS data
                           are available in HDF-4 and netCDF-4 formats from the Global Hydrology Resource Center
                           (GHRC) [27]. These datasets consist of near-real-time and non-quality-controlled science
                           and background data, while the final quality-controlled science and background datasets
                           are continually being added after being manually reviewed by the LIS Team. In particular,
                           note that in [28], a comparison between the lightning observations of the ground-based Eu-
                           ropean lightning-location system EUCLID and the ISS LIS data was carried out. Moreover,
                           the ground-based observed strikes and the LIS remote flashes were different parameters
                           that described the same lightning process, so these should not be confused.
                                 It should also be remembered that a similar LIS sensor was established early on the
                           TRIMM (NASA Tropical Rainfall Measuring Mission), and the oldest prototype of the
                           LIS, named the Optical Transient Detector (OTD), was on board the OrbView-1 (OV-1)
                           satellite [29,30]. Therefore there are many publications in which validations of the LIS/OTD
                           sensors have been carried out; please see, for example, the World Wide Lightning Location
                           Network (WWLLN; [31,32]), the U.S. National Lightning Detection Network (NLDN; [33]),
                           the Earth Networks Total Lightning Network (ENTLN; [34]), the Arrival Time Differ-
                           ence Network (UK Met Office) (ATDnet; [35]), and the Vaisala Global Lightning Dataset
                           (GLD360; [36,37]), BrasilDAT [16], and EUCLID [28,38].
                                 In this study, data from the period 2017–2020, were used and obtained using the
                           LIS Space–Time Domain Search (LIS STDS) [39]. The final quality datasets were used
                           where possible, until 2020; however, additional filtrations were carried out for several
                           months in 2020. Thus, ISS LIS flashes with a “Duration” equal to zero milliseconds and
                           “Events” equal to 1 were not taken into account. Additionally, on the second filtration,
                           flashes with “Groups” and “Events” equal to 2, for satellite orbits with “Orbit ID” numbers
                           equal to 21,552 or 21,553, were excluded. Note that pyrocumulus lightning (pyroCb) as
                           reasons for the ignitions were discussed in [40]. These pyroCb strikes are characterized by
                           high-intensity positive lightning density, sometimes more than 100 kA, while most cloud–
                           ground (CG) strikes, investigated in this study, have negative polarity. Due to the positive
                           ground–cloud polarity of pyroCb strikes, the statement that these strikes are a reason for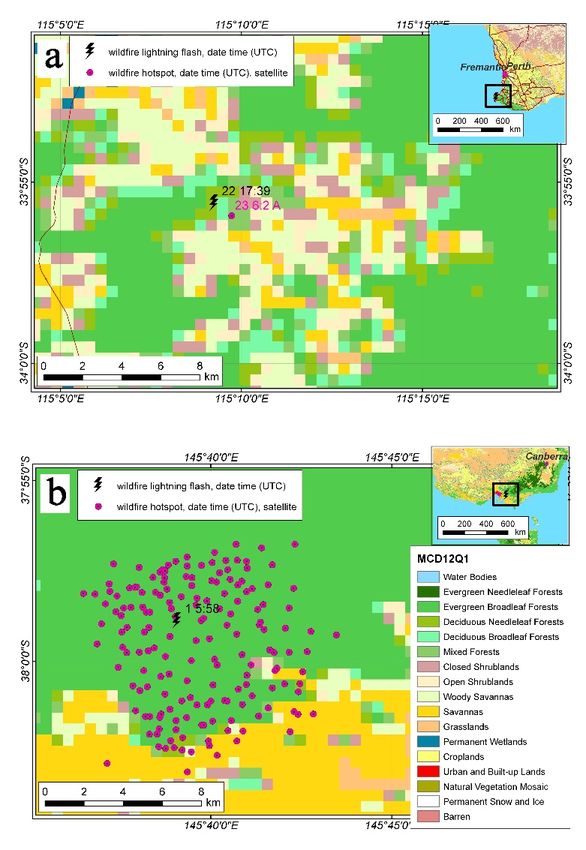
high-intensity positive lightning density, sometimes more than 100 kA, while most
cloud–ground (CG) strikes, investigated in this study, have negative polarity. Due to the
Atmosphere 2022, 13, 662 positive ground–cloud polarity of pyroCb strikes, the statement that these strikes5 ofare 22 a
reason for wildfire ignitions is disputable. The ratio of intracloud lightning (IC) to
cloud–ground lightning (CG) in thunderstorms was discussed by Price and Rind in [3].
wildfire ignitions is disputable. The ratio of intracloud lightning (IC) to cloud–ground
2.2. MODIS
lightning Land
(CG) in Cover
thunderstorms was discussed by Price and Rind in [3].
The definitions of the types of lightning wildfire, presented in Figure 1, require
2.2. MODIS Land Cover
knowledge of Australian land cover. In this study, the International Geo-
The definitions
sphere-Biosphere of the types(IGBP)
Programme of lightning
land wildfire, presented in schemes,
mask classification Figure 1, require
which knowl-
have 17
vegetation classes, were used. The original MCD12Q1 files from the C6 collection inPro-
edge of Australian land cover. In this study, the International Geosphere-Biosphere HDF
gramme
format (IGBP)
are land from
available mask the
classification schemes,
Earth Explorer which
server haveExplorer)
(Earth 17 vegetation
[41].classes,
For morewere
de-
used. The original MCD12Q1 files from the C6 collection in HDF format are available
tailed information about the development and accuracy of the MCD12Q1 products,
from the Earth Explorer server (Earth Explorer) [41]. For more detailed information about
please see [42] and the references therein.
the development and accuracy of the MCD12Q1 products, please see [42] and the refer-
Further, the land cover HDF files were converted to GeoTIFF format by using a
ences therein.
special HEG conversion tool, which helps to convert HDF-EOS files to GeoTIFF format
Further, the land cover HDF files were converted to GeoTIFF format by using a special
and
HEG is conversion
usually used in awhich
tool, Geographic
helps toInformation System files
convert HDF-EOS (GIS).to The HEG format
GeoTIFF is a tooland
devel-
is
oped to allow a user to reformat, re-project, and perform stitching/mosaicing
usually used in a Geographic Information System (GIS). The HEG is a tool developed and sub-
setting
to allow operations
a user to on HDF-EOS
reformat, objects.and
re-project, As perform
a basis for a full GIS System, the
stitching/mosaicing andESRI ArcInfo
subsetting
system was used, the description of which can be found on the ESRI site
operations on HDF-EOS objects. As a basis for a full GIS System, the ESRI ArcInfo system [43].
was A MODIS
used, land coverof
the description map of the
which canstate of land
be found on cover in 2018,
the ESRI with a spatial resolution
site [43].
of 500Am, is drawn
MODIS land incover
Figure 2. For
map convenience,
of the state of landthe major
cover in roads and cities
2018, with areresolution
a spatial also drawn
in
ofthis
500 Figure.
m, is drawn in Figure 2. For convenience, the major roads and cities are also drawn
in this Figure.
2. AA MODIS
Figure 2.
Figure MODIS landland cover map (MCD12Q1,
(MCD12Q1, 2018),
2018), with
withaaspatial
spatialresolution
resolutionofof500
500m,m,
waswas
presented for
presented for 17
17 classes of IGBP
IGBP land
land cover
coverclassification.
classification.In
Inaddition,
addition,the
themajor
majorroads
roadsandandcities
cities
were
weredrawn.
drawn.
The contributions of different IGBP classes to Australia’s land cover (MCD12Q1,
The contributions of different IGBP classes to Australia’s land cover (MCD12Q1,
2018) [44] are presented in Figure 3. According to the MODIS land cover map of Australia,
2018) [44] are presented in Figure 3. According to the MODIS land cover map of Aus-
the open and closed scrublands, grasslands, and woody and grass savannas were evaluated
tralia, the open and closed scrublands, grasslands, and woody and grass savannas were
(please see Table S1 in Supplementary Materials).
evaluated (please see Table S1 in Supplementary Materials).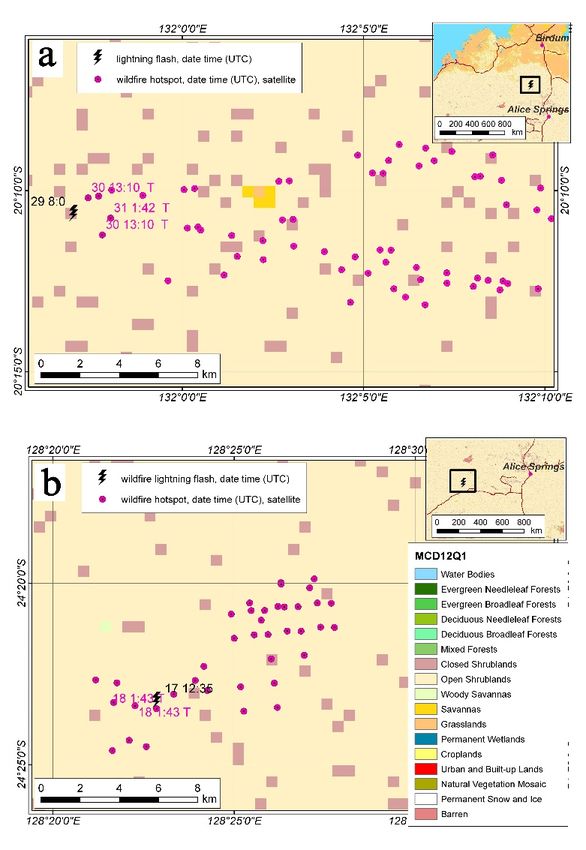
Atmosphere2022,
Atmosphere 13,x662
2022,13, FOR PEER REVIEW 66ofof23
22
Figure
Figure3.3.The
Thecontributions of of
contributions different IGBP
different classes
IGBP to Australia’s
classes landland
to Australia’s cover (MCD12Q1,
cover 2018)2018)
(MCD12Q1, are
presented.
are presented.
2.3.The
2.3. TheLightning
LightningLand-Cover
Land-CoverRetrieval
RetrievalMethod
Method
Inthis
In thisstudy,
study, the
the monthly
monthly land-cover
land-coverdistributions
distributionsofoflightning
lightninghotspots
hotspotsdetermined
determined by
thethe
by LISLIS
ISSISS
sensor were
sensor characterized
were characterizedby three parameters.
by three parameters.Firstly, they they
Firstly, were were
characterized
charac-
by the absolute
terized number number
by the absolute of lightning flashes, recorded
of lightning using the using
flashes, recorded definedtheIGBP class IGBP
defined types.
class types. Secondly, because the number of lightning flashes varied from monthisto
Secondly, because the number of lightning flashes varied from month to month, it of
interest to study the relative contribution, which was defined by the following
month, it is of interest to study the relative contribution, which was defined by the fol- Equation:
lowing Equation:
Ni (m j )
ni ( m j ) = (1)
17N ( m )
i j
ni ( m j ) = 17 i j
∑ N ( m )
(1)
N (m
i=1
i j )
where m j is a month (j = 1, . . . , 12), i is a number i =1 representing the IGBP vegetation classes
(i = 1, . . . , 17), and Ni is the number of lightning flashes, recorded in the i vegetation class.
where
The valuem j is of a
ni month (j = 1, …,
is the monthly 12), i is aof number
distribution lightningrepresenting the IGBPus.
in %, which interests vegetation
Note that
the gradation
classes (i = 1, …, into17), and N i is
subgroups corresponding
the number of tolightning
additionalflashes,
LIS attributes,
recordedsuch i vege-
as “Events”
in the
and “Groups”, was not performed.
tation class. The value of ni is the monthly distribution of lightning in %, which interests
Thirdly, the monthly land-cover distribution was characterized by the ratio for light-
us.
ningNote that theThis
attraction. gradation into
ratio was thesubgroups corresponding
relative monthly to additional
distribution, LIStoattributes,
normalized the value
such
of theasdefined
“Events” and “Groups”,
vegetation wasthe
class for nottotal
performed.
land cover distribution, which is defined by
Thirdly,
Equation (2): the monthly land-cover distribution was characterized by the ratio for
lightning attraction. This ratio was the relative monthly ni (m j ) distribution, normalized to the
value of the defined vegetationratio i ( mfor
class j) =the total land17 cover distribution, which is de-(2)
fined by Equation (2): ∑ LCi / ∑ LCi
i i=1
ni (m j ) one of the classes (i = 1, . . . , 17),
where m j is a month (j = 1, . . . , 12), i is a number representing
ratio (m j ) =vegetation
and LCi is the number of pixels ofi i (the class).
17 The ratio unit is percent(2) to
percent (%\%). Note that for uniform land coverLC i
i /
loading,
i =1
LC
thei ratio for lightning attraction
is equal to 1.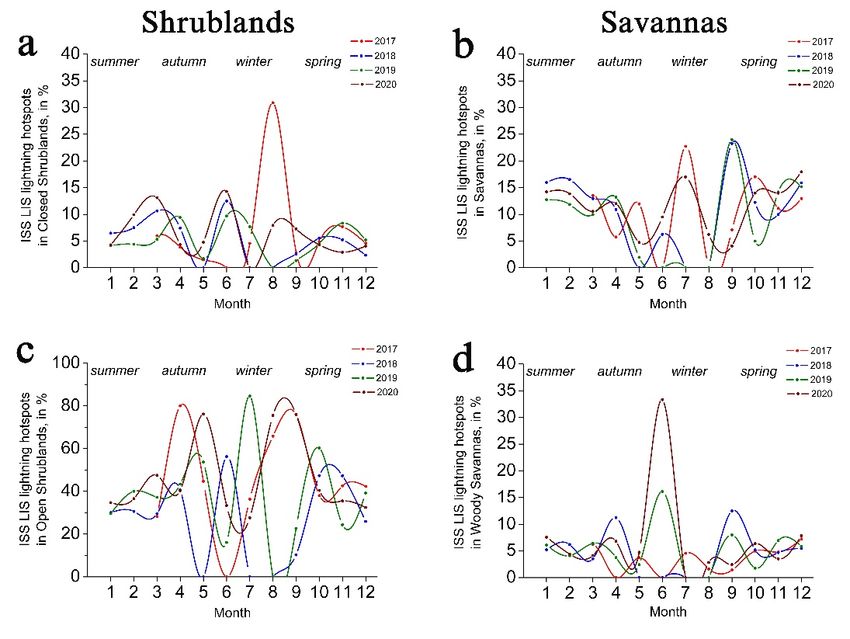
Atmosphere 2022, 13, 662                                                                                                            7 of 22

                                    2.4. MODIS Active Fires
                                         The global monthly fire location product, referred to below as MCD14ML, was used
                                    in this study. This active fire (AF) product contained information for all Terra and Aqua
                                    MODIS fire pixels in a single monthly ASCII file. The MCD14ML files from the C6 collection
                                    are available from the University of Maryland fuoco SFTP server [45]. The description of
                                    active fire products is available in [46].
                                         The Active Fire MODIS product included the latitude and longitude of wildfire pixels;
                                    the brightness temperatures recorded in 21/22 and 31 channels (T21 and T31), which
                                    were measured in degrees K; the Fire Radiative Power (FRP), measured in MW; and the
                                    detection of confidence, which is presented as a percentage. The datasets used in this study
                                    are presented in Table 1.

                                    Table 1. The datasets used in this study are presented. References are given above in the text of
                                    Section 2.

                                                               Spatial       Spatial      Time      Temporal
    Dataset           Satellite          Description                                                                    Variables
                                                              Resolution     Cover       Window     Coverage
                                                                                                                   Time and location of
                                            Optical                          54.3◦ N                 March
      LIS                  ISS                                4 kmin nadir                Daily                         groups and
                                        lightning data                       –54.3◦ S             2017–present
                                                                                                                     lightning flashes
                                                                                                       Terra
                                                                                                  (1999–present)   Time and location of
  MCD14ML          Terra and Aqua      Wildfire hotspots         500 m        World       Daily
                                                                                                      Aqua             active fires
                                                                                                  (2002–present)
                                       Classification of
   MCD12Q1         Terra and Aqua                                1 km         World      Yearly       2018            IGBP classes
                                       vegetation type
                                                                                                                   surface wind speed,
     GDAS                  –          Meteorological data       1◦ × 1◦       World        3h     1978–present        cloud fraction
                                                                                                                       (mcld, hcld)
                                       Classification of
   ABARES                  –                                     100 m       Australia    2018        2018           Eucalypt forests
                                     Australian forest type

                                         As is well known, the forest fires are characterized by high FRP and confidence values;
                                    however, in Australia, the scrubland, meadow, and savanna vegetation types prevail. The
                                    ignitions of these vegetation types are characterized by low FRP and confidence, so in our
                                    work, there was no reason to exclude low values of confidence and FRP.

                                    2.5. Lightning Wildfire Retrieval Method
                                          In this study, the lightning wildfires were recorded using several satellites. The
                                    usual scheme used to carry out investigations is shown in Figure 1d. The two MODIS
                                    sensors, established on Terra and Aqua satellites, and the LIS sensor, allocated on board
                                    the ISS spacecraft, have different temporal and spatial coverage. Thus, the next temporal–
                                    spatial criterion was chosen to register the fact that ignition is triggered by cloud–ground
                                    lightning strikes.
                                          Firstly, the wildfires had to be located in a 2 km buffer from the place of registration
                                    of the lightning strikes. Secondly, the fires recorded by the Aqua and Terra sensors had to
                                    be recorded on the day that the lightning discharges were recorded, but not earlier than
                                    the ISS time of flight, or the next day. Thirdly, before the thunderstorm, there should have
                                    been no wildfires in the specified region (~10–50 km). Mixed cases, wherein ignitions in
                                    the region were observed both before and after the thunderstorm, were not included in the
                                    final treatments. Additionally, in this study, the type of vegetation was analyzed near the
                                    centers of the thunderstorm strikes.
Atmosphere 2022, 13, 662                                                                                                          8 of 22

                                   3. Results
                                   3.1. Seasonal Variations in Lightning Flashes
                                        In this Section, the seasonal variations in lightning strikes, recorded in the period of
                                   2017–2020 by LIS sensors in Australia, are investigated. The results of this investigation are
                                   presented in Table 2. As can be seen from Table 2, in Australia, the temporal distribution
                                   of thunderstorms is clearly divided into dry and wet periods. The period from April
                                   to September (4–9) corresponds to the dry period, which corresponds to the Australian
                                   autumn and winter. During the dry period, the thunderstorm activity is minimal. The
                                   thunderstorm and lightning activity increases rapidly in Australia in spring (October and
                                   November) and in summer (February and March). Further, the interannual variation in
                                   thunderstorm activity in the period of 2017–2020 is insignificant, and the maximum activity
                                   was recorded in January 2018. In this month, the number of strikes was equal to 9604 pcs.

                                   Table 2. Seasonal variations in the number of the Australian LIS strikes. Values more than 8000 are
                                   highlighted in gray.

                                             Seasons                                         Years
                 Month
                                           in Australia          2017               2018               2019               2020
          1                  January        Summer                 –                9604               3702               7191
          2                 February                               –                6222               5078               6156
          3                   March         Autumn               5593               3342               6013               1250
          4                   April                               261                551                 53                808
          5                    May                                134                  5                408                21
          6                    June          Winter                0                  32                 31                21
          7                    July                               22                 11                 13                 47
          8                  August                               123                 25                  1                176
          9                September         Spring               141                232                 75               1099
         10                 October                              2067               4680               2023               7118
         11                November                              9096               8036               2587               6156
         12                December         Summer               3690               4440               8164               4331
                             Annual                             21,127             37,180             28,148             34,374

                                        Within the frame of our study, it is of interest to compare storm activity with wildfire
                                   activity. The seasonal distributions of lightning flashes and wildfire hotspots are presented
                                   in Figure 4; please see green, blue, and red lines, respectively. A significant number of
                                   wildfires were observed during the dry period, while thunderstorm activity during the dry
                                   Australian period was minimal.
                                        Further, an abnormal number of wildfires were registered in summer 2019 and spring
                                   2020 (see black arrows in Figure 4b,d). Detailed information about the seasonal distributions
                                   of Australian wildfires can be found in Tables S2 and S3, in Supplementary Materials. In
                                   particular, it is noted that there is a difference between the number of Aqua and Terra
                                   wildfires, which is highlighted in Table S4. Since this difference is observed in autumn, at
                                   the end of the agricultural cycle in Australia, i.e., in April and May, this phenomenon can
                                   be explained by the daily burning of agricultural waste.
                                        Summing up this section, we note that the maximum temporal distribution of thun-
                                   derstorm activity does not coincide with the maximum wildfire activity. The number of
                                   thunderstorms in the dry period (April–September) is minimal, while wildfire activity is
                                   quite high.

                                   3.2. The Lightning Flashes and Different Vegetation Classes
                                        Next, we investigated the seasonal distribution of lightning over different underly-
                                   ing vegetative types. As is shown above, the main types of vegetation in Australia are
                                   shrublands, grasslands, and savannas, which cover 57.4%, 18.4%, and 14.1% of the total
                                   Australian area (Table S1). In this study, the monthly distributions of absolute and relative
                                   numbers of LIS strikes, and of the four specified major vegetation types, were investigated.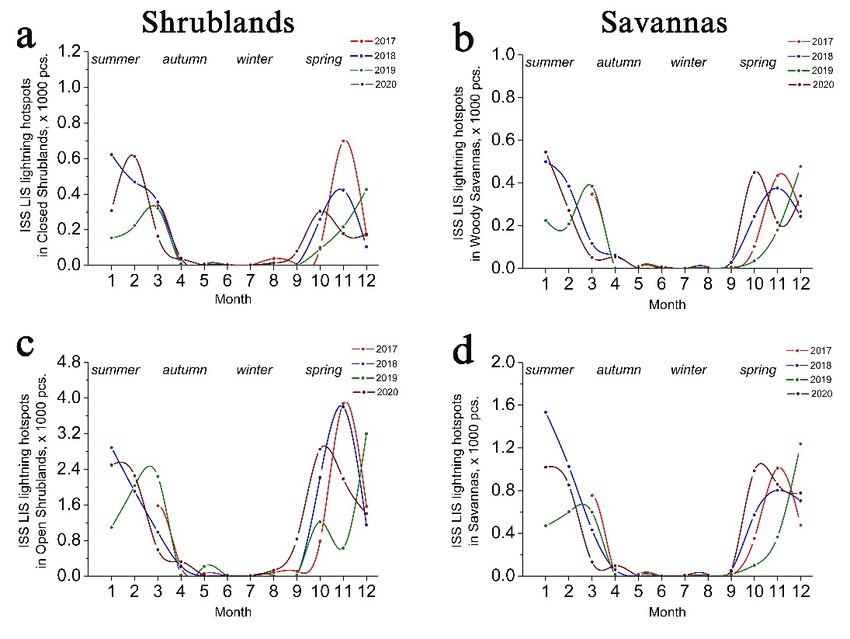
Atmosphere 2022, 13, 662 9 of 22
Atmosphere 2022, 13, x FOR PEER REVIEW 9 of 23
For reference, we remind the reader that the definitions of the relative amount and the ratio
of lightning attraction are specified above, in Equations (1) and (2).
Figure4.4. The
Figure The comparison
comparison between monthly distributions
between monthly distributionsofofMODIS
MODISTerraTerra(blue)
(blue)and
andAqua
Aqua(red)
(red)
wildfire hotspots, and the ISS
wildfire hotspots, and the ISS LIS lightning flashes (green lines), for the 2017 (a), 2018 (b), 2019 (c);
flashes (green lines), for the 2017 (a), 2018 (b), 2019 (c);
and
and2020
2020(d).
(d).Abnormal
Abnormal numbers
numbers of wildfires in the spring and
and summer
summer are are marked
markedby byarrows.
arrows.
TheLightning
3.2. The strike numbers on Different
Flashes and grasslands, shrublands,
Vegetation Classes and savannas are calculated and
presented in Figures 5a and 6a–d. Additionally, the relative lightning values are presented
Next, 5b
in Figures weand
investigated
7a–d, as the seasonal distribution
a percentage of the totalofmonthly
lightning over different
lightning values.underly-
Due to
ing vegetative types. As is shown above, the main types of vegetation
anomalous low numbers of thunderstorms, the relative flake distributions in the dry season in Australia are
shrublands,
for grassland,grasslands, andscrublands
savannas, and savannas, which cover 57.4%,are
(April–September) 18.4%, and 14.1% of the
not mathematically total
reliable.
Australian area (Table S1). In this study, the monthly distributions of absolute
Therefore, the central parts of Figures 5b and 7a–d, which contain several peaks, are not the and rela-
tive numbers
objects of LIS strikes, and of the four specified major vegetation types, were inves-
of this study.
tigated. For reference, we remind
The seasonal distributions of the readerflashes
lightning that theover
definitions of the relative
the grasslands, amount
croplands, and
and the ratio of lightning attraction are specified above, in Equations
savanna repeat the general distribution, presented in Figure 4. In the wet Australian 1 and 2.
season,Thein strike
springnumbers on grasslands,
and summer—i.e., shrublands, (1-2–3)—and
in January–March and savannasinare calculated and
October–December
presented in Figures 5a and 6a–d. Additionally, the relative lightning
(10-11-12), the relative number of strikes over grasslands and open shrublands are values are about
pre-
sented in
30–40% ofFigures 5bnumber
the total and 7a–d, ofas a percentage offor
thunderstorms thethe
total monthly
same period lightning
(Figuresvalues.
5b and Due
7c).
to anomalous low numbers of thunderstorms, the relative flake distributions
However, unlike the grassland relative value, the relative number over grassland savannas in the dry
season
in the wet forseason
grassland,
vary savannas,
in the range andof scrublands
10–20% (Figure(April–September)
7b). Further, the are not mathemati-
relative number of
strikes over the closed shrublands and woody savannas change in a smallercontain
cally reliable. Therefore, the central parts of Figures 5b and 7a–d, which range ofseveral
5–10%
peaks, are
(Figure 7a,d). not the objects of this study.
The interannual changes in lightning numbers in the wet season of 2017–2020 were
investigated; however, no significant differences in the lightning numbers over the major
types of Australian vegetation were found.
It is interesting to note that in the Australian wet season, the attraction ratio (Equation (2))
for grasslands and grassland savannas is equal to ~1.5–2 (Figures 5c and 8b). On the other
hand, due to the ratio of lightning attraction for open and closed shrublands being less
than 1 (Figure 8a,c), the scrublands do not attract strikes. Moreover, the ratio of lightning
attraction for woody savannas is equal to ~1, i.e., the woody savannas have a neutral
attraction for thunderstorm lightning.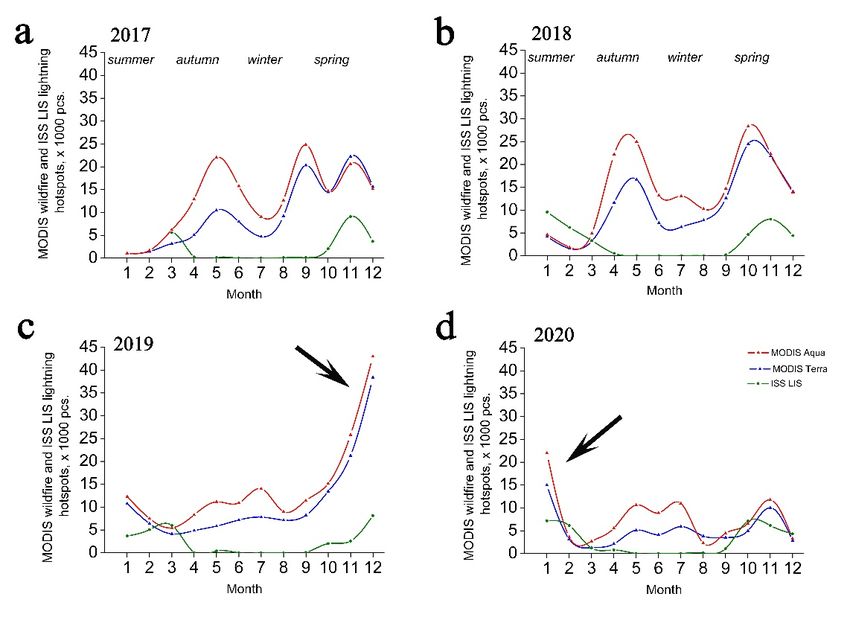
Atmosphere 2022, 13, x FOR PEER REVIEW 10 of 23
Atmosphere 2022, 13, 662 10 of 22
Figure5.5.The
Figure The monthly distributionsofoflightning
monthly distributions lightninghotspots
hotspots (LIS
(LIS ISS)
ISS) recorded
recorded in grasslands,
in grasslands, in pieces
in pieces
(pcs.),ininpercentages
(pcs.), percentages (%) of
of total
total monthly
monthlylightning
lightninghotspots, and
hotspots, thethe
and ratio of lightning
ratio attraction
of lightning attraction
aredrawn
are drawnin in(a–c),
(a–c), respectively.
respectively. The
Themonths
monthsofof1–31–3and 10–12
and 10–12areare
involved in the
involved Australian
in the wet wet
Australian
(thunderous) season, and 4–9 correspond to the dry season.
(thunderous) season, and 4–9 correspond to the dry season.
Theremaining
The seasonal distributions of IGBP
categories of lightning flashes over
vegetation typesthe grasslands,
occupy croplands,
less than andAus-
3% of the
savanna repeat the general distribution, presented in Figure 4. In the wet Australian
tralian territory (see Table S1). Therefore, the number of lightning flashes that took place
season,
over in spring
evergreen and summer—i.e.,
and deciduous in January–March
broadleaf forests, (1-2–3)—and
croplands, urban, in Octo-
and built-up lands are
insignificant and do not exceed a few percent. Due to limited space, the seasonalopen
ber–December (10-11-12), the relative number of strikes over grasslands and distribu-
shrublands
tions are about
of lightning over30–40% of the
evergreen andtotal number of
deciduous thunderstorms
broadleaf forests,for the same and
croplands, period
urban
(Figures
and 5b and
built-up lands 7c).
areHowever,
moved tounlike the grassland
Supplementary relativeand
Materials value, the relative
presented number
in Figures S1–S4.
over grassland savannas in the wet season vary in the range of 10–20% (Figure 7b). Fur-
Note that the ratio of lightning attraction for urban and built-up lands can significantly
ther, the relative number of strikes over the closed shrublands and woody savannas
exceed 1 (see Figure S4c). Such attractiveness of buildings for CG strikes is an expected
change in a smaller range of 5–10% (Figure 7a,d).
phenomenon. A similar phenomenon is observed for the Australian evergreen broadleaf
forest (Figure S2c).
The lightning anomalies were found in two study cases, one over croplands and
another over the urban and built-up lands. The anomaly in the urban category was
associated with a strong thunderstorm in Sydney, which was located on the east coast
of Australia. This case study is presented in Figure S5a,b. The anomaly on cropland
in November 2017 was associated with a thunderstorm north-east of Melbourne (see
Figure S6b). Note that both of these cases are interesting, but are not related to the wildfire
anomalies observed in Australia in late 2019 and early 2020, that is, they are beyond the
scope of this publication.Atmosphere
Atmosphere
Atmosphere 2022,
2022,
2022, 13,
13,
13, xxFOR
662 FORPEER
PEERREVIEW
REVIEW 11
11of
11 23
ofof23
22
Figure 6.6.The
Figure6.
Figure Themonthly
The monthly
monthly distributions
distributions
distributionsofof
LISS
of ISSISS
LISS
LISS flashes,
ISS recorded
flashes,
flashes, recordedin the
recorded in open
in the (c) and
the open
open (c)closed
(c) and (a) shrub-
and closed
closed (a)
(a)
shrublands,
lands, and and
in thein the
woody woody
(d) (d)
and and grasslands
grasslands savannassavannas
(b) (b)
in in absolute
absolute values
values
shrublands, and in the woody (d) and grasslands savannas (b) in absolute values (pcs.) in the pe- (pcs.)
(pcs.) in in
thethe pe-
period
riod
riod2017–2020.
2017–2020.
2017–2020. MODISMODIS
landland
MODIS landcover
cover cover (MCD12Q1)
(MCD12Q1)
(MCD12Q1) isisused
is used used for
forestimations.
estimations.
for estimations.
Figure 7. The monthly distributions of LISS ISS flashes, recorded in the open (c) and closed (a) shrub-
Figure
Figure 7.7. The
The monthly
monthly distributions
distributions ofof LISS
LISS ISS
ISS flashes,
flashes, recorded
recorded in
in the
the open
open (c)
(c) and
and closed
closed (a)
(a)
lands, and in the in
shrublands, woodywoody
(d) and grasslands savannas (b) as (b) % of total monthly lightning flashes
shrublands, andand in the
the woody (d)(d) and
and grasslands
grasslands savannas
savannas (b) as
as %% ofof total
total monthly
monthly lightning
lightning
recorded
flashes in Australia
flashesrecorded
recorded in in 2017–2020.
inAustralia
Australia in
in2017–2020.
2017–2020.types of Australian vegetation were found.
It is interesting to note that in the Australian wet season, the attraction ratio (Equa-
tion 2) for grasslands and grassland savannas is equal to ~1.5–2 (Figures 5c and 8b). On
the other hand, due to the ratio of lightning attraction for open and closed shrublands
being less than 1 (Figure 8a,c), the scrublands do not attract strikes. Moreover, the ratio of
Atmosphere 2022, 13, 662 12 of 22
lightning attraction for woody savannas is equal to ~1, i.e., the woody savannas have a
neutral attraction for thunderstorm lightning.
Figure8.8.The
Figure Themonthly
monthlydistributions
distributionsof of
ratios of lightning
ratios attraction
of lightning of open
attraction (c) and
of open (c) closed (a) shrub-
and closed (a)
lands, and ofand
shrublands, grasslands (b) and(b)woody
of grasslands savannas
and woody (d), are
savannas presented.
(d), are presented.
3.3. Spatial Distribution of Lightning Wildfires
The remaining categories of IGBP vegetation types occupy less than 3% of the Aus-
tralian this
In Section,
territory (seewe present
Table S1). the results of
Therefore, thea number
geo-information
of lightningstudy of thethat
flashes relative
took spatial
place
distributions
over evergreen and deciduous broadleaf forests, croplands, urban, and built-upalands
of wildfires and lightning strikes. This study was carried out using full-scale
are
Geographic
insignificantInformation
and do not System exceed a(GIS) ESRI ArcInfo.
few percent. Due toNotelimitedthatspace,
the sampling
the seasonal method for
distri-
lightning
butions ofwildfire
lightning retrieval is described
over evergreen andabove in Section
deciduous 2.5. forests, croplands, and ur-
broadleaf
ban The
and results
built-upoflands this investigation are summarizedMaterials
are moved to Supplementary in Table and 3. Only 23 cases
presented of light-
in Figures
ning wildfires were recorded in the period 2017–2020, with 120,829 total lightning flashes
S1–S4.
recorded
Noteinthat thethesameratioperiod. As can
of lightning be seen for
attraction from Table
urban and 3, built-up
the numbers landsofcan registered
signifi-
lightning
cantly exceed 1 (see Figure S4c). Such attractiveness of buildings for CG strikes is in
ignitions are extremely small, and are equal to 6 in 2017, 3 in 2018, 11 an2019,
ex-
and 3 in 2020. As percentages of the total number of lightning
pected phenomenon. A similar phenomenon is observed for the Australian evergreen flashes, these numbers are
changed to a range from
broadleaf forest (Figure S2c). 0.008% to 0.039% (see Table 3). Additionally, we remind the reader
that during the studyanomalies
The lightning period of were
2017–2020,
found445,139
in two andstudy599,016
cases,wildfires
one over(Tables S2 and
croplands S3)
and
were defined,
another over the whichurbanis several orders lands.
and built-up of magnitude
The anomalymore than
in thethe value
urban announced
category above
was asso-
in the 23with
ciated events of lightning
a strong wildfires.in Sydney, which was located on the east coast of
thunderstorm
Australia.
Table 3. The This
number caseof study
ISS LISis presented
flashes, which,inaccording
Figure S5a,b. The anomaly
to MCD14ML onare
wildfires, cropland
probablyin No-
sources
ofvember 2017
wildfires. Thewas associated
values in bracketswith a thunderstorm
are related to events whichnorth-east of Melbourne
did not complete (see Figure
the requirements for
S6b). Note that both of these cases are interesting, but are not related
selection, specified in Section 2.5. For example, single wildfire hotspots were present in the 3 h prior
to the wildfire
anomalies observed in Australia in late 2019 and early 2020, that is, they are beyond the
to the ISS spacecraft flight.
scope of this publication.
Seasons Years
Month
in Australia 2017 2018 2019 2020
1 January Summer – 0 2 (1) (1)
2 February – 0 3 1
3 March Autumn 0 0 2 (1) 0
4 April 0 0 0 0
5 May 0 0 0 0
6 June Winter 0 0 0 0Atmosphere 2022, 13, 662 13 of 22
Table 3. Cont.
Seasons Years
Month
in Australia 2017 2018 2019 2020
7 July 0 0 0 0
8 August 0 0 0 0
9 September Spring 0 0 0 0
10 October 2 0 2 (1) 1
11 November 3 3 (3) 0 1
12 December Summer 1 (1) 0 2 (1) 0
Total lightning wildfires, pcs. 6 (1) 3 (3) 11 (4) 3 (1)
Total events, in % 0.028 0.008 0.039 0.009
Annual ISS LIS flashes 21,127 37,180 28,148 34,374
The 2017–2020 merged spatial distribution of the lightning wildfires is drawn in
Figure
Atmosphere 2022, 13, x FOR PEER REVIEW
9. The MODIS land cover map (MCD12Q1, 2018) is used as a background image. 14 of 23
The monthly distributions of lightning wildfires that occurred over the specified IGBP land
cover vegetation classes are presented in Table 4.
Figure9.9.The
Figure The spatial
spatial distribution
distribution of the
of the ISSISS
LISLIS lightning
lightning flashes,
flashes, which
which cantriggers
can be be triggers for light-
for lightning-
ning-caused ignitions, is presented (see Table 3). The MODIS land cover map (MCD12Q1,
caused ignitions, is presented (see Table 3). The MODIS land cover map (MCD12Q1, 2018) is used 2018)
asis
used as a background image.
a background image.
Table 4. Numbers
The summary of of
lightning
Sectionwildfires
3.3 is in
asAustralia
follows:inNo2017–2020, occurring
lightning in thewere
wildfires IGBPdetected
land cover
vegetation
during classes.
the dry The values
Australian in brackets
period are related toAs
(April–September). events whichindid
is shown not complete
Figure the 4,
9 and Table re-
quirements for selection, specified in Section 2.5.
most of the lightning wildfires in the wet Australian season are concentrated in the arid
northwestern part of the continent, covered with steppe and
Numbers shrub vegetation.
of Lightning Thepcs.
Wildfires, impact
ID recorded lightning
of the IGBP Classes
wildfires is too small to explain the large number of wildfires
2017 2018 2019 2020 2017–2020
in Australia during the wet period of 2017–2020. In Section 4, we will provide a detailed
0 Water Bodies
analysis of some typical cases of lightning ignitions.
1 Evergreen Needleleaf Forests
2 Evergreen Broadleaf Forests 1 1
3 Deciduous Needleleaf Forests (1) (1)
4 Deciduous Broadleaf Forests
5 Mixed Forests 1 1
6 Closed Shrublands 1 1
7 Open Shrublands 5(1) 2 5(3) 1 13(4)Atmosphere 2022, 13, 662 14 of 22
Table 4. Numbers of lightning wildfires in Australia in 2017–2020, occurring in the IGBP land
cover vegetation classes. The values in brackets are related to events which did not complete the
requirements for selection, specified in Section 2.5.
Numbers of Lightning Wildfires, pcs.
ID IGBP Classes
2017 2018 2019 2020 2017–2020
0 Water Bodies
1 Evergreen Needleleaf Forests
2 Evergreen Broadleaf Forests 1 1
3 Deciduous Needleleaf Forests (1) (1)
4 Deciduous Broadleaf Forests
5 Mixed Forests 1 1
6 Closed Shrublands 1 1
7 Open Shrublands 5 (1) 2 5 (3) 1 13 (4)
8 Woody Savannas 1 1
9 Savannas (1) 2 (1) 2 (2)
10 Grasslands 1 (2) 2 1 4 (2)
11 Permanent Wetlands
12 Croplands
13 Urban and Built-up Lands
14 Natural Vegetation Mosaic
15 Permanent Snow and Ice
16 Barren
17 Unclassified
Total lightning wildfires, pcs. 6 (1) 3 (3) 11 (4) 3 (1) 23 (9)
Annual ISS LIS flashes 21,127 37,180 28,148 34,374 120,829
4. The Spatial Distributions of Lightning Wildfires
4.1. Lightning Wildfires in the Open Shrublands
Two events of lightning wildfires in the area covered by open shrublands, with em-
bedded closed shrubland pixels, are presented in Figure 10. The lightning wildfires in
Figure 10a correspond to the event that took place on 29 October 2017, nearby Birdum,
in the north of Australia. Another study case, which is drawn in Figure 10b, relates to
ignitions nearby Alice Springs on 17 December 2017.
The wildfires in both events were recorded using an AF sensor the day after the
thunderstorms. We remind the reader that the spatial resolution of LIS ISS is equal in nadir
at ~4 km, so the radius of spatial buffer in our method was chosen to be equal to 2 km. The
distances between lightning flashes (black zipper markers) and close wildfire hotspots (red
points) are less than 2 km. The weather conditions in both study cases promote propagation
of the wildfires to the east in the next one to two days. Additionally, note that before the
strikes, the ignitions in the specified regions are not marked. The meteorological situation
was analyzed by using the GDAS1 meteorological dataset, but due a lack of space, it is not
demonstrated in our work. Moreover, the middle and high tropospheric cloud fraction
(mcld, hcld) and the surface wind (u10, v10) were investigated. The sample of the joint
retrieval of the parameters of ISS LIS and MODUS Active Fires for these study cases are
presented in Supplementary Materials, in Tables S5 and S6.
4.2. The Lightning Wildfires in Forests
The forests covered approximately 3.6% of Australia. Thus, we found only two events
that occurred in the Australian forests. The spatial distributions for forest lightning wildfires
are presented in Figure 11a,b. The study case, which is presented in Figure 11a, was located
near Perth. It corresponded to a single ignition, which was extinguished the next day. Such
behavior usually corresponds to the wet type of lightning wildfires (see Figure 1a).4.1. Lightning Wildfires in the Open Shrublands
Two events of lightning wildfires in the area covered by open shrublands, with
embedded closed shrubland pixels, are presented in Figure 10. The lightning wildfires in
Figure 10a correspond to the event that took place on 29 October 2017, nearby Birdum, in
Atmosphere 2022, 13, 662 the north of Australia. Another study case, which is drawn in Figure 10b, relates15toofigni-
22
tions nearby Alice Springs on 17 December 2017.
Figure
Figure10. 10.The spatial
The joinjoin
spatial distributions of a couple
distributions of the lightning
of a couple flashes and
of the lightning the wildfire
flashes and thehotspots,
wildfire
recorded together by the ISS LIS (black zipper markers) and by the MODIS Terra/Aqua
hotspots, recorded together by the ISS LIS (black zipper markers) and by the MODIS Terra/Aqua (red points)
sensors in thesensors
(red points) northwestern part of Australia.
in the northwestern part(a)
ofcorresponds to corresponds
Australia. (a) the study casetoonthe29study
October
case2017,
on 29
October
and (b) on2017, and (b) on
17 December 17InDecember
2017. both cases, 2017. In both conditions
the weather cases, the promoted
weather conditions
propagation promoted
of the
propagation
wildfires of east
to the the wildfires
in the nexttoone
the to
east
twoindays.
the next onelightning-caused
These to two days. These lightning-caused
wildfires have a placewild-
in
fires have
open a placeThe
shrublands. in open
MODIS shrublands.
land cover The
mapMODIS land cover
(MCD12Q1, 2018)map
was(MCD12Q1, 2018) was image.
used as a background used as a
background image.
Note that severe thunderstorms more often extinguish fires than contribute to their
occurrence. Thus, the burning of a wet forest is a rather rare phenomenon; only isolated
instances of ignition of old, dry trees are possible.
Further, the abnormal case of a massive and rapid extending wildfire triggered by
lightning is presented in Figure 11b. This rapidly spreading wildfire took place in a forest
near Melbourne during the next two days. The global MCD12Q1 land cover map was
used in this work, but the global vegetation maps do not correctly characterize a specific
type of vegetation growing in a particular area. In other words, different types of forests
can correspond to the same spectral range at different parts of the planet. Therefore, to
detail the Australian forests, we used the ABARES 2019 map adapted to the vegetation
of Australia (ABARES) [47]. According to ABARES 2019, the forests growing between
Melbourne and Canberra are characterized as Eucalypt open forests. Therefore, the rapid
spread of wildfires can be explained by the fact that the leaves of Eucalyptus emit the
essential oils of Eucalyptus, which can be easily ignited.The forests covered approximately 3.6% of Australia. Thus, we found only two
events that occurred in the Australian forests. The spatial distributions for forest light-
ning wildfires are presented in Figure 11a,b. The study case, which is presented in Figure
11a, was located near Perth. It corresponded to a single ignition, which was extinguished
Atmosphere 2022, 13, 662 the next day. Such behavior usually corresponds to the wet type of lightning 16 wildfires
of 22
(see Figure 1a).
11. The
Figure 11.
Figure Thespatial distributions
spatial distributions of ISS
of LIS
ISS lightning flashesflashes
LIS lightning and theand
MODIS
the active
MODIS firesactive
that were
fires that
were recorded
recorded on 22 on 22 October
October 2020 (a)2020
and(a)
onand on 1 2019
1 March March(b)2019
in the(b) in the Australian
Australian forests areforests
shown.areTheshown.
The
studystudy case
case (a) (a) corresponds
corresponds to a single
to a single active
active fire fire
(AF) (AF) MODIS
MODIS pixel, extinguished
pixel, extinguished the and
the next day, next day,
and (b) represents
(b) represents uncommon
uncommon massivemassive
wildfire wildfire
hotspots,hotspots,
which spreadwhich spread
rapidly rapidly
during during
next two next two
days.
days.
4.3. The Sheet Lightning Wildfires at the Boundary of a Thunderstorm
We remind the reader that edge or sheet lightning wildfires are wildfires that are
triggered on the boundary of a thunderstorm front (see Figure 1b). Sometimes, the thunder-
storm front itself can have sufficient length. Such thunderstorms occurred in the north part
of Australia on 25–26 December 2018. Several lightning wildfires were established near
Darwin (Figure 12a) and Cairns (Figure 12b) at the boundary of thunderstorm fronts.
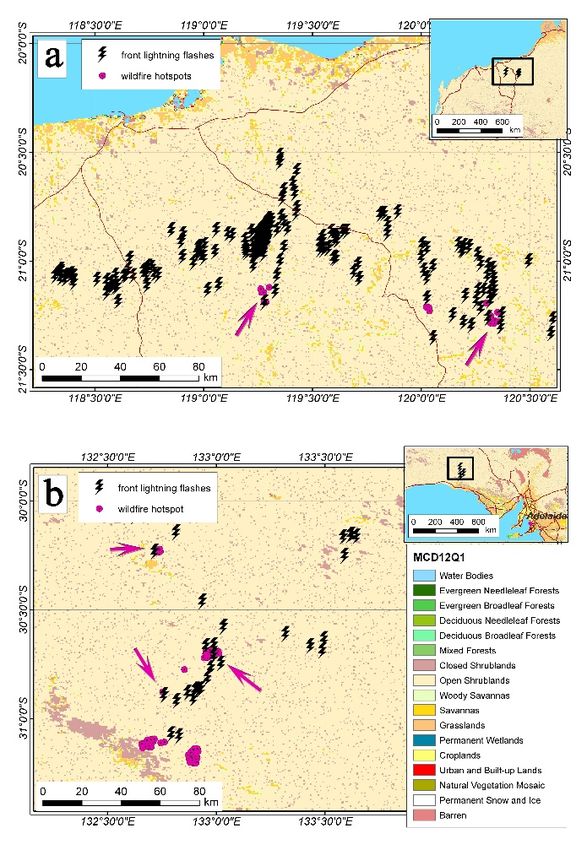
Other samples of multiple ignitions of lightning wildfires separated by a long distance
(30–80 km) are presented in Figure 13a,b. In particular, the two events of lightning wildfire
ignitions took place on 21 October 2019, in the northwest of Australia (Figure 13a). Further,
three lightning wildfires, presented in Figure 13b, correspond to events that took place in
the south of Australia on 29 December 2019.
Thus, when the dry period changes to a wet one, a special condition may be created
in which strong thunderstorms can lead to numerous fires. It occurs because, firstly,
during this period, the thunderstorm strikes are already strong enough, and secondly, the
underlying surface layer remains dry from the previous dry period.4.3. The Sheet Lightning Wildfires at the Boundary of a Thunderstorm
We remind the reader that edge or sheet lightning wildfires are wildfires that are
triggered on the boundary of a thunderstorm front (see Figure 1b). Sometimes, the
thunderstorm front itself can have sufficient length. Such thunderstorms occurred in the
north part of Australia on 25–26 December 2018. Several lightning wildfires were estab-
Atmosphere 2022, 13, 662 lished near Darwin (Figure 12a) and Cairns (Figure 12b) at the boundary of thunderstorm 17 of 22
fronts.
Atmosphere 2022, 13, x FOR PEER REVIEW 18 of 23
Other samples of multiple ignitions of lightning wildfires separated by a long dis-
tance (30–80 km) are presented in Figure 13a,b. In particular, the two events of lightning
12. Thetook
Figure ignitions
wildfire period
place ofonlightning wildfires
21 October in on 25–26 December 2018(Figure
is presented for two study
Figure 12. The period of lightning wildfires2019, the December
on 25–26 northwest of Australia
2018 is presented for two study
cases,
13a). which
Further, took
three place
lightning in the north
wildfires, part
presentedof Australia,
in near
Figure13b, Darwin
correspond to(a) and
events
cases, which took place in the north part of Australia, near Darwin (a) and Cairns (b). Cairns
These (b).
that These Figures
Figures
took place in the
demonstrate south
that of Australia
wildfires, on 29 by
triggered December 2019. storms, are allocated at the edge of thunderstorms.
demonstrate that wildfires, triggered by thethe lightning
lightning storms, are allocated at the edge of thunder-
storms.
Figure
Figure 13.13.
TheThe
lightning wildfires
lightning on 21 on
wildfires October 2019 (2 events)
21 October 2019 (2and on 29and
events) December
on 29 2019 (3
December 2019 (3 events) are
events) are illustrated by multiple ignitions of the thunderstorm front in (a,b), accordingly. The
illustrated by multiple ignitions of the thunderstorm front in (a,b), accordingly.
lightning-caused wildfires in both study cases happened at the same time, but were separated by The lightning-caused
wildfires
tens in both study cases happened at the same time, but were separated by tens of kilometers.
of kilometers.
Thus, when the dry period changes to a wet one, a special condition may be created
in which strong thunderstorms can lead to numerous fires. It occurs because, firstly,
during this period, the thunderstorm strikes are already strong enough, and secondly,
the underlying surface layer remains dry from the previous dry period.You can also read