MARKETS ARE MOVING: THE ECONOMIC COSTS OF AUSTRALIA'S CLIMATE INACTION - CLIMATECOUNCIL.ORG.AU
←
→
Page content transcription
If your browser does not render page correctly, please read the page content below
MARKETS ARE MOVING:
THE ECONOMIC
COSTS OF AUSTRALIA'S
CLIMATE INACTION

CLIMATECOUNCIL.ORG.AU
Thank you for
supporting the
Climate Council.
The Climate Council is an independent, crowd-funded organisation
providing quality information on climate change to the Australian public.
Published by the Climate Council of Australia Limited.
ISBN: 978-1-922404-32-9 (print)
978-1-922404-33-6 (digital)
Nicki Hutley
© Climate Council of Australia Ltd 2021. Councillor (Economics)
This work is copyright the Climate Council of Australia Ltd. All material
contained in this work is copyright the Climate Council of Australia Ltd
except where a third party source is indicated.
Climate Council of Australia Ltd copyright material is licensed under the
Creative Commons Attribution 3.0 Australia License. To view a copy of this
license visit http://creativecommons.org.au.
You are free to copy, communicate and adapt the Climate Council of
Australia Ltd copyright material so long as you attribute the Climate Council
of Australia Ltd and the authors in the following manner: Markets are moving:
the economic costs of Australia's climate inaction.
Author: Nicki Hutley, Councillor (Economics).
—
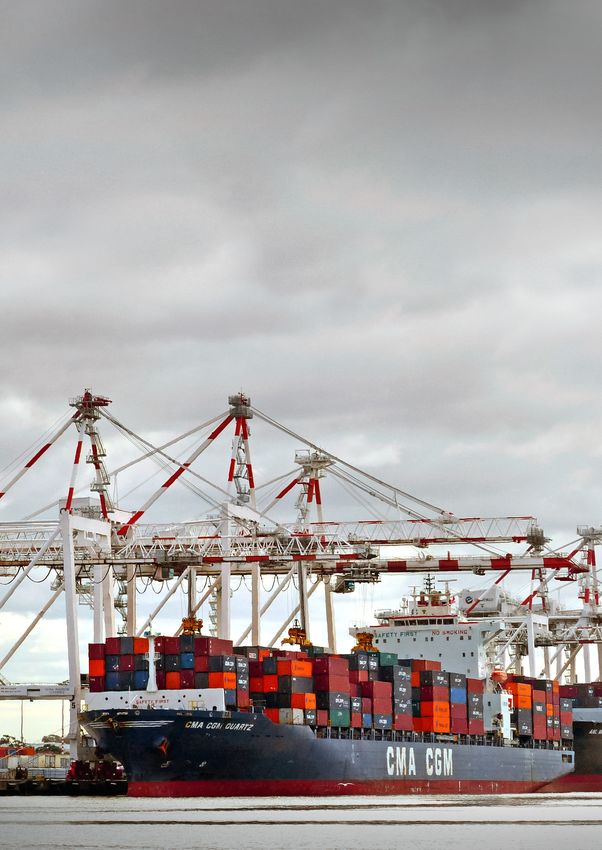
Cover image: 'Port of Melbourne' by Flickr user Bernard Spragg. NZ licensed
under CC0 1.0 Universal (CC0 1.0) Public Domain Dedication.
This report is printed on 100% recycled paper.
facebook.com/climatecouncil info@climatecouncil.org.au
twitter.com/climatecouncil climatecouncil.org.au
CLIMATE COUNCIL                      i

Contents
Key findings...................................................................................................................................................................................... ii

1.     Introduction...............................................................................................................................................................................1

2.     Levelling the economic playing field ................................................................................................................................ 3
       2.1        The role of carbon pricing                                                                                                                                                      4
       2.2        Carbon Border Adjustment Mechanisms are on the way                                                                                                                               7

3.     The economic impacts of carbon tariffs.......................................................................................................................... 9
       3.1        Scenarios modelled                                                                                                                                                             10
       3.2        Calculating the impact                                                                                                                                                         12
       3.3        National economic impacts                                                                                                                                                      16
       3.4        State and territory economic impacts                                                                                                                                           17
       3.5        Industry economic impacts                                                                                                                                                      19

4.     Conclusions............................................................................................................................................................................ 20
       Appendix A: Brief overview of the GTAP model with Environmental Enhancements                                                                                                             22
       Appendix B: Calculating the exogenously imposed shifts in export demand schedules in VURM                                                                                                25
       Appendix C: Estimated changes in real value added and employment by industry                                                                                                             27

References....................................................................................................................................................................................... 29

Image credits.................................................................................................................................................................................. 30
ii MARKETS ARE MOVING:
THE ECONOMIC COSTS OF AUSTRALIA'S CLIMATE INACTION
Key findings
1 2
The world is moving to respond to the Economic modelling shows that carbon border
climate crisis with carbon border tariffs tariffs will reduce demand for Australian
now inevitable. Australians will pay a price exports, lower economic growth and put
due to our slow and weak national progress thousands of Australian jobs at risk.
in cutting greenhouse gas emissions.
› Australia will experience a cut to our Gross
› The European Union has already announced a Domestic Product (GDP) from the EU’s CBAM. If
Carbon Border Adjustment Mechanism (CBAM) South Korea, China and the Group of 7 (G7) follow
and this is expected to be the first of many suit our GDP losses will reach more than $4 billion.
such schemes as countries seek to re-level the The loss to national income is more than $12.5
playing field on climate action. billion, representing a loss in living standards.
Several thousand jobs are also at risk.
› Such moves are being considered by other
jurisdictions, including Australia’s key trading › The impacts will not be even across states, or
partners, as countries readjust their response in sectors, with Queensland and New South Wales to
line with the urgency of the climate challenge. bear the brunt due to the dominance of targeted
export goods – particularly coal – produced in
› As one of the world’s heaviest per capita those states.
emitters, and an advanced economy, Australia
is under increasing international pressure to › If South Korea, China and the G7 follow the EU in
use its natural advantages to cut emissions introducing CBAMs, Queensland could lose more
rapidly and deeply this decade and help the than 50,000 jobs, while in NSW around 20,000 jobs
world reach net zero as quickly as possible. would be at risk. Under this scenario, Queensland
is projected to lose more than $10 billion in Gross
› Australians are already wearing considerable State Product, and NSW more than $5 billion.
climate costs related to worsening extreme
weather. Under a high emissions scenario, › Such economic losses will be compounded by other
the costs of more frequent and severe events factors such as a rise in the cost of capital which
such as bushfires, storms and floods, as well as will result in falling public and private investment;
longer-term trends such as rising sea levels and dragging down growth and employment further.
average temperatures, could rise to $94 billion
per year for Australia by 2060 and $129 billion
per year by 2100.KEY FINDINGS iii
3
Every day that the Australian Government
delays climate action it is hurting households
and businesses in missed economic
opportunities and rising costs.
› By failing to act on climate change and promote
low emissions industries, Australia is missing
out on significant economic opportunities as
global demand for clean products accelerates. For
example, Sweden is providing green steel for Volvo,
while the Canadian Government has announced
it will become a world leader in carbon neutral
cement in partnership with that industry.
› Modelling by Deloitte Access Economics suggests
support for a low carbon economy in Australia will
add $680 billion in economic growth and 250,000
new jobs by 2070.
› The green economy in the UK is now estimated to
be worth almost $A400 billion, which is four times
bigger than the manufacturing sector, and growth
is forecast to increase by 6.7% a year over the five
years to 2025-26.
› A growing number of countries have a carbon
price which requires those responsible for creating
emissions to pay for them. As such carbon prices
continue to rise over time in the face of stronger
global commitments on net zero, the costs of
failing to act will also rise.
› The science is clear that all countries must slash
emissions this decade, with the Climate Council
recommending a 75% cut this decade for Australia
on the way to net zero by 2035. As a first step, the
federal government should at least match the
commitments of our key allies, and pledge to at
least halve our national emissions by 2030.
climatecouncil.org.au1 MARKETS ARE MOVING:
THE ECONOMIC COSTS OF AUSTRALIA'S CLIMATE INACTION
1. Introduction
The world’s climate scientists could We are already counting the costs from
not be clearer: human induced climate climate-driven disasters such as bushfires,
change is accelerating and poses droughts, cyclones, and flooding. These
severe environmental, social and worsening climate impacts do not only cause
economic risks to us all (IPCC 2021). physical damage to property. Economic
Our response must match the scale activity is disrupted, productivity is lost,
and urgency of this challenge. and health costs – both physical and mental
– rise. Even education is being disrupted
as a result of increased absenteeism, when
schools cannot adequately cool classrooms
(Canadian Institute for Climate Choices
2020). The loss of life and biodiversity
is challenging to measure precisely in
economic terms, but we know these costs are
unacceptably high. All told, these disasters
are estimated to have led to global economic
losses of A$272 billion in 2020, according to
Munich Re research (Climate Council 2021).
Acting swiftly on climate change matters.
Failing to rapidly cut emissions this decade
is forecast to lead to exponential increases
in the costs of climate change over multiple
generations. One estimate puts global
economic losses of failing to act at A$24.1
Climate disasters cost
the global economy
A$272 billion in 2020.CHAPTER 01 2
INTRODUCTION
trillion per year by 21001 (Kompas et al. There is no time to lose, and the patience
2018). For Australia, the figure is A$129 of nations that have led the way on climate
billion per year. In reflecting on both the action for laggards like Australia to catch
economic risks of climate change and up is rapidly wearing thin. The Australian
the opportunities for cleaner economic Government has failed to recognise the
investment and growth, the International costs of climate change, and the significant
Monetary Fund (IMF) chose to include economic opportunities in acting swiftly
climate change in its regular economic and early on climate change. In contrast,
reporting and financial stability assessment carbon border tariffs are now inevitable
program (Gaspar and Parry 2021). with Australia in the firing line due to our
slow and weak national progress in cutting
Many countries are readjusting their greenhouse gas emissions. The question
climate response in line with the scale isn’t whether we should act on climate
and urgency of the challenge, but not all change, but when will we choose to do so?
and not evenly. This lack of coordination Every day we delay, we pay a heavier price.
means that, from an international trade
perspective, there is an uneven playing
field, with some countries bearing an
economic loss because other countries
are slower in cutting their emissions. The
IMF has recently proposed an international
carbon price floor arrangement as a
solution. However, this is still a new idea
and likely a long way from adoption (Gaspar
and Parry 2021).
1 The modelled difference between RCP 8.5 (4°C) and RCP 4.5 (2°C).3 MARKETS ARE MOVING:
THE ECONOMIC COSTS OF AUSTRALIA'S CLIMATE INACTION
2. Levelling the economic
playing field
‘Net Zero Emissions’ has emerged While the pathways to achieving net
as the key overarching objective in zero vary widely across, and even within,
responses to climate change across countries, global momentum for coordinated
the globe, with many countries also action has been building throughout 2021. At
setting strong interim targets for 2030. US President Joe Biden’s Leaders’ Summit on
In fact, net zero targets are now in Climate in April 2021 and the Group of 7 (G7)
place across 68% of global GDP and Summit in June 2021, national leaders were
61% of global emissions (Black et al. forthright in their public statements on the
2021). This includes Australia’s largest need for urgent climate action. In the lead up
trading partners – China, Japan, the to November’s United Nations climate talks
United States (US), South Korea and in Glasgow (known as COP26), countries
the United Kingdom (UK). Indeed, over have announced a series of higher and faster
80% of our country’s 20 largest trading commitments to reduce their greenhouse
partners are racing to reach net zero gas (GHG) emissions by 2030.
by 2050 at the latest (Phillips 2021).
While there are numerous policy options
which can and should be adopted to ensure
meaningful action on climate change, we are
seeing increasing consideration and adoption
of carbon pricing mechanisms as the most
effective and efficient means of accelerating
emissions reduction (OECD 2016).CHAPTER 02 4
LEVELLING THE ECONOMIC PLAYING FIELD
2.1 The role of carbon pricing
A carbon price requires those responsible Even among jurisdictions that have a price
for creating emissions to pay for them. on carbon, that price varied from as little as
Without this price, the costs of emissions US$1 per tonne of carbon dioxide equivalent
and the climate impacts that result cascades (tCO 2 e3) up to US$137 per tonne in 2021
across societies and countries over multiple (World Bank 2021). This lack of coordination
generations, creating significant inequality. means that, from an international trade
By contrast, carbon prices make the cost of perspective, there is an uneven playing field,
GHGs for any product clear, and send a price with some countries bearing an economic
signal that reduces both consumption and loss without any overall change in emissions.
production of that product, and stimulates
investment in low-carbon alternatives. The challenge for countries with, or
Carbon prices may be implemented either considering, carbon pricing is twofold:
under an Emissions Trading Scheme (ETS)
or as a fixed price (a carbon tax). The price 1. There is the potential for a loss of
is set by and payable to the government economic activity if companies chose to
operating the scheme. move production offshore to a country
without a carbon price – a concept
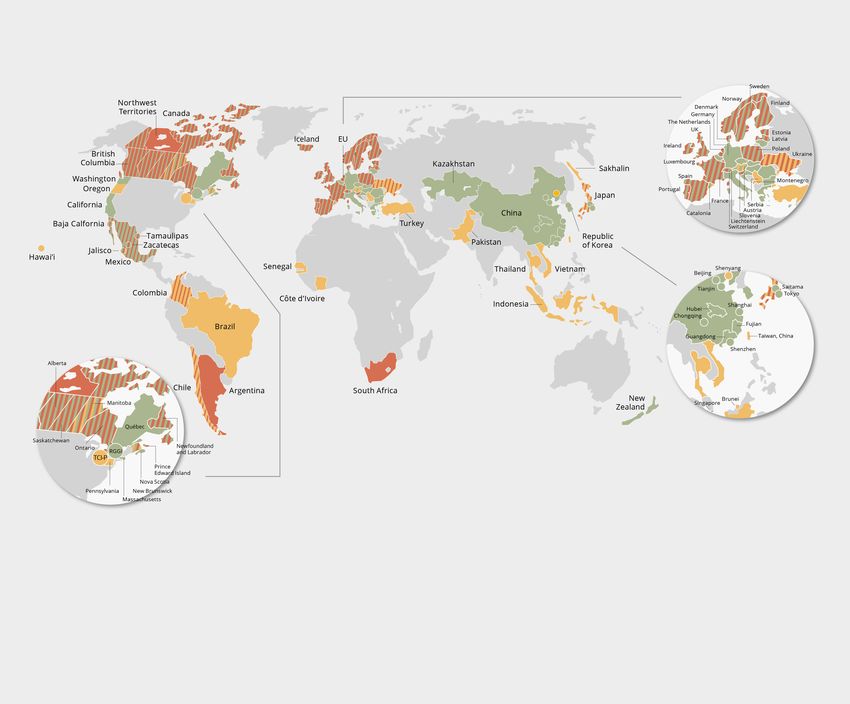
In 2021, there are 64 carbon pricing known as “carbon leakage”
instruments in place, with a further three
scheduled to be put in place, as shown in 2. There is the likelihood of loss of
Figure 1. These schemes are operating in 45 competitiveness for local producers
national jurisdictions and 35 sub-national forced to compete with imports from
jurisdictions2, which together cover over countries that don’t have (or have a
one fifth (21.5%) of global emissions, up lower) carbon price.
from 15% in 2020 (World Bank 2021). This
increase in coverage comes chiefly from To date, jurisdictions such as the European
the launch of China’s national scheme, Union (EU) have dealt with this challenge by
which is now the largest carbon market allowing “free” carbon permits to emitters.
in the world (World Bank 2021). The World Such practices undermine the effectiveness
Bank recently launched a Partnership for of carbon pricing.
Market Implementation to support countries
wanting to adopt a carbon price scheme The IMF has recently proposed an international
(World Bank 2021). carbon price floor arrangement as a means
of addressing these challenges. However, this
However, while many countries have adopted is still a new idea and likely a long way from
a carbon pricing mechanism, to date there adoption (Gasper and Parry 2021).
has been no global coordination. This means
the price of carbon applied, the products
to which the price is applied, as well as the
design of the schemes all vary considerably.
2 Some schemes such as the US Regional Greenhouse Gas Initiative (RGGI) cover more than one state (jurisdiction).
3 CO 2 e is a metric measure used to compare the emissions from various greenhouse gases on the basis of their global-warming potential (GWP), by
converting amounts of other gases to the equivalent amount of carbon dioxide with the same global warming potential.CARBON PRICING MAP (2021) Figure 1: Global carbon pricing schemes. Source: World Bank (2021).
ETS implemented or scheduled for implementation          ETS and carbon tax implemented or scheduled

   Carbon tax implemented or scheduled for implementation   Carbon tax implemented or scheduled, ETS under consideration

   ETS or carbon tax under consideration                    ETS implemented or scheduled, ETS or carbon tax under consideration

                                                            ETS and carbon tax implemented or scheduled, ETS or carbon tax

TCI-P = Transportation and Climate initiative Program

RGGI = Regional Greenhouse Gas Initiative
7 MARKETS ARE MOVING:
THE ECONOMIC COSTS OF AUSTRALIA'S CLIMATE INACTION
2.2 Carbon Border Adjustment
Mechanisms are on the way
There is now increased consideration
being given to Carbon Border Adjustment
Mechanisms (CBAMs) as an alternative
pathway to mitigate the above challenges and
ensure a level playing field for economies that
have carbon pricing schemes. Such schemes
are actively under consideration by the EU,
US, UK, Canada, and Japan.
BOX 1: WHAT IS A CARBON BORDER ADJUSTMENT MECHANISM (CBAM)?
Under a CBAM, importers to countries with a for 55” climate package which includes the
carbon price will need to buy carbon certificates introduction of a CBAM from 2023.
based on the price they would have paid if these
goods were produced under their own carbon The scheme will initially apply only to direct
pricing rules. In effect, they will pay a tariff emissions from iron, steel, cement, fertiliser,
for the carbon embedded in products, such as aluminium, and electricity, with other products
manufactured metals, that has not been paid for to be added in the future. Actual tariffs will be
during production. Imports from countries with introduced from 2026 once the scheme is fully
similar emissions policies are treated equally operational. Details of the scheme are yet to be
with domestic goods. sorted, but the introduction is now inevitable.
Any emissions-intensive product or sector The Canadian Government has also committed
could potentially be covered by a CBAM. to explore the potential of a CBAM with like-
minded economies (World Bank 2021). While in
In December 2019, the EU formally proposed the US, President Biden is considering a “border
the introduction of a CBAM, as part of the adjustment tax” on countries that fail to meet
European Green Deal (European Commission climate obligations (Jordans 2021).
2020). Investigations of a CBAM have been
underway for several years but accelerated
throughout the first half of 2021, culminating
in the July 2021 announcement of the “FitCHAPTER 02 8
LEVELLING THE ECONOMIC PLAYING FIELD
At the moment, countries like Australia that number of factors including the number
have poor climate policies are economically of countries imposing a tariff, the percent
benefiting from exporting emissions- of total exports affected, and the size of the
intensive products at the expense of tariff imposed.
countries with carbon pricing. As the EU
Commission has stated: “Climate change is Countries such as Australia that will be
a global problem that needs global solutions” adversely affected by the EU CBAM have
(European Commission 2021). In the criticised the scheme as being protectionist
absence of global carbon pricing and other and potentially in conflict with World Trade
commitments on emissions reductions, we Organisation (WTO) principles. The legal
can expect to see wider adoption of CBAMs technicalities of a CBAM are outside the
accelerate over time. scope of this paper. However, we note that
the European Parliament has consistently
Under a CBAM, a carbon tariff is applied to and explicitly stated support for a WTO-
exports of targeted goods from countries compatible CBAM scheme (European
like Australia at the price of the importing Commission 2021) and a scheme that aims
country’s ETS. This raises the price of our to reduce carbon emissions globally and
exports, which in turn is likely to reduce that does not discriminate against any one
demand for these goods. As exports make particular trading partner is likely to comply
up a significant portion of overall Australian with WTO rules (McKenzie et al. 2021). This
economic activity, Gross Domestic Product view is supported by the Australian Institute
(GDP) can be expected to be lower under of International Affairs, which has observed
such a scenario. that there are “many reasons” to justify that
the proposed CBAM is WTO-compliant (de
There will also be flow-on implications Orte Júlvez 2021).
beyond export demand with the size of the
“shock” to the economy depending on a
Carbon tariffs will affect
the economy of climate
laggard Australia.9 MARKETS ARE MOVING:
THE ECONOMIC COSTS OF AUSTRALIA'S CLIMATE INACTION
3. The economic impacts
of carbon tariffs
A Carbon Border Adjustment BOX 2: THE VURM MODEL
Mechanism will affect the Australian
economy through multiple channels.
Initially, the scheme raises the cost VURM is a bottom-up model
of targeted exports in the countries of Australia’s six states and two
imposing a carbon price. This reduces territories. By bottom-up we mean
demand for these exports, which, that each of the regional economies
as noted, leads to lower economic is modelled as an economy in its own
growth. Over time, lower export right, with region-specific households,
volumes will result in different price industries, prices, etc. The regions are
impacts for different goods. linked via model-determined changes
in inter-state trade and movement of
Falling export prices mean a deterioration labour and capital.
in Australia’s terms of trade because the
prices of exports fall relative to the prices In the version of VURM used for the
of imports. This reduces real income study, there are 83 industry sectors,
available for consumption which results in of which 34 are potentially affected
lower consumer spending, also reducing directly by carbon tariffs.
economic growth.
On the other hand, lower export demand
typically leads to a lower value for the
Australian dollar, which acts as an It is noted that CBAMs by their nature are
economic adjustment mechanism over complex. They need to consider factors
time by stimulating investment in other such as global trading rules and also
(non-carbon-intensive) exports. whether a product is made with localised
renewable energy or energy from the
To understand the full implications of grid that is emissions-intensive. These
the introduction of a CBAM by different complexities are outside the scope of
countries on a range of different goods, consideration of this paper. Rather, we
Victoria University’s Centre of Policy focus on the broad implications for the
Studies undertook Computable General Australian economy of the introduction
Equilibrium (CGE) modelling using the of CBAMs on emissions-intensive goods
Victoria University Regional Model (VURM). produced with average levels of carbon
This provides a balanced assessment of intensity for the country as a whole.
the adjustments on Australia’s economy
and its industrial structure, reflecting the
economic environment within which
changes occur.CHAPTER 03 10
THE ECONOMIC IMPACTS OF CARBON TARIFFS
3.1 Scenarios modelled
To understand the ramifications for Australia The carbon prices chosen reflect recent
of introducing CBAMs elsewhere, three market prices, but are likely conservative
scenarios were considered: if recent trends in prices continue into the
future. Increases in prices are a reasonable
1. The EU – imposes a CBAM with a price expectation. For example, modelling
on carbon of €59 (A$95) per tonne (ETS suggests that to meet the EU’s latest
price as at 27 August 2021). ambitions on emissions reductions (a cut
of 50% to 55% by 2030 on 1990 levels), the
2. G74 and South Korea – all impose a carbon price under the ETS will rise to
CBAM with an average carbon price of €129 (A$208) per tonne in 2030 (Pietzer et
US$39 (A$54) per tonne (based on the al. 2021). This implies that the modelled
IHS Weighted global carbon price, which economic impacts for this report are likely
includes the EU and US schemes, as of to be conservative estimates.
27 August 2021).
3. China – imposes a CBAM at the average
global price of US$39 (A$54) per tonne, as
there is no live price for China’s national
carbon scheme.
Figure 2: EU ETS unit price for carbon (Euros). Source: Trading Economics (2021).
EU CARBON PERMITS
EU ETS unit price for carbon (Euros)
60
50
40
30
20
10
2012 2014 2016 2018 2020
Year
4 G7 includes USA, Japan, Canada, UK, France, Germany and Italy.11 MARKETS ARE MOVING:
THE ECONOMIC COSTS OF AUSTRALIA'S CLIMATE INACTION
Under each of these scenarios, a carbon The relative importance of each of these
price is applied to the following goods, either products is shown in Table 1 below with
already selected by the EU for its CBAM or products linked to Australian Bureau of
considered likely to be included in future Statistics’ industry categories.
schemes, and also representing a significant
percentage of Australian exports: Table 1 clearly shows that, while the EU
alone imports a relatively small share of
› Coal5 these Australian products, if schemes
› Gas (LNG)6 were introduced among our major trading
› Chemical products partners that also have a price on carbon,
› Cement the effect is magnified significantly.
› Primary and secondary iron and steel
products
› Alumina and primary and secondary
aluminium products.
Table 1: Regional share of Australian exports (2019).
EU G7+S.Korea China
Product (%) (%) (%)
Iron and steel 2.5 23.7 1.7
Alumina refining 0.0 0.3 0.0
Aluminium smelting 0.0 65.3 0.8
Fabricated metal products 8.1 59.2 20.2
Basic chemicals, plastics, rubber 12.5 36.0 23.4
Non-metallic building products 6.1 17.1 8.3
Gas mining and LNG 0.0 7.1 22.4
Coal mining 5.2 38.7 39.0
Source: Data from DFAT (2021).
5 Untaxed fugitive emissions in Australia only. Combustion emissions from coal and gas will be taxed in each region regardless of the source of the
product under the existing local carbon tax schemes.
6 As above.CHAPTER 03 12
THE ECONOMIC IMPACTS OF CARBON TARIFFS
3.2 Calculating the impact
The first stage of the modelling process
is to estimate the change in demand for
Australian exports to target regions, which is
calculated in three steps, as shown in Figure
3 below. The changes in Step 3 are then used
as inputs to “shock” the VURM.
Figure 3: Calculating the initial impacts of carbon tariffs on Australia’s economy.
STEP 1: For each region with a carbon price, estimate the price
increase on locally produced target goods
STEP 2: Estimate the increase in prices of Australian products
facing a carbon tariff
STEP 3: Calculate the change in demand for Australian exports
subject to carbon pricing13 MARKETS ARE MOVING:
THE ECONOMIC COSTS OF AUSTRALIA'S CLIMATE INACTION
Step 1: Effects of a carbon price To calculate the initial effects on purchaser’s
on buyer prices for domestically prices of domestically-produced products
produced goods in select regions as a result of their emissions, simulations
from a specially adapted version of the Global
First, for each of the three regions, we Trade Analysis Project (GTAP) CGE model are
estimate the impact of the assumed carbon used. GTAP is rich in detail, particularly for
price on the purchasers’ price of domestically the type of forward and backward linkages
produced products. described previously. Appendix A contains a
brief description of GTAP.
A price on carbon emissions affects prices
paid in a region in line with the carbon For each of the three regions, a carbon price
content of production. Calculating carbon is imposed on all relevant emissions and the
content is not straightforward. Take for impact on purchasers’ prices is modelled
example the production of aluminium. under the following assumptions.
Compared to the immense quantities of
fossil fuel burned to supply electricity to the › All primary factor prices are held fixed, so
plant, aluminium smelting uses little fossil that the emissions price cannot affect the
fuel directly. Its main inputs are alumina unit costs of capital, labour and land.
and electricity. Gas is an important input
to production of alumina, while electricity › Final demand (consumption, investment,
supply currently relies on significant stock build up and exports) is fixed. Thus,
amounts of coal and gas power. Aluminium final demand cannot respond to changes
production seldom occurs close to the in price, allowing the carbon charge to flow
point of alumina production, so significant fully into final demand prices.
amounts of transport fuel are used in
transporting alumina to the aluminium › All relative-price substitution elasticities
smelters. The same applies to moving are set to zero. This, along with fixed final
aluminium from the smelter to downstream demand, forces demand generally to be
customers. Thus, aluminium has a relatively unresponsive to price.
high carbon content, even though direct
emissions at the smelter are small. With the model set up in this way, simulated
changes in purchasers’ prices give, in
As can be seen from this example, calculating principle, the cost of the carbon charge only.
carbon content requires knowledge of direct
emissions at the point of production plus
information on indirect emissions that arise
through forward and backward linkages to
the rest of the economy.CHAPTER 03 14
THE ECONOMIC IMPACTS OF CARBON TARIFFS
Step 2: Estimate the increase in prices
for Australian products under CBAM
We assume that each region imposes tariff
increases on Australian imports that raise the
purchasers’ prices of the Australian produced
item by the same amount as the increase in
price of the domestically produced product
(from Step 1).
Table 2 shows, for each region, the percentage
changes in the price of selected imported
Australian products with a carbon tariff.
Table 2: Estimated impact of carbon price on buyer prices of domestically produced products (% change).
EU G7+S.Korea China
Product (%) (%) (%)
Iron and steel 14.7 7.7 10.0
Alumina refining 5.3 2.8 3.6
Aluminium smelting 5.8 3.1 4.0
Fabricated metal products 3.7 1.9 2.5
Basic chemicals, plastics, rubber 1.9 1.0 1.2
Non-metallic building products 2.2 1.1 1.3
Gas mining and LNG 31.3 16.4 18.5
Coal mining 341.7 178.9 204.0
Source: Data from VU CoPs modelling.
Table 3: Estimated increase in landed duty-paid prices of Australian products (% change).
EU G7+S.Korea China
Product (%) (%) (%)
Iron and steel 14.7 7.7 10.0
Alumina refining 5.3 2.8 3.6
Aluminium smelting 5.8 3.1 4.0
Fabricated metal products 3.7 1.9 2.5
Basic chemicals, plastics, rubber 1.9 1.0 1.2
Non-metallic building products 2.2 1.1 1.3
Gas mining and LNG 6.3 3.3 3.7
Coal mining 23.9 12.5 14.3
Source: Data from VU CoPs modelling.15 MARKETS ARE MOVING:
THE ECONOMIC COSTS OF AUSTRALIA'S CLIMATE INACTION
Step 3: Estimating changes in export
demand as a result of CBAM
Carbon tariffs directly affect Australian
producers via a contraction in export demand.
For each region and product, we calculate the
percent change in export demand based on
price shifts and regional share of exports.7
This is shown in Table 4 below.
A more detailed explanation of the Step 3
calculation is given in Appendix B.
Table 4: Estimated change in Australian export demand as a result of carbon prices (%).
EU G7+S.Korea China
Product (%) (%) (%)
Iron and steel -0.3 -1.7 -0.2
Alumina refining 0.0 0.0 0.0
Aluminium smelting 0.0 -1.9 0.0
Fabricated metal products -0.3 -1.1 -0.5
Basic chemicals, plastics, rubber -0.2 -0.4 -0.3
Non-metallic building products -0.1 -0.2 -0.1
Gas mining and LNG 0.0 -0.2 -0.8
Coal mining -1.0 -4.3 -4.9
Source: Data from VU CoPs modelling.
7 The shift in demand is the product of (1) the inverse of the percentage increase in purchasers’ price of the Australian-produced product given in
Table 1 and (2) the share of the respective region in total export demand.CHAPTER 03 16
THE ECONOMIC IMPACTS OF CARBON TARIFFS
3.3 National economic impacts
The model allows for all direct and flow- A loss in GDP of more than $4 billion would
on impacts to be estimated. The results occur if the G7, South Korea and China
presented in this section compare the three were all to implement a CBAM, which is
regional outcomes, noting that Germany, equivalent to more than $12.5 billion in terms
France and Italy are in both the EU and of national income. This represents a small,
the G7. Results under a Chinese CBAM are but meaningful loss in living standards, with
marginally higher than for the G7 plus South several thousand jobs also put at risk.
Korea scenario, implying a doubling of
impact if G7, South Korea and China were to These impacts are not spread evenly across
impose CBAMs simultaneously. regions or industries.
Under each scenario, Australia’s terms of
trade decline in the first few years of the
scheme: by -0.2% for the EU, -0.7% for the
G7 and South Korea, and -0.8% under a
China scheme. This leads to falls in real
GDP and national income (GNI), as well as
employment, as shown in Table 5 below.
Table 5: Estimated long run change in Australian economy as a result of CBAM.
EU G7+S.Korea China
Product (%) (%) (%)
Real GDP -$0.42 bn* (-0.02%) -$1.95 bn (-0.11%) -$2.45 bn (-0.13%)
Real GNI -$1.75 bn (-0.07%) -$5.87 bn (-0.29%) -$6.65 bn (-0.33%)
Employment -800 -2,600 -3,600
* In 2021 prices. Source: Data from VU CoPs modelling.
Australia would lose $12.5 billion in
national income and thousands of jobs
are at risk, if the G7, South Korea and
China were all to implement a CBAM.17 MARKETS ARE MOVING:
THE ECONOMIC COSTS OF AUSTRALIA'S CLIMATE INACTION
3.4 State and territory
economic impacts
As shown in Figure 4 below, Queensland
and New South Wales (NSW) bear the brunt
of the impact, reflecting the dominance of
targeted export goods produced in those
states. Employment losses in Queensland
would be in the tens of thousands, as shown
in Figure 5.
In contrast, Western Australia and Victoria
actually benefit as a result of adjustment in
the structure of the economy in response to
the CBAM and the lower Australian dollar.
Figure 4: Long run impact of CBAM on state and territory Gross State Product ($ billion, 2021 prices).
LONG RUN IMPACT OF CBAM ON STATE AND TERRITORY GROSS STATE PRODUCT
4.0
3.0
2.0
$ Billion (2021 Prices)
1.0
-
-1.0
-2.0
-3.0 EU
G7+S.Korea
-4.0 China
-5.0
-6.0
NSW VIC QLD SA WA TAS NT ACT
Source: Data from VU CoPs modelling.CHAPTER 03 18
THE ECONOMIC IMPACTS OF CARBON TARIFFS
Figure 5: Long run impact of CBAM on state and territory employment.
LONG RUN IMPACT OF CBAM ON STATE AND TERRITORY EMPLOYMENT
20,000
10,000
-
Job Numbers
-10,000
-20,000
EU
G7+S.Korea
-30,000
China
-40,000
NSW VIC QLD SA WA TAS NT ACT
Source: Data from VU CoPs modelling.
New South Wales and
Queensland would be hit the
hardest if our trading allies
implement a Carbon Border
Adjustment Mechanism.19 MARKETS ARE MOVING:
THE ECONOMIC COSTS OF AUSTRALIA'S CLIMATE INACTION
3.5 Industry economic impacts
It is important to remember that there are As export demand falls and reduces overall
both short and long term impacts from economic growth and household income,
such schemes as a CBAM. the services sector is also hit hard, even
though it is not directly affected by tariffs.
In the short term, demand for specific
products falls. For example, if coal Over the longer term, however, a decline in
is included within the CBAM then, the Australian dollar due to falling exports
unsurprisingly, the hardest hit sectors makes Australian goods more competitive.
in terms of both real value added8 and This supports new investment in non-
employment lost are coal mining and carbon-intensive export sectors as well as
mining services. This is due not only to domestic industries that compete against
its emissions intensity, but also because a imports. The extent to which these sectors
large percentage of coal is exported. are able to grow over time will be heavily
influenced by government policies.
It is worth noting that, in contrast, cement
and fertiliser are not directly impacted, Detailed sector results from the CBAM
because they are not currently exported. modelling are presented in Appendix C.
These sectors will be adversely affected,
however, as Australian companies shift
demand to meet their own net zero targets
and consumer preferences for ‘clean’
products. Updating technology within
these sectors to cut emissions, as a number
of states are doing, could support both
domestic demand and export growth.
8 ‘real value added’ is an economic concept used instead of GDP to describe industry level economic contribution.CHAPTER 04 20
CONCLUSIONS
4. Conclusions
The estimates outlined in this Rising interest rates and tightened credit
paper are based on current carbon supply lead to a reduction in private
pricing schemes and a limited set of sector investment and lower growth and
products. The potential losses could employment outcomes. Higher government
be significantly greater under higher borrowing costs mean increased interest
carbon prices, which are reasonable to payments and reduced ability to spend,
expect over time as countries increase leading to lower economic growth. When
their climate commitments, as well it comes to climate inaction the costs are
as if a broader range of products are many, and compounding.
included under the schemes.
In addition, in failing to act on climate
There are also other potential economic change and promote low emissions
losses that are not captured in this modelling. industries Australia is missing out on
the opportunity to be a first mover and
In particular, and as recently flagged by benefit from increased global demand
both the Reserve Bank Governor (Reserve for clean, green products. For example,
Bank of Australia 2021) and the Federal Sweden is already providing green steel for
Treasurer (Commonwealth of Australia 2021), Volvo (Sayyad 2021), while the Canadian
Australia's failure to act on climate change Government has announced a partnership
has profound implications for both the cost with its cement industry to be a world leader
and potential supply of capital to Australian in carbon neutral cement (Cision Canada
firms, as well as the cost to governments of 2021). Australia could grow a new green
raising funds through the bond market. export mix worth $333 billion per annum,
almost triple the value of existing fossil fuel
Research shows that worsening climate exports (BZE 2021). Modelling by Deloitte
change has already had an impact on Access Economics suggests support for
the cost of capital in climate vulnerable a low carbon economy in Australia will
developing economies, raising borrowing add $680 billion in economic growth and
costs from 1991 to 2017 for private sector 250,000 new jobs by 2070 (Deloitte Access
firms by 0.63% (King et al. 2021). For Economics 2021). In the UK, the green
sovereign debt (government borrowing) over economy has now grown to an estimated
the past decade borrowing costs in climate- $400 billion, which is four times bigger than
vulnerable countries have increased by 1.17 the manufacturing sector. Growth in the
percentage points on average. sector is forecast to increase by 6.7% a year
over the five years to 2025-26 (kMatrix 2021).21 MARKETS ARE MOVING:
THE ECONOMIC COSTS OF AUSTRALIA'S CLIMATE INACTION
More critically, and on a much larger scale, While the modelling shows that, at the
the costs of failing to act on climate change national level, the CBAMs examined are
are well documented. As noted earlier in this unlikely to have a significant national impact,
report, for Australia under a high emissions they will, however, have noticeable impacts at
scenario, the costs of extreme weather events the industrial and state levels. Those impacts
coupled with acute risks such as rising sea are due, in the main, to a reduction in output
levels and higher average temperatures, and employment in the coal sector, and will
could amount to $94 billion per year by be necessary in order for Australia to shift
2060 (Australian Business Roundtable 2021) towards a zero emissions economy.
and $129 billion per year by the end of this
century (Kompass et al. 2018). We are already These reductions are unavoidable, but
bearing considerable costs from the 1.44°C of ideally would occur within Australia’s
warming in Australia. control with appropriate support for
communities and workers directly affected.
The EU’s decision to introduce a CBAM is an The NSW Government reached similar
early warning signal from countries taking conclusions in its 2021 Intergenerational
action on climate change that they will not Report stating that a transition plan is vital
remain silent and ignore the inaction of for communities and workers to adjust to a
other countries. new, post-carbon economy.
During the course of 2021, calls for tougher As one of the world’s heaviest per capita
and more immediate action on climate emitters, Australia should embrace the
change from many global leaders have risen economic opportunity ahead, step up and
dramatically in volume and are increasingly lead on climate change. This would involve
being backed by actions, such as the EU’s not only a firm national commitment to net
“Fit for 55” climate package and net zero zero emissions, preferably by 2035, but also a
commitments from Japan, China and detailed plan for how to cut emissions swiftly
South Korea. We can expect to see further each year backed by robust policies and
commitments made at COP26, and heavy adequate funding.
pressure on any recalcitrant.
The price of failing to do so is too high, both
for Australians today and future generations.
Australia has much to gain if it
chooses to become a first mover in
the new economy, with growing
demand for clean, green products.APPENDIX A: 22
BRIEF OVERVIEW OF THE GTAP MODEL WITH ENVIRONMENTAL ENHANCEMENTS
Appendix A: Brief overview
of the GTAP model with
Environmental Enhancements
The GTAP family of models and VURM are STRUCTURE OF DEMAND
based on a common theoretical framework –
the ORANI model of the Australian economy. GTAP-COPS models demand and supply
Each of the GTAP family can be likened by region, and the inter-regional linkages
to a series of ORANI models, one for each arising from the flows of tradable goods and
national region, linked by a matrix of bilateral services and of capital. In doing so, it ensures
international trade flows. Similarly, VURM that each region’s total exports equals total
can be likened to a series of ORANI models, imports of these goods by other regions.
one for each Australian state and territory,
linked by a matrix of inter-state trade flows. There are four sources of demand: (1) Industry
However, unlike the static ORANI model, demands for current production; (2) Demands
VURM and GTAP-COPS are recursively for inputs to capital creation; (3) Household
dynamic models, developed to address long- demand; and (4) Government demand.
term global policy issues, such as climate
change mitigation costs. Industry demand for current
production
The version of GTAP used in this paper is
labelled GTAP-COPS. Industry demands in each region in
GTAP-COPS are derived from solutions to
a cost-minimisation problem involving a
multi-level production function. Common
to all GTAP models, in GTAP-COPS regional
substitution is allowed between different
national regions.
GTAP-COPS’s structure of industry demand
differs from that specified in GTAP by
making explicit allowance for substitution
possibilities between capital and energy and
between different forms of energy. Such
substitution is relative-price induced.
A maintained assumption in both models
is that producers are price takers in both
input and output markets. GTAP recognises
two broad categories of inputs: intermediate
inputs and primary factors. Industries in
each region are assumed to choose the23 MARKETS ARE MOVING:
THE ECONOMIC COSTS OF AUSTRALIA'S CLIMATE INACTION
mix of inputs that minimises the costs of Demand for inputs to capital creation
production for their level of output. They are
constrained in their choice of inputs by a The second major form of demand is for
production technology of several branches, inputs to capital creation (investment). The
each with a number of levels (or nests). cost-minimising capital creator in each
region in GTAP-COPS combines inputs to
At the first level, the primary-factor bundle assemble units of capital, subject to a nested
(value added) and bundles of intermediate production technology similar to that facing
inputs (including energy units) are used each sector for current production.
in fixed proportions to produce output.
The value-added and intermediate- Investment in each region is financed
input bundles are formed at the second from a global pool of savings. In standard
level. The primary-factor bundle is a comparative-static GTAP, there are two
constant-elasticity-of-substitution (CES) alternative ways of allocating this pool to
combination of labour, fixed capital and investment in each region. The first makes
agricultural land. Each intermediate- investment in each region a fixed proportion
input bundle is a CES combination of of the overall size of the pool – if the pool
a domestically produced good and an increases by 10%, investment in each
internationally imported composite. region increases by 10%. The second relates
investment allocation to relative rates of return.
At the third level, the import-composite is Regions that experience increases in their
formed as a CES combination of goods from rate of return relative to the global average will
each foreign region. Note that the regional receive increased shares of the investment
structure of imports is not user-specific. pool, whereas regions experiencing reductions
in their rate of return relative to the global
In GTAP-COPS, energy is taken out of the average will receive reduced shares.
intermediate bundle and is incorporated
into the value-added nesting. This is done In GTAP-COPS, we adopt a third way. It is
in two steps. First, energy commodities similar to the second approach adopted for
(primary fuels (fossil fuels), refined comparative static modelling, but allows for a
petroleum and electricity) are separated into dynamic relationship between capital growth
two: electricity and non-electricity. Some (investment) and expected rate of return. To
CES-substitution is allowed within the non- ensure that at the global level savings matches
electricity group and between electricity investment, saving by region is endogenously
and non-electricity. adjusted in an equi-proportion way to ensure
that the global condition holds.
Second, the energy bundle is combined
with capital to produce an energy-capital
composite. This is combined with other
primary factors in a value-added-energy
(VAE) bundle.APPENDIX A: 24
BRIEF OVERVIEW OF THE GTAP MODEL WITH ENVIRONMENTAL ENHANCEMENTS
Household demand › Emission response functions are
defined for non-carbon emissions.
In the GTAP-family, in each region household These specify abatement as increasing
(private) consumption is distinguished from functions of the rate of carbon tax and
government (public) consumption. It is reflect the assumption that the marginal
assumed that the household demands goods cost of abatement rises with the level of
and services to maximises utility from a abatement.
given level of income. The utility maximising
decision is based on given prices and a › GTAP-COPS has the facility to use the
utility function with a constant-difference “technology-bundle” approach to model
of elasticities (CDE) function form. Once electricity generation, transport and
the consumption of good c is determined, steel manufacture. Under this approach,
then the household decides on how much multiple technologies are specified
domestically-produced c to use and how for the production of the relevant
much of imported good c to use. The output. The shares of the technologies
sourcing allocation of imports is determined in aggregate output depend on their
in line with the general allocation decision relative profitability but there is no input
made for all users. substitution within technologies.
Government demand › For emerging electricity generation
technologies, such as solar and geothermal,
In GTAP government consumption learning-by-doing mechanisms are
expenditures is assumed to be based added. These lower primary-factor input
on Cobb-Douglas allocation across all requirements per unit of output over time.
commodities. Summary of Environmental
enhancements in GTAP-COPS. › In some mining industries, factor
productivity is assumed to decline with
Brief summary of environmental increases in the cumulative level of resource
enhancements in GTAP-COPS extraction, reflecting increasing extraction
costs as the resource base diminishes.
› Global emissions database that includes
all major sources of greenhouse gases,
except land-use change. This database
is built primarily from data compiled for
the GTAP-E model. That model, however,
ignores most non-carbon emissions
associated with agriculture, fugitives,
industrial processes and waste. Data for
these non-combustion emissions come
from work largely undertaken at the CSIRO.
› As in VURM, in GTAP-COPS it is assumed
that combustion emissions of carbon
are proportional to the quantity of fuel
combusted, while non-carbon emissions
are proportional to the level of production
in the industry generating them.25 MARKETS ARE MOVING:
THE ECONOMIC COSTS OF AUSTRALIA'S CLIMATE INACTION
Appendix B: Calculating the
exogenously imposed shifts in
export demand schedules in VURM
We start with the assumption that world demand for Australian exports is determined with a
constant elasticity. Hence, if X is the volume of Australian exports and P is the world price, then:
X=
( ) P σ
F
(1)
X is the volume of Australian exports;
x=σ (p–f)
P is the world price of the exported product;
F allows for vertical shifts in export demand; and
σ σ(c)
is the (p(c)–
export demand )
=∑s (c)×σ(c)
f(c)elasticity
r
r (
(a numberp(c)+t
like -5). (c)
r )
We assume that there are no transport costs and that all bi-lateral exchange rates are one.
( )
Under these assumptions, the world price is the same as the fob export price in Australia and
P σ
the cif import price in any importing region.
X=
F
The approximate percentage change form of (1) is:
f(c)=–∑sr (c)tr (c)
r
x=σ (p–f)
(2)
where variables(
σ(c) p(c)– )
with=∑s
writtenf(c) lower
r
r
(c)×σ(c) (
case lettersp(c)+t (c) )
signifyrpercentage changes in variable written
in corresponding upper case letters. For example, “x” is the percentage change in the volume
of Australian exports (X). Note that (2) is accurate for small changes.
f(c)=–∑sr (c)tr (c)
rAPPENDIX B: 26
CALCULATING THE EXOGENOUSLY IMPOSED SHIFTS IN EXPORT DEMAND SCHEDULES IN VURM
X=
( ) P σ
F
x=σ(p–f)
For commodity c, export demand equals global import demand. In other-words, for commodity c:
σ(c)
( )
P σ
X = ( p(c)– f(c)) =∑sr (c)×σ(c) ( p(c)+tr (c))
F r
(3)
The LHS of (3) is the same as the RHS of (2) with the addition of the commodity (c) index. The
RHS of (3) is the sum of region-specific demands for commodity c exported from Australia.
x=σ(p–f)
f(c)=–∑simport(c)tr (c)
We assume that the r
r substitution elasticity is the same across all regions and equal to
the export demand elasticity. The variable tr(c) is the percentage change in the purchases’
price of imports due to the imposition of a carbon tariff; p(c) + tr (c) is therefore the percentage
change in duty-paid cif price in region r. Sr is the share of region r in total import demand for
commodity σ(c) ( ) (
c. p(c)– f(c) =∑sr (c)×σ(c) p(c)+tr (c)
r
)
Simple manipulation of (3) yields
f(c)=–∑sr (c)tr (c)
r
(4)
Equation (4) says, for commodity c, that the vertical shift in export demand equals a trade-
share weighted sum of percentage changes in purchases’ prices due to the imposition of a
carbon tariff.
Equation (4) is our formula for generating the shifts in export demand required as input to
the VURM simulations of carbon tariff effects. 2019 data for export shares come from the
Australian Bureau of Statistics. Shares for EU, G7+S.Korea and China are given in the first
three columns of Table 3. The remaining columns of Table 3 are values for the shifts in export
demand calculated using (4) for each of the three settings of r, using values for tr(c) given in
Table 2. Note that an adjustment is made to remove the approximation arising from second-
order effects not included in equation (2).27 MARKETS ARE MOVING:
THE ECONOMIC COSTS OF AUSTRALIA'S CLIMATE INACTION
Appendix C: Estimated
changes in real value added
and employment by industry
Table 6: Projected changes ($m, 2021 prices) in Australian Real Value Added.
Product EU G7+S.Korea China
1. Sheep and cattle (live) 33.5 139.1 148.7
2. Grains 24.6 102.0 109.1
3. Dairy cattle and raw milk 5.3 22.1 23.6
4. Other crops 24.2 100.5 106.8
5. Other agricultural products 11.4 47.6 50.9
6. Fishing products 3.1 12.9 13.7
7. Forestry and logging 3.2 13.8 14.6
8. Agricultural services 7.0 28.9 31.0
9. Coal mining -790.4 -3,317.6 -3,781.7
10. Oil mining 50.5 208.5 224.0
11. Gas mining and LNG 107.8 339.1 99.3
12. Iron ore mining 388.3 1,598.7 1,715.0
13. Other non-ferrous metal ores 78.6 335.5 471.8
14. Non-metallic mining products 6.6 27.8 29.9
15. Mining services -161.5 -689.2 -799.1
16. Meat products 24.9 103.6 110.5
17. Dairy products 5.5 23.0 24.5
18. Sugar (refined and raw) 5.6 23.2 24.7
19. Other food products 23.0 95.4 101.3
20. Drink (and tobacco) products 11.8 48.7 51.6
21. Textiles, clothing and footwear 18.5 76.7 81.7
22. Wood products 6.6 26.7 27.5
23. Paper products 5.9 25.5 27.5
24. Refined oil products 14.1 56.9 62.8
25. Basic chemicals, plastics, etc. 4.9 148.8 184.4
26. Non-metallic building product 7.7 41.5 44.5
27. Iron and steel -2.1 -15.0 27.7
28. Alumina refining 12.1 49.2 53.6
29. Aluminium smelting 6.8 -32.5 34.0
30. Fabricated metallic products -34.0 -118.8 155.5
31. Motor vehicles and parts 23.7 97.6 103.5
32. Other transport equipment 3.3 12.3 8.6
33. Other manufacturing 52.3 211.5 222.5
34. Other industries -404.2 -1,792.7 -2,254.7APPENDIX C: 28
ESTIMATED CHANGES IN REAL VALUE ADDED AND EMPLOYMENT BY INDUSTRY
Table 7: Projected changes (‘000 jobs) in Australian Employment.
Product EU G7+S.Korea China
1. Sheep and cattle (live) 0.6 2.3 2.5
2. Grains 0.2 0.7 0.8
3. Dairy cattle and raw milk 0.1 0.4 0.4
4. Other crops 0.2 0.9 1.0
5. Other agricultural products 0.1 0.4 0.4
6. Fishing products 0.0 0.1 0.1
7. Forestry and logging 0.0 0.1 0.1
8. Agricultural services 0.1 0.3 0.3
9. Coal mining -3.1 -12.9 -14.7
10. Oil mining 0.1 0.4 0.4
11. Gas mining and LNG 0.3 0.9 0.3
12. Iron ore mining 0.5 2.0 2.2
13. Other non-ferrous metal ores 0.4 1.5 2.1
14. Non-metallic mining products 0.1 0.2 0.2
15. Mining services -1.0 -4.5 -5.2
16. Meat products 0.3 1.0 1.1
17. Dairy products 0.0 0.2 0.2
18. Sugar (refined and raw) 0.1 0.2 0.2
19. Other food products 0.3 1.1 1.2
20. Drink (and tobacco) products 0.1 0.5 0.5
21. Textiles, clothing and footwear 0.3 1.4 1.5
22. Wood products 0.1 0.2 0.2
23. Paper products 0.1 0.4 0.5
24. Refined oil products 0.0 0.1 0.1
25. Basic chemicals, plastics, etc. 0.1 1.5 1.8
26. Non-metallic building product 0.0 0.1 0.1
27. Iron and steel 0.0 -0.1 0.2
28. Alumina refining 0.2 0.9 1.0
29. Aluminium smelting 0.0 0.0 0.0
30. Fabricated metallic products -0.2 -0.5 0.8
31. Motor vehicles and parts 0.3 1.2 1.3
32. Other transport equipment 0.0 0.1 0.1
33. Other manufacturing 0.7 2.9 3.1
34. Other industries -1.7 -6.8 -8.429 MARKETS ARE MOVING:
THE ECONOMIC COSTS OF AUSTRALIA'S CLIMATE INACTION
References
Australian Business Roundtable (2021) Special report: DFAT (Department of Foreign Affairs and Trade) (2021)
Update to the economic costs of natural disasters in Trade statistical pivot tables. Australian Government.
Australia. An Australian Business Roundtable for Disaster Accessed at https://www.dfat.gov.au/about-us/
Resilience & Safer Communities commissioned report publications/trade-statistical-pivot-tables.
by Deloitte Access Economics. Accessed at http://
European Commission (2020) EU Green Deal (carbon
australianbusinessroundtable.com.au/our-research.
border adjustment mechanism). Accessed at https://
Black R, Cullen K, Fay B, Hale T, Lang J, Mahmood S, and ec.europa.eu/info/law/better-regulation/have-your-
Smith S (2021) Taking Stock: A global assessment of net say/initiatives/12228-EU-Green-Deal-carbon-border-
zero targets, Energy & Climate Intelligence Unit and Oxford adjustment-mechanism-_en.
net zero. Accessed at https://www.socsci.ox.ac.uk/article/
European Commission (2021) Carbon Border Adjustment
net-zero-pledges-go-global-now-action-needs-to-follow-
Mechanism: Questions and Answers. 14 July 2021.
words-oxford-eciu-report.
Accessed at https://ec.europa.eu/commission/presscorner/
BZE (Beyond Zero Emissions) (2021) Export Powerhouse: detail/en/qanda_21_3661.
Australia’s $333 billion opportunity. Accessed at https://bze.
Gaspar V and Parry I (2021) A Proposal to Scale Up Global
org.au/research_release/export-powerhouse/.
Carbon Pricing. IMFBlog, 18 June 2021. Accessed at https://
Canadian Institute for Climate Choices (2020) Tip of the blogs.imf.org/2021/06/18/a-proposal-to-scale-up-global-
iceberg Navigating the known and unknown costs of carbon-pricing/.
climate change for Canada. December 2020. Accessed at
IPCC (Intergovernmental Panel on Climate Change)
https://climatechoices.ca/wp-content/uploads/2020/12/
(2021) Climate Change 2021: The Physical Science Basis.
Tip-of-the-Iceberg-_-CoCC_-Institute_-Full.pdf.
Contribution of Working Group I to the Sixth Assessment
Cision Canada (2021) Government of Canada and Cement Report of the Intergovernmental Panel on Climate Change.
Association of Canada announce partnership to advance
Jordans F (2021) Kerry says US examining carbon border
global leadership in low-carbon concrete production.
tax, sees risks. AP News, 19 May 2021. Accessed at https://
News provided by Innovation, Science and Economic
apnews.com/article/europe-environment-and-nature-
Development Canada, 31 May 2021. Accessed at https://
business-government-and-politics-6a020cd7bb93a639e74
www.newswire.ca/news-releases/government-of-
45cf4999276a2.
canada-and-cement-association-of-canada-announce-
partnership-to-advance-global-leadership-in-low-carbon- King G, Volz U, Murinde V, and Ayas S (2021) The impact
concrete-production-853485782.html. of climate vulnerability on firms’ cost of capital and
access to finance. World Development, Volume 137,
Climate Council (2021) Hitting home: the compounding
January 2021, 105131. Accessed at https://doi.org/10.1016/j.
impact of climate inaction. Accessed at https://www.
worlddev.2020.105131.
climatecouncil.org.au/resources/hitting-home-
compounding-costs-climate-inaction/. kMatrix (kMatrix Data Services Limited) (2021) United
Kingdom: Low Carbon Environmental Goods and Services
Commonwealth of Australia (2021) The Hon Josh
- “Where we were, where we are, and where we’re going”.
Frydenberg MP, Treasurer, Capital markets and the
May 2021. Accessed at kMatrix_LCEGS_UK_2007_08_
transition to a low emissions future, Australian
to_2020_21_with_forecast_2025_26_final.pdf.
Industry Group Speech. 24 September 2021. Melbourne.
Accessed at https://joshfrydenberg.com.au/wp-content/ Kompas, T., Pham, V. H., and Che, T. N. (2018) The effects
uploads/2021/09/Treasurer-Speech-Capital-markets-and- of climate change on GDP by country and the global
the-transition-to-a-low-emissions-future-Australian- economic gains from complying with the Paris Climate
Industry-Group-24-September-2021.pdf. Accord. Earth’s Future, 6, 1153–1173. Accessed at https://doi.
org/10.1029/2018EF000922.
Deloitte Access Economics (2020) A new choice, Australia’s
climate for growth. November 2020. Accessed at https:// McKenzie J, Lloyd A, Lloyd O, and White M (2021)
www2.deloitte.com/content/dam/Deloitte/au/Documents/ EU carbon tariffs on the horizon – what Australian
Economics/deloitte-au-dae-new-choice-climate- trading businesses need to know. Allens, 28 April 2021.
growth-051120.pdf. Accessed at https://www.allens.com.au/insights-news/
insights/2021/04/eu-carbon-tariffs-on-the-horizon-what-
de Orte Júlvez I (2021) EU Carbon Border Adjustment
australian-trading-businesses-need-to-know/.
Mechanism Compliance With WTO Rules. Analysis,
Australian Institute of International Affairs. 13 August OECD (Organisation for Economic Co-operation and
2021. Accessed at https://www.internationalaffairs.org. Development) (2016) Effective Carbon Rates: Pricing
au/australianoutlook/eu-carbon-border-adjustment- CO2 through Taxes and Emissions Trading Systems,
mechanism-compliance-with-wto-rules/. OECD Publishing, Paris. Accessed at https://doi.
org/10.1787/9789264260115-en.You can also read