BYU ScholarsArchive Brigham Young University
←
→
Page content transcription
If your browser does not render page correctly, please read the page content below
Brigham Young University
 BYU ScholarsArchive

Theses and Dissertations

2020-08-11

Gas Chromatography Micro-Chip with High Temperature Interface
and Silk Screen Heaters
Carlos R. Vilorio
Brigham Young University

Follow this and additional works at: https://scholarsarchive.byu.edu/etd

 Part of the Engineering Commons

BYU ScholarsArchive Citation
Vilorio, Carlos R., "Gas Chromatography Micro-Chip with High Temperature Interface and Silk Screen
Heaters" (2020). Theses and Dissertations. 8690.
https://scholarsarchive.byu.edu/etd/8690

This Thesis is brought to you for free and open access by BYU ScholarsArchive. It has been accepted for inclusion
in Theses and Dissertations by an authorized administrator of BYU ScholarsArchive. For more information, please
contact scholarsarchive@byu.edu, ellen_amatangelo@byu.edu.
Gas Chromatography Micro-Chip with

 High Temperature Interface and

 Silk Screen Heaters

 Carlos R. Vilorio

 A thesis submitted to the faculty of
 Brigham Young University
in partial fulfillment of the requirements for the degree of

 Master of Science

 Aaron Hawkins, Chair
 Stephen Schultz
 Brian D. Jensen

 Department of Electrical and Computer Engineering

 Brigham Young University

 Copyright © 2020 Carlos R. Vilorio

 All Rights Reserved
ABSTRACT

 Gas Chromatography Micro-Chip with
 High Temperature Interface and
 Silk Screen Heaters

 Carlos R. Vilorio
 Department of Electrical and Computer Engineering, BYU
 Master of Science

 There has been substantial market demand for a portable Gas Chromatography (GC)
system. Throughout the years, much progress has been made on fabricating a micro system that
works as well as a benchtop system. Unfortunately, even though many substrates, channel types,
channel widths, temperature control systems, and interface solutions have been attempted,
existing versions of the micro-GC still fall short of the ideal. This thesis presents the design,
fabrication, and testing of a silicon based micro-GC column that presents a solution for
interfacing and heating of the chip. A polyimide resin is used to create a durable high
temperature low thermal mass interface with the chip, while a silk screen method is
demonstrated for easy printing of heaters. Chromatogram results are shown in both Temperature
Program and Thermal Gradient runs.

Keywords: gas chromatography, thermal gradient gas chromatography, micro-gas
chromatography, interfacing with gas chromatography, heaters on gas chromatography.
ACKNOWLEDGEMENTS
 In order to be brief I will only mention a few individuals who helped me in completing

this thesis. I would first like to thank Dr. Hawkins for having faith in me when he hired me as his

research assistant as a sophomore. With his help I have been involved in many projects and

publications. He has been a great friend, mentor, and professor to me. I would also like to thank

Abhijit Ghosh for all the hard work he did in all the research with which we were involved. He

was very patient in teaching me all that I needed to know. I could not have done it without him. I

am also very grateful for all the IMMERSE students throughout the years that worked beside me.

I am also grateful for Perkin Elmer and the funding they provided. Lastly, I am grateful to my

wife for being so patient with me as I tried to finish writing. I thank her for helping me in editing

my thesis.
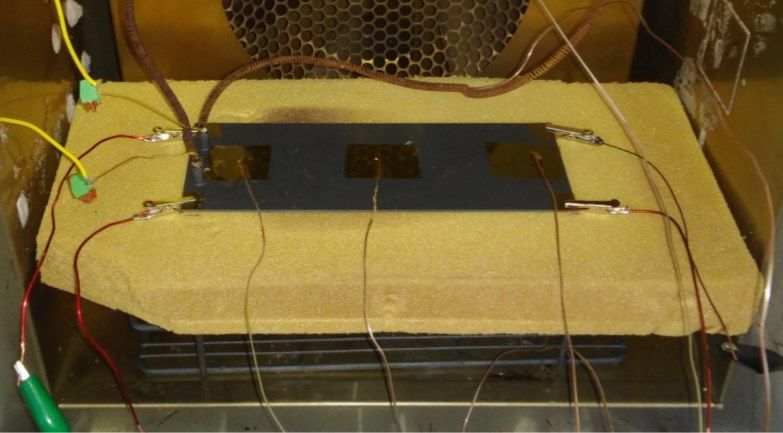
TABLE OF CONTENTS
ABSTRACT .............................................................................................................................. ii
TABLE OF CONTENTS .......................................................................................................... iv
 LIST OF FIGURES ............................................................................................................... vi
1 Introduction .........................................................................................................................1
 1.1 How Gas Chromatography Works .................................................................................1
 1.1.1 Brief History of Gas Chromatography ....................................................................2
 1.2 Summary of Advancement’s toward a micro-GC. .........................................................4
 1.2.1 GC Columns ..........................................................................................................5
 1.2.2 GC Interfacing .......................................................................................................7
 1.2.3 Temperature Control ..............................................................................................7
 1.2.4 Stationary Phase.....................................................................................................8
 1.3 Our Solution .................................................................................................................8
2 Thermal Gradient................................................................................................................ 10
 2.1 Isothermal and Temperature Programmed GC runs ..................................................... 10
 2.2 Thermal Gradient—Third Heating Method ................................................................. 10
 2.3 How it has progressed and what others have done ....................................................... 13
 2.4 Our Heating Innovation............................................................................................... 15
3 Micro-fabrication ............................................................................................................... 16
 3.1 Introduction to Micro-Fabrication ............................................................................... 16
 3.2 Fabrication Steps......................................................................................................... 16
 3.3 Design Benefits ........................................................................................................... 20
4 Post processing .................................................................................................................. 21
 4.1 Introduction ................................................................................................................ 21
 4.2 Designing the Heaters ................................................................................................. 21
 4.2.1 Silk Screening the Heaters ................................................................................... 22
 4.2.2 Silk Screen Testing .............................................................................................. 26
 4.3 Capillary Interfacing ................................................................................................... 27
 4.3.1 Applying Polyimide ............................................................................................. 27
 4.4 Static Coating ............................................................................................................. 30
5 Results ............................................................................................................................... 31
 5.1 Introduction ................................................................................................................ 31

 iv
5.2 Theoretical Plates, Resolution, Asymmetric Value ...................................................... 31
 5.3 Testing Setup .............................................................................................................. 34
 5.4 N-Alkane results ......................................................................................................... 36
 5.5 Diesel and Essential Oil .............................................................................................. 40
 5.6 Stainless Steel Microchip ............................................................................................ 41
 5.7 Conclusion .................................................................................................................. 44
6 References ......................................................................................................................... 46

 v
LIST OF FIGURES

Figure 1-1: Chromatogram of standard mixture of n-Alkanes ......................................................2
Figure 1-2 Benchtop GC .............................................................................................................3
Figure 1-3 Six Column GC on Curiosity Rover ..........................................................................4
Figure 1-4 Basic Components that make up a benchtop GC.........................................................5
Figure 1-5 Commonly used substrates and column Types............................................................6
Figure 1-6 Reported column lengths ...........................................................................................9
Figure 2-1 Example TGGC ....................................................................................................... 11
Figure 2-2 How TGGC works. .................................................................................................. 12
Figure 2-3 SAM image of Anzi's ............................................................................................... 13
Figure 2-4 Ghosh’s 5.9 column design. ..................................................................................... 14
Figure 3-1 Images of inlet/outlet ............................................................................................... 17
Figure 3-2 Sinusoidal Serpentine Channels ............................................................................... 18
Figure 3-3 Full CAD drawing of column ................................................................................... 19
Figure 4-1 Silk screen heater mask. ........................................................................................... 23
Figure 4-2 Elevating the silk screen mask .................................................................................. 24
Figure 4-3 Completed micro-GC colmn .................................................................................... 25
Figure 4-4 IR images of micro-GC column ............................................................................... 26
Figure 4-5 Polyimide application on capillary ........................................................................... 28
Figure 4-6 Capillary inserted into inlet/outlet ............................................................................ 29
Figure 4-7 Finished capillary insertion ...................................................................................... 29
Figure 5-1 Thermal couples of back of micro-chip .................................................................... 35
Figure 5-2 Temperature program chromatogram of C8-C20 ...................................................... 37
Figure 5-3 Thermal gradient chromatogram of C8-C20 ............................................................. 38
Figure 5-4 Thermal gradient chromatogram of C8-C30 ............................................................. 39
Figure 5-5 Thermal Gradient Chromatogram Diesel/Lavendar .................................................. 40
Figure 5-6 Stainless steel microchip .......................................................................................... 42
Figure 5-7 Stainless steel microchip setup and results................................................................ 43

 vi
1 INTRODUCTION

1.1 How Gas Chromatography Works

 Chromatography is a set of laboratory techniques used for the separation of mixtures [1].

The laboratory techniques involve chromatographic instruments, the main component of which is

the separation device, e.g. column, planar surface, etc. Using a column is the most popular and

can be described as a tube that is packed with porous material or that has had its inner walls

coated [2]. The porous material or coating is known as the stationary phase. The stationary

phase’s differing interactions with the analytes within the test mixtures is what causes the

separation. However, in order to pass the test mixture through the column and to the detector, a

chromatograph uses a mobile phase. The mobile phase is the substance that pushes the test

mixture through the separation device. As the stationary phase and mobile phase work together,

the separation device ensures the analytes reach the detector at different times. As the detector

registers these analytes it is able to create a response as a function of elution time. For example,

in chemical analysis a small sample is injected into the column and the detector produces a series

of peaks [3], as seen in Figure 1-1. These peaks represent the analytes as they eluted from the

column.

 Chromatographic methods can be classified by the type of separation device, mobile

phase, or even stationary phase that is used [3]. This thesis will deal with an open channel gas

chromatography device. In other words, the column is as described above - a tube that has had its

 1
inner walls coated. The coating on the inner walls is the stationary phase and gas is the mobile

phase.

 Figure 1-1: Chromatogram of standard mixture of n-Alkanes on 15 m column [4]

 1.1.1 Brief History of Gas Chromatography

 The invention of Gas Chromatography (GC) can be traced back to 1952 with a

publication by A.T. James and A.J.P. Martin [5]. Before 1952, industry was using charcoal in

columns to act as adsorbents or as the stationary phase for analysis of hydrocarbons and esters

[6]. In their paper, James and Martin describe how they were able to use 4 ft. and 11 ft. columns

to separate volatile fatty acids. The columns used nitrogen gas as the mobile phase and had a

stationary phase of silicone stearic acid. This great achievement is recognized by many as the

birth of GC.

 2
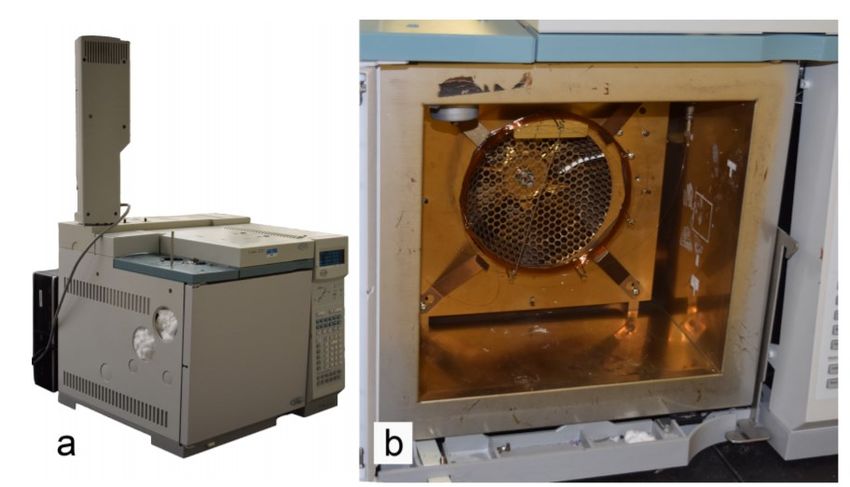
Since 1952, advancements in column technology, pneumatic systems, detection, and

many other systems have brought GC to what it is today. Originally, GC separation was done on

packed columns, but they were restricted by their length. The invention of capillary columns in

1957 eliminated this restriction and boosted the separation efficiency, reduced the working

temperatures, and reduced the separation times [5]. Different materials were used in creating the

capillary columns, and because of its chemical inertness, glass made the best columns [5]. Yet,

glass had some issues, including its fragileness. Luckily in 1979, fused silica columns covered in

a protective layer of polyimide began to be manufactured. Their invention fixed many of the

earlier problems. As GC evolved, so did the need for increased controllers. Today we are able to

monitor the gas flow, pressure, and have constant feedback. With these advancements also came

better detectors, starting with the thermal conductivity detector called a katharometer to the most

commonly used detector today called a flame ionisation detector or FID. All of this progress

gives us what we have today - a benchtop GC as seen in Figure 1-2.

 Figure 1-2: a. Benchtop GC; b. Oven on benchtop GC where the column sits [7]

 3
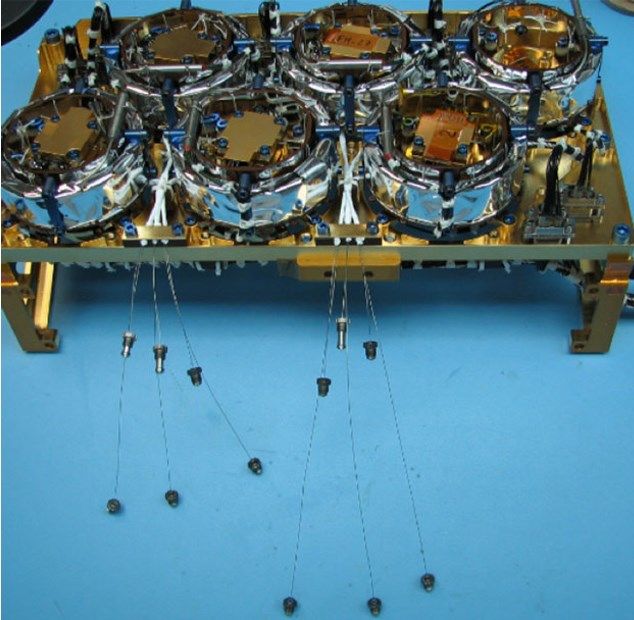
1.2 Summary of Advancement’s toward a micro-GC.

 Today’s benchtop GC give nice narrow symmetrical peaks, and are therefore used in

many industries. They can be found in pharmaceuticals, biomedical testing, drug testing,

petrochemical analysis [8], and even space exploration. Currently, the Curiosity Rover has a six

column GC that along with other instruments helps in searching for elements that would make

Mars habitable (refer to Figure 1-3) [9]. However, even though benchtop GC’s give great results,

they are large and bulky and therefore not ideal for onsite use. Samples can be brought into the

lab, but they are at risk of contamination, degradation, decomposition or even of being lost [10].

The fabrication of micro-GC’s would allow for better, more portable analysis. In the last two

decades, much research has been done to try and fabricate a micro-GC.

 Figure 1-3: Six Column GC on Curiosity Rover [9]

 At a high level, a benchtop GC is composed of an injector, a column, and a detector as

shown in Figure 1-4. As described in an earlier paragraph, the ultimate goal is to make a

complete micro total analysis system (uTAS) that has robust injector, column, detector, and

heater. But because the separation and grouping happens in the column, it is the most important

 4
part of the GC, and therefore the most researched when attempting to fabricate a micro-GC.

Once the column is perfected, advancements in the injector and detector will also be needed.

Some research is also being performed in those areas. The following paragraphs give brief

summaries of what some of the research has been.

 Figure 1-4: Basic Components that make up a benchtop GC [11]

 1.2.1 GC Columns

 Many materials are used to make micro-GC columns such as silicon, glass, ceramic,

metal, or polymer [12]. Silicon is the most popular substrate, and advancements in

micromachining processes commonly used to fabricate electronics can be easily transferred to

fabricating micro-GC columns. Silicon’s properties also make it advantageous to making

columns. It can handle high temperatures, has low thermal mass, and has good surface chemistry.

Glass is sometimes used together with silicon to make columns by anodic bonding. However, a

 5
thermal mismatch can occur with silicon glass columns. Therefore, some researchers turned to

metal to make columns [13]. Figure 1-5A shows us how often these substrates are used [12].

 Figure 1-5B shows the most common geometries for columns used on silicon, glass,

ceramic, metal, or polymer [12]. With silicon, you can achieve V-grooved profiles or vertical

walls. An example of a silicon geometry is the pillar array, a column with post in the channel to

increase surface interaction of the mobile phase to stationary phase. Pillar array columns were

reported to increase sample capacity, have more uniform column structure and mobile phase

velocity profile, and improved efficiency compared to other geometries [12].

 Different channel layouts are also researched: circular spiral, square spiral, rectangular

spiral, serpentine, zigzag/corrugated, radiator, and wavy. Different column layouts are

advantageous for different reasons. Radadia [14] conducted experiments on the serpentine,

spiral, and square layouts and determined that the serpentine column generated better separation.

Qin and Gianchandani [15] also determined that a serpentine gives a more uniform pressure

distribution over spiral. Yuan [16] determined that wavy over serpentine channels can “narrow

flow distribution” thereby improving separation.

Figure 1-5: Commonly used micro-fabricated (A) column material and (B) column types
for GC [12]

 6
1.2.2 GC Interfacing

 Interfacing to the microchip is extremely important. Without a leak free and robust

interface, the mixture would not be able to be injected into the column and obviously not be able

to be detected. A variety of different interface solutions have been attempted including epoxies,

fittings, adhesive based structure, soldering, and others [12]. Currently, the most popular solution

used is some form of adhesive. Adhesives are commonly used because they can be easy to apply

and cheap. The issue with adhesives is their limited temperature range. In order for a GC to be

able to detect semi-volatile compounds, it must be able to reach temperatures above 300 C, and

not many adhesives reach that temperature. Adhesives can also be difficult because they can

cause clogging during application or leaks after several temperature cycles. Due to this, many

have tried custom fittings and manifolds [12]. But even though custom fittings and manifolds

have allowed for more robust interfacing and for higher working temperatures [17] [18], they

come at a price. They can be difficult to mount to the column, expensive, or even create

additional thermal mass. Ideally, when it comes to interfacing with the column, you want a cheap

solution that is easy to apply and creates no additional thermal mass or dead volume.

 1.2.3 Temperature Control

 As temperature is an important aspect of GC much of the micro-GC research is focused

in this area too. Bench top GCs have large ovens (convection ovens) where the columns sit that

allows for different types of temperature runs. Unfortunately, convection ovens have a large

thermal mass; therefore, they take a lot of power and time to heat up. Ideally, you would want a

heating source for the micro-GC that is small (so it can be portable), has low thermal mass, low

power consumption, and is easy to affix to the column. Currently, once the column is fabricated,

many will replace the column of a benchtop GC with the micro-fabricated column to be able to

 7
use the oven for testing. Others have created innovative ways to heat the chip. Some are using

resistive heaters, deposition of films that are patterned into heaters, sputtering of material to

create heaters, etc [12]. Eventually, being able to create heaters that are part of the chip is an

important step to making GC’s portable.

 1.2.4 Stationary Phase

 Even though we are miniaturizing the column, similar stationary phases of benchtop GC

columns are used in micro-GC columns. Most research uses non-polar stationary phases like

dimethylpolysiloxane (PDMS) [19]. Many different methods have been used to coat the

stationary phase, but the most popular for open tubular columns are static and dynamic coating

[8]. Deposition of material onto the column is also attempted to coat, but they limit the working

temperature of the wafer after it is done [12].

1.3 Our Solution

 Different column geometries and layouts are still being researched to find an optimal

solution. There are many issues with interfacing with the column and having good heaters. Plus,

there are many problems that become apparent on the chromatogram as we try to miniaturize the

column. Non cylindrical column geometries on micro-GC’s causes the stationary phase to pool

on the corners. The non-uniformity of the stationary phase causes less symmetrical peaks. Also,

most micro-GCs create dead volumes when trying to interface with the column; this mismatch

creates band broadening. Additionally, benchtop GC’s have column lengths ranging from 15 - 30

meters, but micro-GC’s column lengths are typically 1-3 meters, with the longest reported

column being 15 meters as reported by Ghosh [12] in Figure 1-6. These shorter columns reduce

the separation efficiency.

 8
Interfacing problems, no solution to a good heater, non-cylindrical columns, dead

volumes, and shorter column length are all issues introduced when making the column smaller.

This thesis deals with the design, fabrication, and testing of a silicon based micro-GC column

that presents a solution for interfacing and heating of the chip. We show how we used polyimide

to create a durable high-temperature, low thermal mass interface with the chip. Also, we present

an easy way to print heaters on the columns, using a silk screening method that is simple and

adds negligible thermal mass. Additionally, we show how the silk screen heaters can be used to

create a thermal gradient across the chip to give us better peak resolution.

 Figure 1-6: Reported column lengths for micro-GC [10]

 9
2 THERMAL GRADIENT

2.1 Isothermal and Temperature Programmed GC runs

 In GC, two heating methods are typically utilized: Isothermal heating (ITGC) or

Temperature Programed heating (TPGC). In ITGC, the temperature across the column is kept

constant throughout the separation run, being raised to the highest temperature necessary to elute

all the analytes. The issue with ITGC is that even though the first eluting peaks are narrow, the

late peaks get broader. The broader peaks limit a GC’s detection resolution. To avoid this

problem, TPGC is used. Different from ITGC, TPGC is started at a low temperature and ramped

up to the temperature necessary to elute all the analytes during the run. It is advantageous over

ITGC because it reduces the runtime, the temperature ramp rate can be changed, and the late

eluting peaks are narrower. Unfortunately, these advantages all come at the cost of TPGC not

being able to separate as many peaks as ITGC can [20].

2.2 Thermal Gradient—Third Heating Method

 As discussed in the introduction, when you try to miniaturize the GC column, many issues

are introduced. But a third method of heating, introduced by Zhukhovitskii in 1951 [21], has

proven to be able to help reduce the effects caused by those issues, as shown in Figure 2-7. This

method, called Thermal Gradient Gas Chromatography (TGGC), is done by creating a negative

temperature gradient across the column. In Figure 2-7, you can see the dramatic decrease in peak

tailing.

 10
Figure 2-1: Improvement in peak shape improves detection resolution [22]

 In TGGC, when the mixture is inserted into the injector, all the analytes are immediately

vaporized because the injector is kept at a temperature higher than the boiling points of the

analytes. As they begin to travel through the column, the mixture as a whole begins to feel the

negative temperature gradient (see Figure 2-2A). Each analyte reaches a stop temperature where

it begins to slow down because it is absorbed into the stationary phase. The temperature is

eventually raised to continue the flow of the analytes, but the gradient is kept. In this method, the

temperature gradient not only separates but also focuses the peaks. Looking at an analyte as it

travels down the column (as illustrated in Figure 2-2), you’ll notice that the front end of the bulk

is in a colder region, causing it to slow down. Meanwhile, the back end of the bulk is in a

warmer region, causing it to speed up. This small differential in temperature causes a focusing of

the peak. Ghosh [18] showed that an exponential gradient across the column provides the best

peak focusing and separation. The section where the gradient has the steepest slope provides the

best peak focusing, and as the gradient slope decreases, it provides the best separation with peak

broadening because it begins to mimic ITGC runs.

 11
A.

 B.
Figure 2-2: A. Negative Thermal Gradient along column [23] B. v represents velocity and
due to the negative gradient is slower than causing focusing of the peaks [22].

 12
2.3 How it has progressed and what others have done

 Since Zhukhoviskii, some research has been done in attempting to create a thermal

gradient across the column. Our research group at BYU in 2014, under the direction of Anzi

Wang, reported the fabrication of a 1.4 m serpentine column on silicon. His serpentine design

can be seen in Figure 2-3. Fused silica capillaries were used to act as the inlet and outlet ports.

The capillaries were attached to the chip using epoxy. Wang tested the chip both in TPGC and

TGGC. For the TPGC, a silicone rubber heater was set under the silicon chip. For TGGC, two

cartridge heaters were placed on the inlet side of the chip, and the outlet was cooled by air flow

to create the gradient. He concluded that TGGC focused wide injection bands, reduced peak

tailing, and improved resolution [24]. Unfortunately, the column was only tested up to 180 C due

to the temperature limit of the epoxy. Other disadvantages include the column length, the

cartridge heater additional thermal mass, and the silicone rubber heater was difficult to adhere to

the column and lacked uniformity.

Figure 2-3: SAM image of Anzi's design (top) and drawing of design to show serpentine
pattern (bottom) [24].

 13
To continue on Wang’s work, in 2017 our group, under Abhijit Ghosh, reported the

fabrication of a 5.9 m serpentine column on silicon—as seen in Figure 2-4. The goal was to

create a GC column that would work at high temperature. To accomplish this goal, a fixture with

a low thermal expansion coefficient was made to interface with the inlet and outlet of the chip.

The fixture also acted as a heater for the front end of the column, and helps create the thermal

gradient. In order to elute all the analytes being tested, the end of the column needed to be raised

to 275 C. To do so, the fixture was raised to 375 C to allow the heat to diffuse to the end of the

column. This allowed the end of the column to heat to 275 C and create the gradient.

Unfortunately, raising the chip to this temperature caused stationary phase bleeding, which

results in an elevated baseline. To eliminate this problem, a secondary heater was added. The

secondary heater made it so that the fixture did not have to be raised above 300 C. Ghosh’s chip

supported Wang in his conclusion that TGGC can reduce some of the bad effects that are caused

by miniaturizing the column. He reported that resolution was better for TGGC than TPGC, peak

tailing was less, and the peaks were more symmetrical [18]. But Ghosh’s design improved on

Wang’s because it allowed for working temperatures of 375 C and it increased the column length

to 5.9 m.

Figure 2-4: 5.9 meter microchip with fixture as primary heater and a mica heater as
secondary [18].

 14
2.4 Our Heating Innovation

 Even though fixture design was an improvement, advancements can be made. The fixture

added a lot of thermal mass to the chip, all its tiny pieces made it extremely complicated to

secure to the column, and if it was not properly aligned or evenly tightened, it could break the

column during setup. Additionally, having a mica heater as a secondary heater made things more

complicated. In order to attach the mica heater to the column, a conductive paste had to be used,

and the mica heater did not have uniform heating. We innovated a new heating method by silk

screening heaters to the column with a simple process that adds negligible thermal mass and has

no need for a mica heater. We also used a polyimide resin to interface with the column that

creates a robust, leak-free solution. Chapter 4 explains how we designed and silk screened the

heaters, and chapter 5 explains how we applied the polyimide.

 15
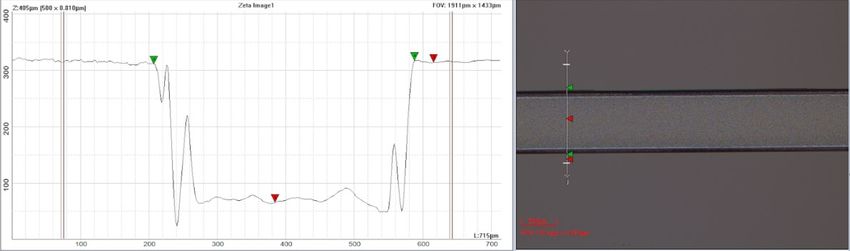
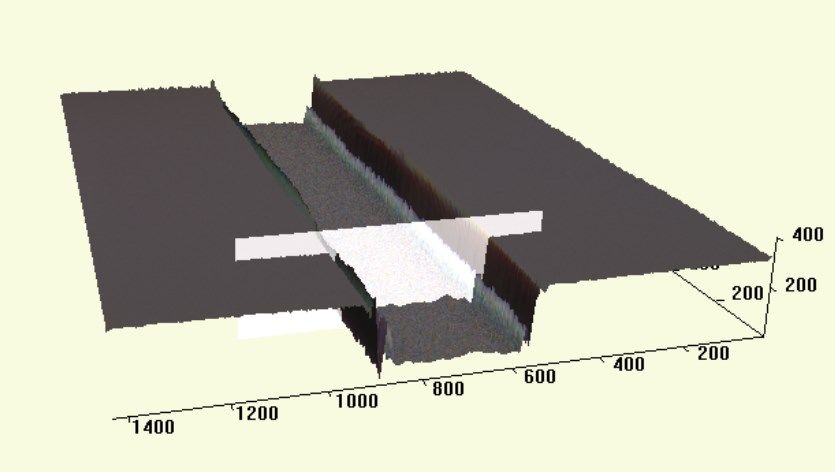
3 MICRO-FABRICATION

3.1 Introduction to Micro-Fabrication

 As shown in Figure 1-5, silicon is the most common substrate for making micro-GC columns.

This chapter describes the fabrication of an open-channel, silicon-based micro column. It

includes explanations on how the column design maximizes the use of a thermal gradient and

describes how the design prevents the polyimide material, used to interface, from clogging the

channels.

 Fabrication began with 4-inch, low-doped, p-type wafers with a crystal orientation of ,

a thickness of 500 µm, and resistivity of 1-10 OHM-CM. The following sections are divided into

the steps taken in fabricating the column and end with an explanation on the design benefits of

each.

3.2 Fabrication Steps

 1. The capillaries, which are used to interface with the column, had an outer diameter of

 240.7 um. Through lithography, with the use of AZ P4620 photoresist, the inlet and outlet

 of the column were etched on the wafer to approximately 240.7 µm deep on a STS ICP

 Etcher. The inlet and outlet channel were designed to taper inward as seen in Figure 3-1-

 A. With a 3D Profilometer by zeta instruments, the inlet/outlet channel are profiled as

 seen in Figure 3-2-B. In Figure 3-1-C. you can see a 3D rendering of the channel.

 16
Figure 3-1 A. Screenshot of inlet/outlet from lithography mask. Zoomed in image shows
that at around 12000 µm the channel begins to taper at .68 degrees until it reaches 240 µm
wide. B. A front and top view of the channel. C. 3-D rendering of channel.

 17
2. After the etching of the inlet and outlet is done, a second mask is aligned to the

 inlet/outlet to create a sinusoidal serpentine channel. With AZ P4620 as the mask, 60 µm

 are etched on the wafer in a STS ICP Etcher to make the channels. Figure 3-2 shows the

 sinusoidal serpentine channel.

Figure 3-2: Sinusoidal serpentine channel are angled at .26 degrees and are 150 µm wide

 3. After the lithography is completed, the wafer is prepped for fusion bonding. To do this,

 600 nm of thermal oxide is grown on the processed wafer and a blank silicon wafer.

 4. Once the oxide has been grown, the two wafers are cleaned by pouring acetone onto the

 surface and scrubbing the surface with q-tips. After scrubbing, IPA and deionized water

 18
are poured onto the surface, in that order, to finish the cleaning. This cleaning is done to

 make sure no particles are on the surface to stop the bond from creating a good seal.

 5. Once the wafers have oxide and have been cleaned, they are brought together and a weak

 bond is created by Van Der Waals forces. To make sure a good seal is created the weak

 bonded wafer is examined under an IR camera. If the column channels are visible and

 clear, a good clean bond has been achieved. If shadows are observed, then the wafers are

 separated and cleaned again until a good, clean, weak bond has been achieved.

 6. After creating the weak bond, the wafers are ready for fusion bonding. They are put into a

 furnace and the temperature is raised to 1100 C to finish the bond.

 7. Once bonded, 6 µm of PECVD oxide is deposited on the top of the wafer.

 8. The silk screen heaters are printed (more details will be discussed in the next chapter).

 9. Finally, the wafer is diced from 3 sides but cleaved from the inlet and outlet end to

 expose the channels. Figure 3-3 shows the full CAD drawing of the column.

Figure 3-3: The yellow represents the wafer outline. The solid red line around the channels
represents where the wafer is diced. The red line between the inlet and outlet represents
where to cleave the bonded chip to allow interface access with the column.

 19
3.3 Design Benefits

 As described by Ghosh, it is desirable to have a robust, leak-free, and small dead volume

interface [12]. In order to interface with the column described above, capillaries are inserted into

the inlet and outlet. To secure and create a leak-free solution, a polyimide resin is applied to the

capillary column interface (application of polyimide will be described in the next chapter). For

that reason, the channels were designed to taper inward (Figure 3-1-A). After being inserted

about 10-12 mm, the taper reaches a point that lodges the capillary in place and ensures the

polyimide is unable to travel around the capillary and clog it. The process includes other

polyimide application steps to prevent clogging that will be described in the next chapter.

 To maximize the use of the thermal gradient, or to increase its effectiveness, a sinusoidal

serpentine column was designed. In Anzi’s design, the column consisted of many parallel

channels experiencing isothermal steps, where the negative gradient only occurs in the

perpendicular turns [20] (Figure 2-3). By angling the column channels, a sinusoidal serpentine

column is created. This allows the analytes to experience the gradient throughout the whole

column and not just at the turns (see Figure 3-2). In the sinusoidal serpentine design, the analytes

travel 311 µm in the length of just one channel compared to 0 µm in a parallel channel design.

 Finally, a centralized column on the chip was fabricated where the edge of the column is

8.1 mm from the end of each side of the chip to avoid cold spots. The silk screen heater did a

good job of creating a uniform thermal gradient through the center of the chip, but uniformity

was reduced closer to the edge. Cold spots can sometimes be the cause of peak tailing [25].

Therefore, the centralized column helps to avoid this. See Figure 3-3.

 20
4 POST PROCESSING

4.1 Introduction

 After completing the micro-fabrication of the column, the bonded chip is ready to have the

heaters printed on it, the capillaries secured to the inlet/outlet, and the column coated. In order to

completely finish the fabrication of the column, those three steps must be completed in that

order. The following chapter will be divided into three subsections explaining the last three steps

in fabrication.

4.2 Designing the Heaters

 Silk screening typically requires a mask with the desired print design, a paste, a squeegee,

and a table. The heaters for this setup were designed on AutoCAD and the CAD file was sent to

Riv Inc. to get the mask professionally done. The paste used was ESL 599-E, a cermet

conductive silver paste made by Electro-Science. And the actual silk screening was done on a

flat, clean table.

 The resistive heaters heat the column similarly to stove top burners, except the heaters are

in a serpentine pattern instead of a coiled pattern. Ideally, the heat flux through both heaters

should be the same as shown in equation 4-1, except one heater, the primary heater (24.8 mm by

64 mm), covers the first ⅓ of the column and the other heater, the secondary heater (51.2 mm by

64 mm), covers ⅔ of the column. Due to the different areas we have different resistances for the

heaters. The heat flux of a heater is defined as power over area.

 21
P1 P2
 = (4 − 1)
 A1 A2

Where 1 and 2 represent the power dissipated by the first and second heater respectively. 1

and 2 are the areas covered by the first and second heater respectively. After some manipulation

and knowing that the applied voltages would be the same for both heaters the resulting equation

follows:

 1
 2 = 1 (4 − 2)
 2

Due to the fact that 1 is half the size of 2 , 1 would be twice the resistance of 2 . The

parameters we had in order to accomplish this were the resistivity of the paste (3 −

6 ℎ ⁄ .), the dimensions of the chip, especially as it is crucial to make sure that the

heaters get as close to the edge of the silicon column. Doing this helps in uniform heating as the

edges of the column tend to be cooler. Some of the variables were the length, thickness of the

trace, and separation in between each of the traces of the heaters. The primary heater’ s

resistance typically ranged from 20 - 28 Ω while the secondary heater’s resistance typically

ranged from 9- 14 Ω.

 4.2.1 Silk Screening the Heaters

 Once the two 500 µm silicon dioxide wafers have been bonded they are 1 mm thick.

Afterwards, we grow PECVD oxide 6 µm thick on the chip to avoid shorting the heater through

the silicon. In order to get the negative gradient, the heaters must be placed in the same

orientation as the flow of the channels. The following steps explain how to print the heaters:

 22
1. Make sure the two-heater, silk-screen mask is clean. To do this, hold the mask up to a

 light and see if there is any conductive paste blocking the openings. If it is dirty, clean the

 mask using the cleaning procedure described in step 9. Repeat until the mask is clean

 enough to be used.

 2. Use a table with a corner edge to be able to align the mask. Place the wafer down on the

 table with the oxide face up and the flat facing right. Place the mask over the wafer and

 against the corner edge with the smaller heater pattern facing toward you. Change the

 position of the wafer until both heater patterns fit entirely on the wafer and are parallel

 with the flat. Tape the wafer down with two pieces of scotch tape, one on the left and one

 on the right.

 Figure 4-1: Picture of mask over-layed with a drawing of mask and heaters.

3. For the best silk-screening results, the back end of the mask must be supported higher

 than the front end. This will allow the mask to peel off of the wafer as you press the

 squeegee toward yourself. To do this, elevate the back two corners of the mask 1.5 mm

 (an easy way to do this is to stack a 0.5 mm thick piece of silicon on top of a 1mm thick

 23
piece) and the front end 1mm (the side with the corner piece for us had a 0.5mm of tape,

 so we just added another 0.5mm thick piece of silicon on top of it. Refer to Figure 4-2).

 Figure 4-2: Elevate the silk screening mask to allow it remove easily

4. Ensure that the table is fixed in place and won’t rotate or pitch downward while silk-

 screening.

5. Fit the mask on the silicon pieces and against the corner piece. Put a line of conductive

 paste (ESL 599-E) on the mask above the big heater pattern, exceeding the width of the

 pattern. Cover the whole pattern on the screen with paste by lifting up the backside of the

 mask (so the paste doesn’t get on the wafer) and, while pressing firmly against the

 mask and pulling toward yourself, squeegee the paste down over the pattern. Lower

 the mask back down over the wafer, making sure to keep it aligned.

6. Pressing down firmly and pulling toward yourself, squeegee the paste through the mask

 and onto the wafer. If you elevated the mask properly, it should peel off of the wafer as

 you go. Be careful not to press too hard during this step as the force can crack the wafer.

 24
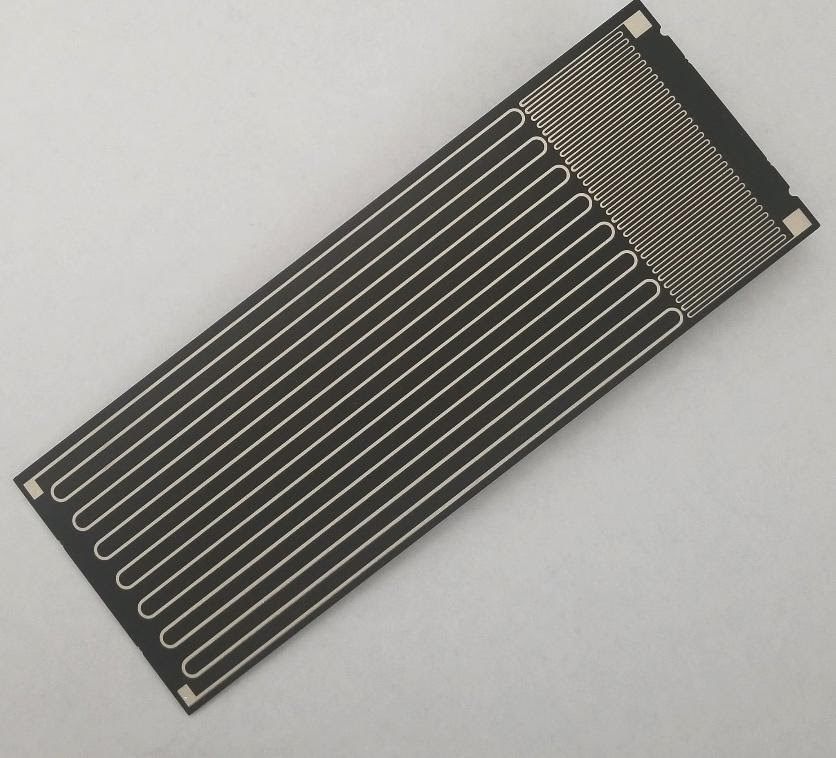
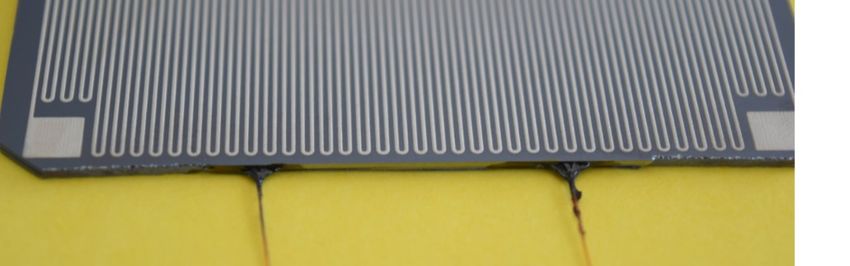
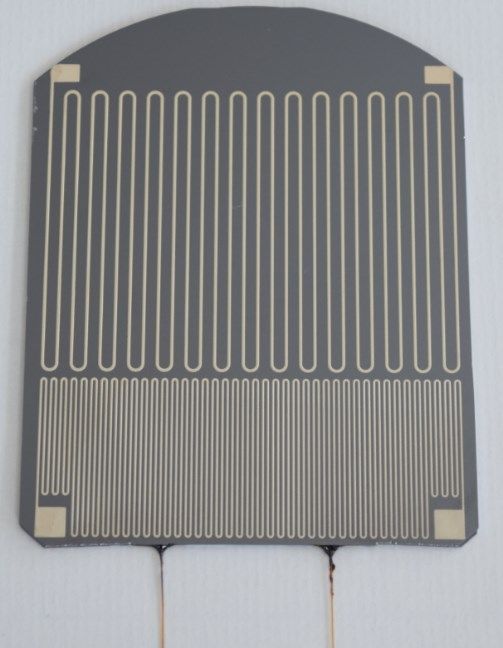
7. Remove the mask and make sure the two heater patterns have no imperfections. If there

 are major imperfections, you will need to clean the wafer and the mask with acetone/IPA

 and restart.

8. The curing process of the conductive paste (ESL 599-E) is as follows: 5 minutes of

 leveling time at room temperature, 10 minutes at 125 C, ramp up to 450 C at the rate of

 60 C/minute, hold at 450 C for 10-12 minutes. Figure 4-3 shows a good finished silk

 screen.

9. Cleaning: Spray the top of the mask with acetone and use cleanroom towels to wipe off

 the excess paste. Turn the mask over and repeat. Repeat this process until you feel that all

 of the paste has been cleaned off. Hold the mask up to a light to be sure. Spray and wipe

 both sides of the mask with IPA and dry off. Clean the squeegee off with IPA and paper

 towels. Don’t use water to clean the mask. It will damage the emulsion.

 Figure 4-3 Completed Column

 25
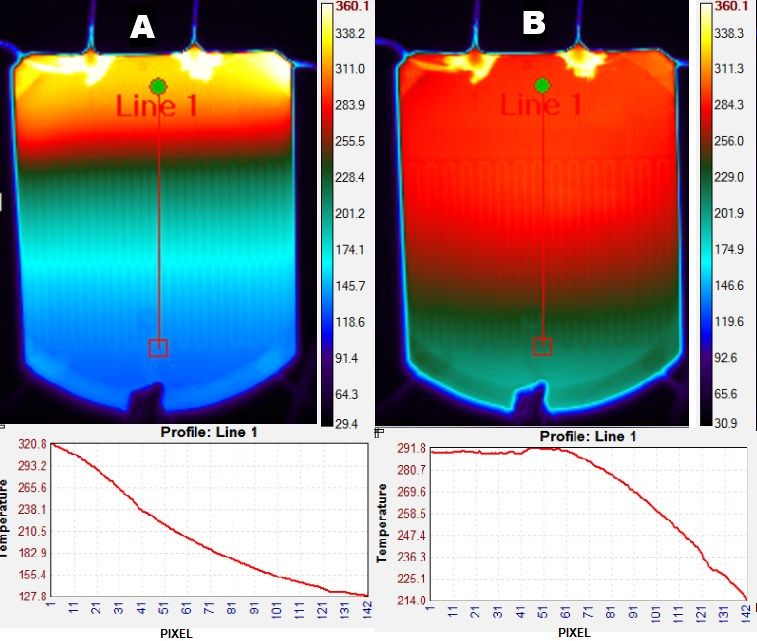
4.2.2 Silk Screen Testing

 As explained in chapter 2, the purpose of the silk screen heaters is to create a thermal

 gradient across the column. The thermal gradient helps in getting rid of the issues

 described in chapter 1 that are caused by micro-fabricating a GC column. The silk screen

 columns were examined under an IR camera to test their gradient. Figure 4-4 shows the

 thermal gradient across the column. It also shows that the silk screen heaters are able to

 create good negative exponential gradients across the column. In addition, Figure 4-4

 demonstrates how a typical TGGC run would work. Step 1 in a TGGC run would be

 creating the gradient as shown in Figure 4-4-A where the making of the thermal gradient in

 step 1 is done completely by the primary heater. In step 2, the secondary heater is turned

 on and the temperature is ramped up as you can see in Figure 4-4-B. As the temperature is

 dissipated throughout the whole column, step 3 is initiated, where the temperature is even

 across the column.

Figure 4-4 A. Negative gradient created across column. Created by primary heater B. The
 column heating up as the secondary heater is turned on.

 26
In conclusion, the silk screen heater does not add any additional thermal mass, creates a

 uniform gradient, essentially takes up no space and is easy to apply. A big step towards

 having a marketable, portable micro-GC.

4.3 Capillary Interfacing

 As described in the introduction many adhesives and fixtures have been used and created

to try to create a leak-free, high-temperature interface, from adhesives, Nanoports [14], Kovar

fittings [26], to stainless steel manifold [17]. Each of these adhesives and fixtures have their own

complexity. An adhesive would be ideal; it is robust, and (if applied properly) can be leak-free,

cheap, and easy to apply. But as previously explained, adhesives, unfortunately, lose viscosity at

high temperatures and can clog the interface. Other interfacing solutions often create dead

volumes [14][26], can have a mismatch in thermal expansion coefficient [17], create more

thermal mass [17][18], and/or be complex to install [18].

 This section deals with the procedure to create a cheap, robust, leak-free interface solution

that is easy to apply and works at high temperature. To do this, a polyimide resin purchased at

Sigma-Aldrich was used. Cagliero [27] also used polyimide resin for interfacing on his micro

column to test essential oils, aromatic plants, and headspace samples. Except, they limited their

temperature to 190 C while the chip in this thesis was tested at higher temperatures.

 4.3.1 Applying Polyimide

 After the column has been silk screened and diced, five simple steps are taken to apply

 the polyimide. For transfer lines, fused silica capillaries with an outer diameter of 240.7

 µm and an inner diameter of 98 µm are used. After cleaving, the inlet and outlet holes are

 27
exposed. Typically, the capillaries can be inserted 10-12 mm before it reaches the point

where the channel’s taper reaches 240 um. Since the polyimide resin is runny it would clog

the capillary if it was applied directly. The fabrication of the tapered inlet and outlet along

with the following steps ensure that it does not clog:

 1. Polyimide resin is applied in ring form onto the capillary about 3-4 mm from the

 end that will be inserted in the inlet/outlet as shown in Figure 4-5. Applying the

 polyimide too close to the end could cause the capillary to break when inserting it

 or to clog when curing the polyimide.

 Figure 4-5 Polyimide show be applied about 3-4 mm from tip.

 2. The capillary with the polyimide ring is moderately cured in front of a heat gun.

 After a couple of minutes, the polyimide ring becomes gummy but still moldable.

 The polyimide being moldable at this state of curing allows it to be inserted into

 the channels and fill the space around the capillary. Its pliable, sticky state stops

 any additional polyimide that will be added at the interface from running in and

 clogging the channels.

 3. The capillary is inserted into the inlet/outlet channels.

 28
Figure 4-6 The inlet and outlet are inserted with the polyimide around the capillary.

 4. Fresh polyimide is cured on a hotplate at 150 C for a couple minutes until it starts

 to become a little viscous. Once viscous, it is applied around the column capillary

 interface. Enough should be applied to cover the interface.

 5. The column is placed in an oven to be cured: The oven is programmed to ramp up

 from 40-340 C. The temperature should increase from 40-300 C at 1 C/min and

 held for 1 minute at 300 C. Finally, the temperature should increase from 300-340

 C at 20 C/min and held at 340 C for 60 minutes.

 Figure 4-7 Finished capillary insertion into inlet/outlet

 A couple finished columns were thermal cycled 200 times up to 350 C and the

 interface was leak free and robust. More than 30 columns have had a successful interface

 that work up to 350 C.

 29
4.4 Static Coating

 As stated in the introduction, static and dynamic coating are the most popular methods for

coating micro-GC columns. Static coating is harder to do but gives a more uniform film [28]. For

that reason, the column described in this thesis is statically coated. The stationary phase solution

contained is .75%, 1% vinyl, 5% phenyl, and 94% methylpolysiloxane and 1% dicumyl peroxide

in n-pentane weight by weight. The column is filled with the solution using a syringe pump and

capped at one end. To ensure that it does not leak from the capped end, the end of the capillary is

dipped into a RTV silicone, and then a silicone GC septum is added. Before vacuuming, the

solution is pressurized under 80 PSI of helium to get rid of any air bubbles [29]. If air bubbles

are present during the vacuuming they could completely eliminate the coating [29]. After doing

this for about an hour the column is hooked up to a vacuum pump for evaporation of the solvent.

While attached to the vacuum pump, the column is submerged in water to maintain a uniform

temperature [18]. After about 2 hours the column is unhooked and uncapped. To ensure that

there is no solution left in the column, helium is flowed through it to push out anything leftover.

To finish coating, the column is cured by heating the column from 40 C – 250 C at 2 C/min and

keeping it at 250 C overnight. Before testing the column, it is conditioned at 350 C overnight, to

get rid of any stationary bleeding during runs.

 30
5 RESULTS

5.1 Introduction

 After the fabrication is complete, the column is ready to be tested. In this chapter, we will

show results for the silicon chip described in this thesis. We will also show the versatility and

functionality of the silk screen heaters which were printed and used successfully on a stainless

steel chip. Finally, we will explain how the results demonstrate the overall good fabrication of

the chip, including the polyimide resin interface.

5.2 Theoretical Plates, Resolution, Asymmetric Value

 A GC’s ability to separate mixtures with good resolution is imperative regardless of

whether it is being used for qualitative or quantitative analysis, as inefficient separation makes

compounds hard to identify or quantify. Inefficiencies can be seen in the imperfections in the

peaks of the chromatograms. Some common imperfections found in chromatograms are ghost

peaks, split peaks, overlapping peaks, and the almost unavoidable imperfection of peak tailing.

These imperfections can happen due to several reasons. For example, bad resolution could be

caused by a non-selective stationary phase, or even wrong temperature program settings. Broad

peaks could be due to a column coated with a too thick stationary phase film [30]. But some

imperfections can be caused due to instrumental issues [31]. For example, peak tailing can be

due to cold spots or dead volume. Therefore, to determine the quality of a GC, the efficiency,

resolution, and the amount of peak tailing are often reported [12].

 31
The first parameter typically reported is efficiency. Efficiency is a measure of peak

broadening and calculated by solving for the number of theoretical plates [32]. The higher the

theoretical plates the more efficient the column is. The following equation is one of many that

can be used to solve for it:

 2
 = 5.545 ( ) (5 − 1)
 ℎ

In Equation 5-1, is the retention time of the peak and ℎ is the peak width at half height. The

equation clearly indicates that the narrower the peak the more efficient the column. The

theoretical plate value is usually reported together with the retention factor (k) which is a

parameter for the amount of time an analyte spends in the stationary phase relative to the time it

spends in the mobile phase [33]. In a summary compiling the last 4 decades of research on

microchip GC, Ghosh [12] reported that the theoretical plates values ranged from 100-55,000

plates per meter, thus insinuating that due to the wide range, the theoretical plate value currently

holds little weight.

 The second parameter typically reported is the resolution. Good resolution is the ultimate

goal of chromatography [33]. A good column that can deliver resolvable compounds to the

detector avoids coeluting peaks. There are many factors that affect resolution. For example, a

film that is too thick could cause too much retention and therefore elute broad peaks; a film that

is too thin could cause too little retention and cause co-eluting peaks. Another example would be

the inner diameter of the column. A smaller inner diameter reduces the volume of the mobile

phase, which could increase the retention factor [33]. Depending on the application, this could

increase or decrease the resolution. A quantitative measure of resolution can be found by the

following equation:

 32
2
 = (5 − 2)
 1 + 2

In equation 5-2, d is the difference in elution time of the 2 peaks. 1 and 2 are the widths of

the peaks at the baseline.

 Finally, the third parameter that is usually reported is one that measures the amount of

peak tailing. In the pharmaceutical industries, a tailing factor is calculated, while in the majority

of other industries, an asymmetric factor of the peak is calculated [34]. The asymmetric value is

a simple calculation of ⁄ that happens at 10% of the peak height, where b is the distance from

the midpoint of the peak to the tailing edge of the peak, and where a is the distance from the

midpoint of the peak to the leading edge of the peak [35]. An asymmetric calculation of 1 would

be considered a perfect peak, while values lower than 1 would be fronting peaks, and values

higher than 1 would be tailing peaks. In industry, most new columns have asymmetric factors

between .9 and 1.2 [34]. When the asymmetric value is too large, which means large peak

tailing, it begins to affect the results. Larger values make trace samples hard to quantify as the

peak height is lost to the tailing. For samples that contain both major and minor peaks, large peak

tailing could cause minor peaks to be lost in the tails, making them undetectable [36].

 Even though it is not common for columns to produce perfect Gaussian peaks they are

expected to produce peaks with little imperfections and minimum peak tailing. Agilent, Fisher

Scientific, and Sigma Aldrich, all vendors of commercially available columns, often advertise

the excellent peak shape of their columns, which denotes the importance of a good peak shape

[37][38][39]. Due to these parameters’ ability to demonstrate the quality of the column fabricated

in this thesis, they are reported in the following sections.

 33
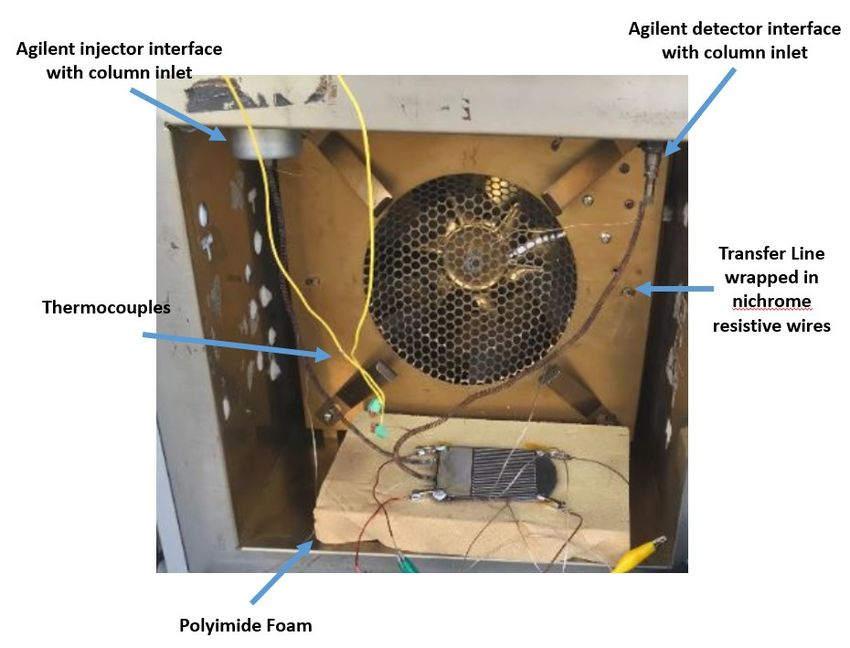
5.3 Testing Setup

 The silicon chip was tested in both TPGC and TGGC conditions. In order to test the micro-

GC columns, the column normally hooked up to an Agilent 6890 Gas Chromatography was

replaced by one of the microchips. The injector and detector (equipped with a FID) interface

with the oven through capillaries from the microchip. Once hooked up, the injector and detector

are brought up to 250 C. For test solutions we used a standard mixture containing 40 mg/L C8-

C20 n-alkane in n-hexane, commercial diesel, a standard mixture containing 1000 µg/mL C7-

C30 n-alkane in n-hexane, and lavender essential oil.

 The setup for TPGC was simple, after hooking up the chip it was treated as a normal column.

The oven door was closed and the Agilent interface was used to run the test. Depending on what

we were testing, we would heat the chip to different temperatures, but most runs consisted of

getting the oven to 40 C and then ramping it up to the desired temperature.

 In order to do TGGC runs on the chip, a student created a controller that allowed us to

control the temperature of the transfer lines (or inlet/outlet capillaries) as well as the primary and

secondary silk screened heaters independently of each other. The transfer lines were wrapped in

nichrome resistive wire (Figure 5-1-A) and were heated by the controller to 250 C—to maintain

the same temperature as the injector and detector. The primary heater and secondary heater

received temperature feedback from the thermal couples hooked up to the back of the chip

(Figure 5-1-B ) through polyimide tape, which allowed us to control the ramp rate of the

temperature of the heaters and control the gradient across the chip. The primary thermocouple

was placed near the center of the primary heater and the middle thermocouple was placed near

the center of the secondary heater. The chip was also placed in an insulating polyimide foam

 34
(Solimide HT-340) to insulate it from the environment and help get it to high temperatures

without the need for more power draw. A complete setup is shown in Figure 5-1-A.

 A typical TGGC run consisted of getting the injector, detector, and transfer lines (through the

nichrome resistive wire) to 250 C. Once the temperature reached 250 C, the controller turned on

the primary heater to 50 C, while the secondary heater remained off. At that point, the solution

was injected and the primary heater was ramped up while the secondary heater remained off.

Leaving the secondary heater off allowed us to create the gradient we wanted, as discussed in

Chapter 2, and the gradient demonstrated in Figure 4-4. Depending on the temperature

requirement of the solution, only the primary heater was used, while in others the secondary

heater was turned on.

 A.

 35
B.

Figure 5-1 A. Completed TGGC setup in Agilent oven without the top insulating foam to
show chip hookup. B. Backside of microchip. Thermal Couples were placed near the center
of primary heater (left), near the center of secondary heater (middle), near the end of the
chip (right)

5.4 N-Alkane results

 With the set-up described above, we tested C8-C20 in both TPGC and TGGC. We also tested

C7-C30 in TGGC. In the figures below, you will find the results for all three. For C8-C20 in

TPGC, a 1 µL sample was injected and the temperature was ramped from 40 C – 240 C at a ramp

rate of 15 C/min with a 1:15 split, in other words, only inserting 1/15 of the mixture into the

column and 14/15 to waste. Even though the split ratio can vary, splitting is a common practice

in GC to avoid overloading the column. The chromatogram in Figure 5-2 shows good resolution

with a flat baseline. All components were separated with C8 riding the tail of the solvent peak.

The asymmetric factor for peaks C11 and C17 were calculated to be .8846 and .8431,

respectively. These values would tell us that the peaks are slightly fronting or that the column is

slightly overloaded. In this case fronting is not an issue with the column and could have been

fixed by increasing the split, or reducing the amount injected.

 36
You can also read