COMMUNITY HEALTH ASSESSMENT - JULY 2018 COUNTY OF SAN LUIS OBISPO HEALTH AGENCY PUBLIC HEALTH DEPARTMENT
←
→
Page content transcription
If your browser does not render page correctly, please read the page content below

COMMUNITY HEALTH ASSESSMENT

         COUNTY OF SAN LUIS OBISPO   JULY 2018
         HEALTH AGENCY
         PUBLIC HEALTH DEPARTMENT
COMMUNITY
                                                                       HEALTH
                                                                       ASSESSMENT
                                                                       JULY 2018

Photo credits, cover page:
Top row, L-R: Kristin Steer; Central Coast Breastfeeding Association    COUNTY OF SAN LUIS OBISPO
Middle row: Giovanna Woods                                              HEALTH AGENCY
Bottom row, L-R: Kristin Steer; Hilary Gleske; Tara Kennon
                                                                        PUBLIC HEALTH DEPARTMENT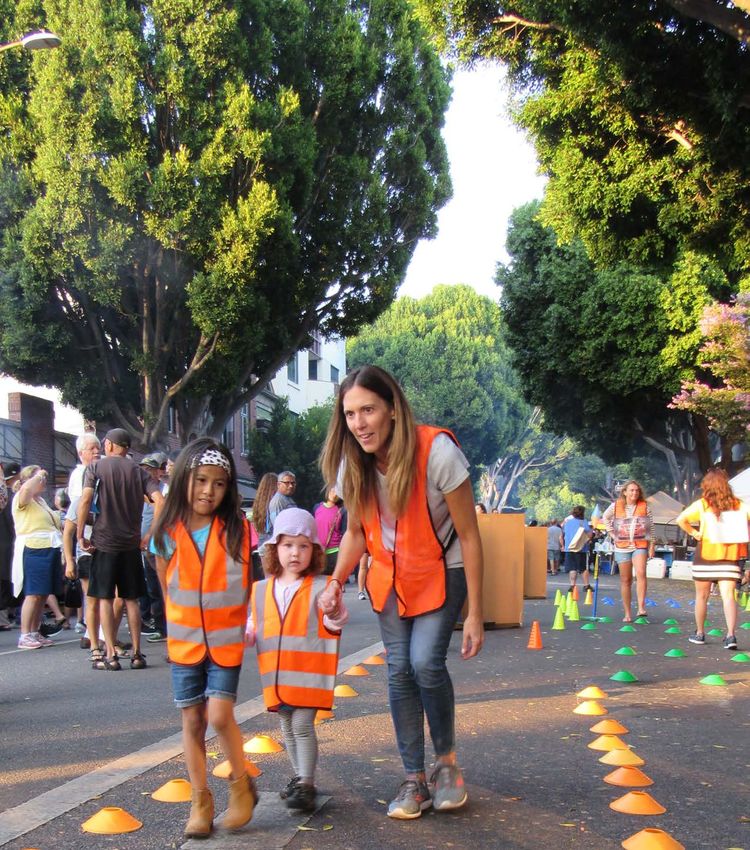
TABLE OF CONTENTS

                                          Introduction                               1

                                          Demographics                               7
                                               Geography                             7
                                               Population                            7
                                               Age                                   7
                                               Race/Ethnicity                        8
                                               Language                              8
                                               Populations with Special Needs					   10

                                          Social Determinants of Health						13
                                               Educational Attainment						15
                                               Housing									16
                                               Income and Poverty							18
                                               Employment								20
                                               Food Security								22
                                               Violence									24

                                          Access to Health Services							29
                                               Access to Primary Care						31
                                               Access to Behavioral Health Care					34
                                               Access to Dental Care							35
                                               Access to Specialty Care						36
                                               Insurance Coverage                    37

Community Health Assessment | July 2018                                              San Luis Obispo County
Health Behaviors								69
Maternal, Child & Adolescent Health					           39        Tobacco                                             71
       Prenatal Care								41                               Obesity, Diet and Exercise                          72
       Breastfeeding								42
       Teen Births								44                            Injuries                                                 75
       Infant Mortality								46                            Motor Vehicle Accidents                             77
                                                             Bike and Pedestrian Accidents                       78
Infectious Disease                                 47        Falls										80
       Sexually Transmitted Diseases 					49
       HIV/AIDS									50                              Social & Emotional Wellness						83
       Hepatitis									52                                  Mental Health								85
       Pneumonia and Influenza                     52        Substance Use Disorders						88
       Vector-Borne Disease							54                         Suicide									92
       Foodborne Illness							56
       Valley Fever                                57   Environment                                               97
       Vaccines and Immunizations                  58        Air Quality									 99
                                                             Water Quality								102
Chronic Disease									59                                   Water Availability							104
       Cancer									61                                     Built Environment							105
       Heart Disease								62                               Transportation								106
       Stroke									64                                     Pesticides and Toxic Substances					108
       Chronic Obstructive Pulmonary Disease 			   64
       Diabetes									66                              Appendices									109
       Asthma                                      67        Appendix 1: SLO Health Counts                        111
       Oral Health                                 67        Appendix 2: Methods of Data Collection                 113
                                                             Appendix 3: Health Assets and Resources 		          121
                                                             Appendix 4: Indicators at a Glance			               125

Community Health Assessment | July 2018                                                                           San Luis Obispo County
WELCOME

Together, we can use this data             The power of data to guide actions toward improving
                                           community health is immense.

to inform our pursuit of a                 Accurate, relevant information helps us determine how to most
                                           effectively direct limited resources and where to find assets we can
stronger, healthier San Luis               leverage to make positive change. It helps us understand who is
                                           most vulnerable to health threats and what demands most need

Obispo County.                             our attention.

                                           For these reasons and more, we are pleased to share this
                                           community health assessment with you. This report will serve as
                                           a resource for all of us who are working to promote health and
                                           wellness in San Luis Obispo County.

                                           The assessment paints a point-in-time picture of the health status
                                           of the county and highlights the important social, economic, and
                                           health conditions that face our community. For those interested in
                                           specific issues, the report offers details on our local context, as well
                                           as state and national comparisons.

                                           We hope this report will provide a powerful launching point for
                                           realistic, well-informed conversations and actions to improve the
                                           health of our community. We look forward to working alongside
                                           local leaders—from community organizations to academia,
                                           philanthropy, government, and business—to use this assessment in
                                           working toward our shared goals.

                                           Together, we can use this data to inform our pursuit of a stronger,
                                           healthier San Luis Obispo County.

                                           To Health,

                                           Penny Borenstein, MD, MPH
                                           Health Officer / Public Health Director
                                           County of San Luis Obispo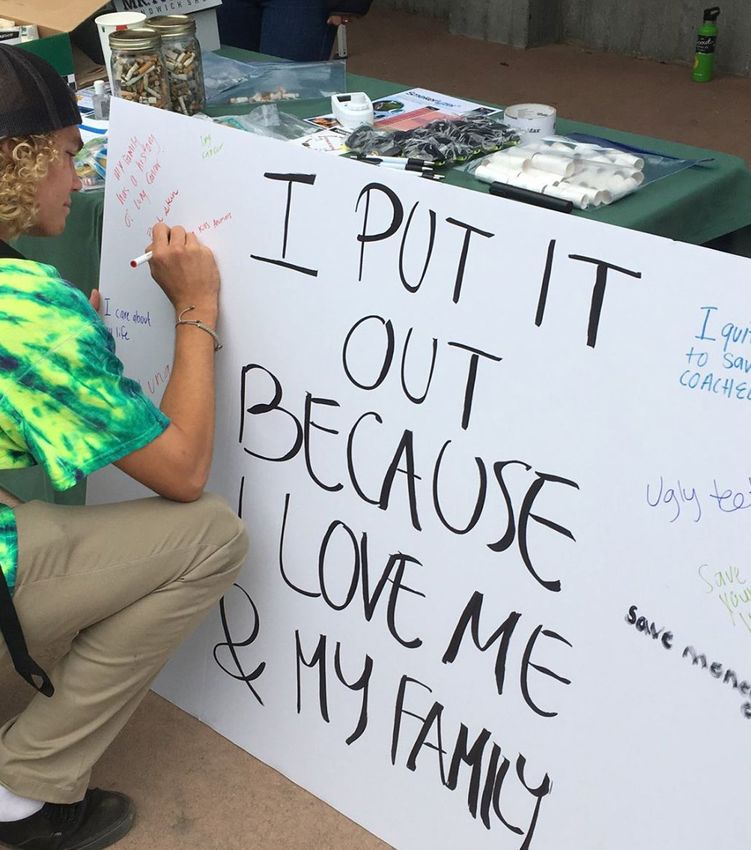
INTRODUCTION

                                               INTRODUCTION
                                                         A community health assessment is both a process
                                                         and a product. It is the process of gathering a broad
                                                         range of information from many diverse sources in
                                                         order to understand important trends and factors
                                                         influencing the health of the community. As a
                                                         product, it reports the information gathered through
                                                         that process. It is also about sharing that information
                                                         and using it to develop strategies to improve the
                                                         health of the community.

                                                         Two-Part Planning Effort
                                                         The County of San Luis Obispo Public Health Department is working
                                                         with community partner organizations on a two-part planning
                                                         effort to improve the health of San Luis Obispo County residents.
                                                         The Community Health Assessment report represents the first
                                                         part of that collaborative effort: identifying the health issues of the
                                                         county and their larger context. The Public Health Department and
                                                         community partners then use the community health assessment
                                                         to inform discussions and identify priority areas for part two of the
                                                         collaborative effort: a community health improvement plan.

                                                         Collaborative Process
                                                         In January 2017, the Public Health Department reached out to
                                                         partner organizations to discuss participating in a community health
                                                         assessment based on the framework and standards established by
                                                         the Public Health Accreditation Board. In all, close to 200 individual
                                                         residents provided information or actively participated in the
                                                         development of the community health assessment. This included
                                                         community stakeholders and representatives of organizations
                                                         across multiple sectors.

                                                         The Public Health Department engaged participants through
                                                         surveys, meetings, workshops, and focus groups to gauge
                                                         their perceptions of the community’s health, areas for health
                                                         improvement, factors that contribute to health challenges,
                                                         and existing community resources available to improve heath.
                                                         See Appendix 2: Methods of Data Collection for a list of local
                                                         organizations that participated in the community health
                                                         assessment, as well as a summary of comments submitted by
                                                         partners on a draft of this report.
photo credit: William Rumbler
10   Community Health Assessment | July 2018                                                           San Luis Obispo County      1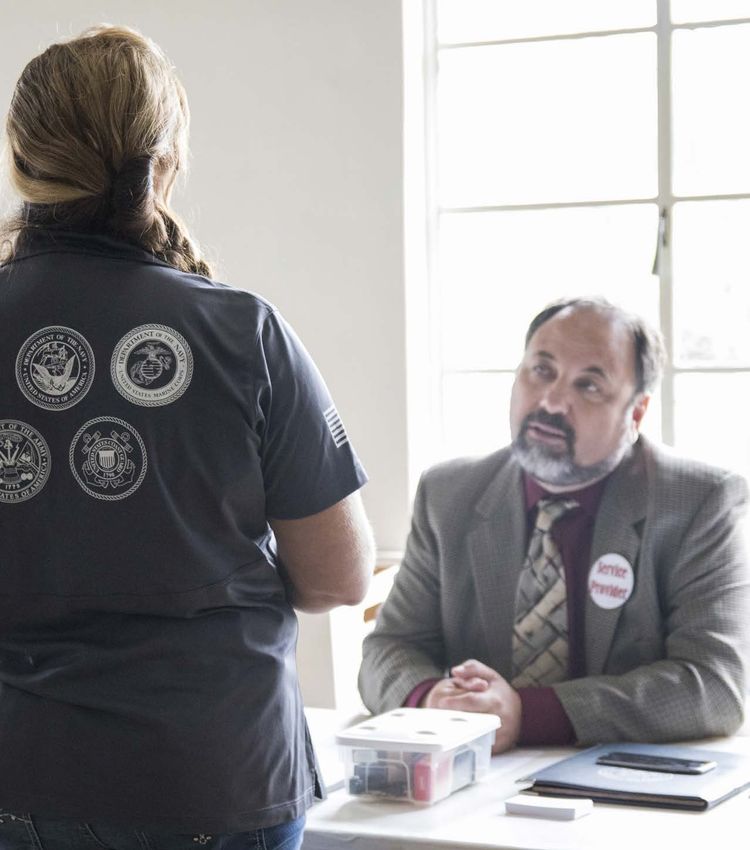
INTRODUCTION                                                                                                                                                                                   		                  INTRODUCTION

  Scope of the Assessment                                                                                                   and natural assets such as open space for physical activity. Please see Appendix 3: Health Assets
                                                                                                                            and Resources for a map of the physical assets, such as parks, clinics, and fresh food markets,
  How a community defines health influences what is included in a community health assessment.                              community partners identified as supporting health.
  This community has defined health broadly in recognition of the range of factors that can
  influence the community’s health. These factors include clinical care issues such as access to
  medical services; behaviors such as diet and exercise; social and economic factors such as housing                        Highlights
  and employment opportunities; and parts of the physical environment such as water and air quality.                        In this report, many readers will find information significant to their areas of interest or concern.
                                                                                                                            Among the findings, several stand out as especially notable.
  Community stakeholders and representatives from multi-sector organizations selected the
  following nine priority areas to include in the assessment:                                                               Areas of strength:
  •  Social Determinants of Health                         •  Infectious Disease          •  Injuries                          •   Lower rate of diabetes: The rate of adults with diabetes in San Luis Obispo County is
  •  Access to Health Care                                 •  Chronic Disease              •  Social & Emotional Wellness          nearly half the national rate. 5.6 percent of local adults have diabetes, compared to 9.3
                                                                                                                                   percent statewide and 10.5 percent nationwide.
  •  Maternal, Child & Adolescent Health        •  Health Behaviors            •  Environment
                                                                                                                               •   Higher rate of breastfeeding initiated at birth: In San Luis Obispo County, 97.6 percent of
  These nine priority areas include 37 specific health indicators.
                                                                                                                                   mothers initiated breastfeeding in the hospital in 2016, higher than the national and state
  This community health assessment is organized as a reference document. Readers can quickly                                       averages, and higher than the Healthy People 2020 goal of 81.9 percent.
  navigate to any of nine health categories or directly to one of the 37 health indicators. Indicators
                                                                                                                               •   Lower rate of teen births: The teen birth rate is 14.1 per 1,000, compared to 21 per 1,000
  are based on Healthy People 2020, a set of science-based, 10-year national objectives for
                                                                                                                                   statewide and the Healthy People 2020 target of 36.2 per 1,000.
  improving the health of all Americans, and on factors either unique to this region or of noted
  interest to community members (depending on data availability, reliability, and validity). In                             Areas for improvement:
  addition to relevant statistical data, the report addresses the impact and context for each
  indicator. For those who want to dive deeper, a comprehensive catalogue of indicators is                                     •   Insufficient access to Denti-Cal Providers: The ratio of Denti-Cal providers to beneficiaries
  available in Appendix 4: Indicators at a Glance. In addition, the SLO Health Counts data hub                                     has been classified by the state as below standard. Denti-Cal patients report waiting
  (www.SLOHealthCounts.org) serves as a complementary resource to this report.                                                     months for critical dental care.

  The report is informed by primary data from the Public Health Department and secondary data                                  •   High rate of teens who consider suicide: 18 percent of eleventh graders surveyed had
  from national, state, and other local sources. While broad in scope, the report does not focus                                   seriously considered suicide in the past 12 months. This rate is similar to the state average.
  deeply on any one indicator. Some indicators which merited examination are not addressed in the
                                                                                                                               •   Insufficient affordable housing: Only 15.4 percent of homes for sale in San Luis Obispo
  report due to data limitations and information gaps. Due to the relatively small population size
                                                                                                                                   County are affordable for median-income families. Most renters spend more than one-
  of San Luis Obispo County, data may be grouped in multiple years when working with statistically
                                                                                                                                   third of their income on housing.
  small sample sizes. Please see Appendix 2: Methods of Data Collection for a further description of
  how and what information was collected and analyzed for the community health assessment.
                                                                                                                            Health Equity
  The report includes perspectives and insights from residents across San Luis Obispo County,
  including those who are part of neighborhood organizations, schools and colleges, advocacy                                The ultimate aim of health improvement planning is not only to achieve goal-driven health
  groups, nonprofits, community clinics, employers, hospitals, law enforcement organizations                                measures for the population as a whole, but also to ensure all residents are equally able to benefit
  and the faith community, as well as community members who have been traditionally                                         from this achievement. This means eliminating health disparities based on poverty, employment,
  underrepresented. Together, these voices provide important insights into many of the broad array                          education, race, ethnicity, urban or rural location, and other such factors.
  of issues, assets and concerns that shape a community’s health.
                                                                                                                            The indicators in this report show measures or patterns of health attainment for the population
  The community health assessment also looks at the capacity of the public health system to                                 of San Luis Obispo County as a whole. In the context of a community that often compares
  provide essential public health services, which are the fundamental framework for activities                              favorably to state and national indicators, it is critical to recognize that these measures may vary
  that protect and promote the health and well-being of communities. A community’s existing                                 significantly for sub-groups within that whole. In some cases, it is possible that positive overall
  capacity to support residents’ well-being is also relevant. This includes formal elements of the                          patterns—an indicator showing improvement over time, for example—may mask challenges or
  public health system (such as clinics), services provided by businesses and community groups,                             unfavorable outcomes for a particular population or group.

  2    Community Health Assessment | July 2018                                                                                                                                                           San Luis Obispo County     3
INTRODUCTION

                                              Using data to identify such disparities is a valuable part of health improvement planning. In
                                              some cases where data is available, the indicators highlight patterns for sub-groups (such as
                                              residents who primarily speak Spanish) as well as the population as a whole. In a county of this
                                              size, however, meaningful data sources and statistical tools focused on health equity are often
                                              limited or unavailable. That makes it all the more important to consider possible health equity
                                              implications when reviewing the data and charting health improvement efforts.

                                              Adverse Childhood Experiences
                                              As communities work toward health equity, researchers are seeking to understand the factors that
                                              shape health outcomes over a lifetime. A growing body of research points to adverse childhood
                                              experiences (ACEs) as among those key factors. While the first study connecting ACEs with health
                                              outcomes was published nearly 20 years ago, this connection is only more recently emerging as a
                                              valid and powerful factor in understanding health.

                                              Research on ACEs shows a strong link between childhood trauma and chronic disease in adults,
                                              including physical as well as social and emotional problems. The predictive value of an ACEs
                                              “score” (the degree of trauma experienced as a child) has been shown to remain valid regardless
                                              of other socioeconomic or ethnic indicators. The related practice of trauma-informed care aims to
                                              mitigate the effect of ACEs on long-term health outcomes.

                                              Because this field is only recently gaining prominence, local ACEs data is not available for this
                                              report. It will be critical to maintain a keen lens on the ACEs construct as health improvement
                                              planning continues in years ahead, and in particular to consider ways the community may deploy
                                              trauma-informed care to help ensure every child has the opportunity to become a healthy adult.

                                              Next Steps
                                              The findings in this report helped inform discussion at a February 2018 convening of
                                              stakeholders and community leaders. The purpose of the convening was to begin to establish
                                              goals and strategies to achieve collective impact through a five-year plan for countywide health
                                              improvement. Convening participants worked on identifying common goals, developing strategies
                                              for improvement, identifying opportunities to amplify and support each other’s work, and creating
                                              or enhancing meaningful partnerships. The Community Health Improvement Plan (CHIP) is now
                                              under development and is expected to follow shortly on the heels of this Community Health
                                              Assessment.

photo credit: Paula Moreno
4   Community Health Assessment | July 2018                                                                              San Luis Obispo County   5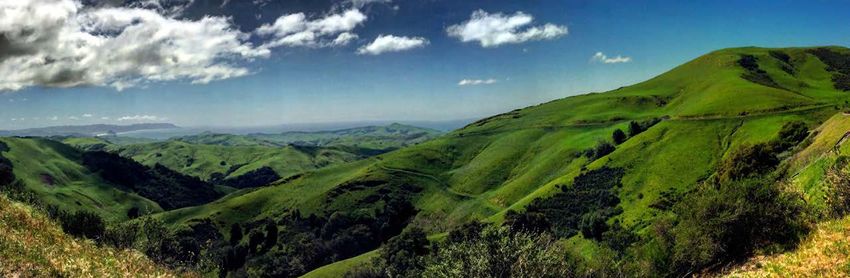
DEMOGRAPHICS

                                              DEMOGRAPHICS
                                                       Geography

    “Our county has significant health                 San Luis Obispo County is located along the Pacific Coast,
                                                       approximately 200 miles north of Los Angeles and 235 miles
                                                       south of San Francisco. It is one of California’s 27 original counties
     assets, from beautiful natural                    created in 1850. The county includes seven cities, though most of
                                                       the county’s 3,326 square miles are unincorporated. The majority

    resources to the dedicated people                  of residents live along the coast or along the corridor of Highway
                                                       101. The eastern region is sparsely populated with vast areas of

    working on the ground every day
                                                       agricultural and undeveloped government lands between small,
                                                       unincorporated towns. Key industries in the county include tourism,
                                                       education, energy, agriculture and government.
    to support our health. But we still                The county has four distinct geographic regions—North Coast,

     face real challenges to ensuring                  North County, San Luis Obispo, and South County—all of which
                                                       have distinct characteristics, population densities, age groupings
                                                       and other features.
     everyone in San Luis Obispo
                                                       Population
     County has the opportunity to be                  San Luis Obispo County had a total population of 277,977 in 2016.1

     healthy.”                                         With a population of 46,117, the City of San Luis Obispo is the
                                                       largest city in the county; it is also the county seat.2 The population
                                                       density of the county, estimated at 81.7 persons per square mile, is
                                                       less than the average population density of the state (239.1 persons
                                                       per square mile) and the nation (87.4 persons per square mile).3
    ~ Dr. Penny Borenstein, Health Officer
                                                       Age
                                                       Age patterns in a community have important implications for
                                                       disease patterns and demand for health care services. They also can
                                                       have important impacts on the economy and workforce.

                                                       In San Luis Obispo County, residents under the age of 20 account
                                                       for a relatively smaller share of the population (23.1 percent)

                                                       1   California Department of Finance. (2017). E-5 Population and Housing Estimates for Cities, Counties,
                                                           and the State, 2011-2017 with 2010 Census Benchmark. www.dof.ca.gov/Forecasting/Demographics/
                                                           Estimates/E-5.
                                                       2   California Department of Finance. (2016). Reports and Periodicals.
                                                       3   U.S. Census Bureau. (2017). QuickFacts on San Luis Obispo County, California and the United States.
                                                           https://www.census.gov/quickfacts/fact/table/sanluisobispocountycalifornia,CA,US/PST045217.

6   Community Health Assessment | July 2018                                                                                 San Luis Obispo County                7
DEMOGRAPHICS                                                                                                                                                                                                                        		                DEMOGRAPHICS

  compared to the state (26.4 percent).4 Regional analysis reports this number has been falling in                                                          San Luis Obispo County Regions
  recent years, alongside a loss of early- to mid-career population (ages 30 to 44).5

  On the other hand, seniors account for a relatively higher share of the population as compared to
  the state. Those over the age of 60 accounted for nearly one-quarter of the population in San Luis
  Obispo County (24.5 percent), compared to the state (18.3 percent).6 Regional analysis reports
  that this number has been continuing to increase in recent years.7

  Race/Ethnicity
  The majority of residents (69.2 percent) identify as white, followed by 22.3 percent as Hispanic/
  Latino, 3.9 percent as Asian and 2.0 percent as African American.8 In a comparison of race/
  ethnicity make-up, San Luis Obispo County has a higher percentage of non-Hispanic white
  residents compared to the state of California (37.7 percent), and a lower percentage of Hispanic/
  Latino, African American and Asian individuals compared to the state of California.

                                                                                                                                                                                                              County Regions
  Language                                                                                                                                                                                      Baywood, Cambria, Cayucos, Harmony, Los Osos, Morro Bay, Ragged
                                                                                                                                                            North Coast
                                                                                                                                                                                                Point and San Simeon
  Residents who do not speak English can face linguistic difficulties and barriers in many areas,
  including health. These barriers are most common among households that are in “linguistic
                                                                                                                                                                                                Atascadero, Bee Rock, California Valley, Camp Roberts, Cholame,
  isolation,” which the U.S. Census Bureau defines as a household in which no member 14 years old
                                                                                                                                                            North County                        Creston, Heritage Ranch, Lake Nacimiento, Oak Shores, Paso Robles,
  or older speaks English “very well.”  It is important to recognize and accommodate non-English                                                                                                Pozo, Klau, San Miguel, Santa Margarita, Shandon and Templeton
  speaking residents as they may require additional support in outreach, health education, and
  service delivery from health providers. In San Luis Obispo County, 3.5 percent of all households
                                                                                                                                                            San Luis Obispo                     City of San Luis Obispo
  report being linguistically isolated.9

  Eighty-three percent of residents of San Luis Obispo County speak English as the primary language                                                                                             Avila Beach, Arroyo Grande, Halcyon, Grover Beach, Nipomo, Oceano,
                                                                                                                                                            South County
  in their household, and over 13 percent speak Spanish as their primary language. Over 20 percent                                                                                              Pismo Beach and Shell Beach
  of Paso Robles residents speak Spanish at home. Roughly two percent of county residents speak
  Chinese or Tagalog, and another two percent speak other Indo-European languages.10
                                                                                                                                                            Population by Jursidiction, San Luis Obispo County

                                                                                                                                                                               Jurisdiction                          Population
                                                                                                                                                            Arroyo Grande                                                 17,731
                                                                                                                                                            Atascadero                                                    30,879
  4       U.S. Census Bureau. (2017). American Community Survey 2012-2016 5 Year Estimates. Table B01001: Sex by Age. https://factfinder.census.gov/bkmk/   Grover Beach                                                  13,397
          table/1.0/en/ACS/16_5YR/B01001/0400000US06|0500000US06079.
                                                                                                                                                            Morro Bay                                                     10,722
  5       San Luis Obispo Council of Governments (SLOCOG). (2017). 2050 Regional Growth Forecast for San Luis Obispo. www.slocog.org/programs/data-
          services/regional-growth-forecast.                                                                                                                Paso Robles                                                   31,398
  6       U.S. Census Bureau. (2017). 2012-2016 American Community Survey 5-Year Estimates. Table B01001: Sex by Age. https://factfinder.census.gov/bkmk/
          table/1.0/en/ACS/16_5YR/B01001/0400000US06|0500000US06079.
                                                                                                                                                            Pismo Beach                                                    8,181
  7       San Luis Obispo Council of Governments (SLOCOG). (2017). 2050 Regional Growth Forecast for San Luis Obispo. www.slocog.org/programs/data-         San Luis Obispo                                               46,117
          services/regional-growth-forecast.
                                                                                                                                                            Unincorporated Areas                                          119,552
  8    U.S. Census Bureau. (2017). QuickFacts on San Luis Obispo County, California and the United States. https://www.census.gov/quickfacts/fact/table/
       sanluisobispocountycalifornia,CA,US/PST045217.                                                                                                       Total                                                         277,977
  9       U.S. Census Bureau. 2010-2014 American Community Survey 5-Year Estimates. https://factfinder.census.gov.
  10    U.S. Census Bureau. 2010-2015 American Community Survey 5-Year Estimates. https://factfinder.census.gov.                                            Source: California Department of Finance, 2016.

  8       Community Health Assessment | July 2018                                                                                                                                                                                            San Luis Obispo County   9
DEMOGRAPHICS DEMOGRAPHICS
Age Distribution, San Luis Obispo County and California
SocioNeeds Index
The SocioNeeds Index is a measure of socioeconomic need that is correlated with poor health 80 years and over
outcomes. This tool, developed by Conduent Healthy Communities Institute and made available
70 to 79 years
on the SLO Health Counts data hub (www.SLOHealthCounts.org), provides a snapshot of how
current socioeconomic needs vary within San Luis Obispo County. 60 to 69 years
All ZIP codes in the U.S. are given an index value from 0 (low need) to 100 (high need). For 50 to 59 years
example, a ZIP code with an index value of 50 would be average, as compared with the rest of
40 to 49 years
the country. To help identify areas of highest need within the community, ZIP codes are ranked
from 1 to 5 based on their index value, color-coded and displayed on an interactive map at 30 to 39 years
www.SLOHealthCounts.org.
20 to 29 years
This index combines multiple socioeconomic indicators into a single composite value. As a single
indicator, the index can serve as a concise way to explain which areas are of highest need. The 10 to 19 years
index is calculated from six indicators, one each from the following topics: poverty, income,
Under 9 years
unemployment, occupation, education, and language. The indicators are weighted to maximize
the correlation of the index with premature death rates and preventable hospitalization rates. 0% 5% 10% 15% 20% 25%
In San Luis Obispo County, areas ranked as having highest need include the campus of California
SLO CA
Polytechnic State University (Cal Poly) , likely because of comparatively low student income and Source: American Community Survey 2012-2016 5 Year Estimates. Table B01001: Sex by Age.
employment rates, and portions of Oceano, San Miguel, and Shandon. Conversly, areas ranked as
having the lowest need include portions of Shell Beach, Cayucos, Harmony, Arroyo Grande, and Population Race and Ethnicity, San Luis Obispo County and California
Creston. See map on page 10 for more detail.
Populations with Special Needs California
Asian
14.8%
Hispanic
38.9%
White
37.7%
Disabled individuals comprise a vulnerable population that requires targeted services and
outreach by community and health care providers. Underemployment and poverty are also major
problems facing individuals with disabilities.
Asian Hispanic White
San Luis Obispo
3.9% 22.3% 69.2%
According to the Centers for Disease Control and Prevention (CDC), more than 50 million people
(approximately 20 percent of the population) in the U.S. have a disability, and, of those, more than
34 million (>12 percent) live with a severe disability.
0% 100%
Source: American Community Survey 2012-2016 5-Year Estimates.
In San Luis Obispo County, 25.6 percent have a disability.11 These are individuals who are limited
in any activity because of physical, mental, or emotional problems.
Households by Type, San Luis Obispo County
Household Type Percent
Nonfamily Households 36.9%
Family Households 63.1%
Married-Couple Family 50.1%
Female Householder Family 8.8%
11 UCLA Center for Health Policy Research. AskCHIS. 2014-2016 Pooled average. Disability status due to physical, mental or emotional condition: Adults.
Male Householder Family 4.2%
(San Luis Obispo County). http://ask.chis.ucla.edu.
Source: U.S. Census Bureau, 2010-2015 American Community Survey, 1-Year Estimates.
10 Community Health Assessment | July 2018 San Luis Obispo County 11DEMOGRAPHICS
SocioNeeds Index, San Luis Obispo County, 2018
SOCIAL DETERMINANTS OF HEALTH
Source: Conduent Healthy Communities Institute, available at www.slohealthcounts.org
12 Community Health Assessment | July 2018 photo credit:
San Luis Sarah
Obispo Trauger
County 13SOCIAL DETERMINANTS OF HEALTH
SOCIAL DETERMINANTS OF HEALTH
Health is about more than just medical care.
Safe affordable housing, clean drinking water,
healthy affordable food, access to education and
employment that offers a livable wage are essential
components for living a healthy life; all of these
factors affect the overall health of the community.
Policies recognizing that there is more to health and
well-being than health care alone contribute to a
flourishing society. Increased health contributes to
increased productivity, a more efficient workforce,
and reduced expenditure on health care services.
Recent studies examining diseases in the context of social
conditions are generating a better understanding of how poverty,
neighborhood violence, substandard housing conditions, family
instability, and other stresses can contribute to illnesses, like
asthma, high blood pressure and others. The research is not only
leading to a more accurate understanding of why health patterns
vary along class and racial lines, but why anti-poverty efforts,
Good News Spotlight even more than medication, offer the most promise for healthier
CalFresh Alliance: Progress on Food Security through Collaboration communities.12
The San Luis Obispo County CalFresh
Alliance came together in 2015 with a Educational Attainment
clear goal: to increase participation in
CalFresh among residents. Together, Why this Matters
partners from multiple sectors work to Research suggests that educational attainment is one of the
make it easier for residents to enroll in strongest predictors of health.13 More education is consistently
CalFresh—and stay enrolled if needed. associated with greater earning potential, higher life expectancy,
While big-picture data on enrollment and lower levels of certain chronic and infectious diseases.
trends will not be available for several Completion of formal education is a key pathway to employment
years, specific changes are already making and access to healthier and higher paying jobs that can provide
a difference for people in need of food food, housing, transportation, health insurance, and other basic
assistance. One simple yet powerful necessities for a healthy life.14
example is same-day enrollment. Thanks
to this effort, residents who qualify can
12 Unnatural Causes Website: THE BIGGEST ASTHMA TRIGGER OF THEM ALL? New studies indicate how
complete their enrollment and purchase poverty itself is inflammatory. www.unnaturalcauses.org/assets/uploads/file/Chen percent20and
percent20asthma percent20article.pdf.
nutritious food the same day they apply.
13 Freudenberg N, Ruglis J. (2007). Reframing school dropout as a public health issue. Prev Chronic Dis
2007;4(4). https://www.cdc.gov/pcd/issues/2007/oct/07_0063.htm.
14 Robert Wood Johnson Foundation. (2013). Why Does Education Matters So Much to Health? www.rwjf.
org/content/dam/farm/reports/issue_briefs/2012/rwjf403347.
14 Community Health Assessment | July 2018 San Luis Obispo County 15SOCIAL DETERMINANTS OF HEALTH SOCIAL DETERMINANTS OF HEALTH
In San Luis Obispo County Individuals Spending More than One- Percentage of Homes Affordable for
Percentage of Homes Affordable for
San Luis Obispo County has a higher percentage of residents who have their high school diploma Third of Income on Housing, San Luis Median-Income Families
(90.1 percent) compared to the state (82.1 percent).15 The county also has a higher percentage of Median-Income Families, 2010-2016
Obispo County SLO vs. Nation
residents with a Bachelor’s degree or higher (34.1 percent) compared to the state (32.0 percent).16 California
San Luis Obispo
In the county, 91.5 percent of students receive their high school diploma within four years of their 86.8%
76.4% 78%
first enrollment in 9th grade.17 This meets the Healthy People 2020 goal of 87 percent. In addition, 72%
75% 74%
88 percent of students pass the English-Language Arts section of the California High School Exit 66% 67% 65%
Exam (CAHSEE), and 89 percent pass the Math section.18 60% 62%
57%
47.9%
48%
46%
Housing
32% 30%
Why this Matters 27%
24% 25%
The availability of affordable, safe, stable, quality housing is central to the health of a community. 15%
This includes the physical conditions within homes; conditions in the neighborhoods surrounding
homes; and housing affordability. 2010 2011 2012 2013 2014 2015 2016 2017 2018
Owners Renters Spanish-Speaking
Quality physical conditions within homes protect individuals and families from harmful exposures Source: ACTION for Healthy Communities Telephone Survey, 2016. Source: National Association of Home Builders, 2016.
(e.g. mold, lead, injuries, air pollutants) and provide them with a sense of privacy, security,
stability and control, which can impact health. Conditions in neighborhoods (e.g. safe places for
National Affordability Rankings: Least Affordable Metro Areas in U.S.
play, employment opportunities, low crime, healthy foods, high levels of trust) can also affect
an individual’s sense of control, stability and stress levels and their exposure to violence. Lastly,
Homes
affordable housing (when a family spends less than one-third of its income to rent or buy a Median Median
Affordable
residence) enables low and moderate income families to put more of their financial resources Rank Metro Area Family Sales
for Median
toward basic necessities, like nutritious food, medical care, and reliable child care.19 Income Price
Income
1 San Francisco-Redwood City-South San
In San Luis Obispo County Francisco, CA
9.2% $119,600 $1,260,000
Fifty-nine percent of San Luis Obispo County residents reported spending one-third or more of
2 Los Angeles-Long Beach-Glendale, CA 9.5% $68,000 $589,000
their household income on housing costs in 2016.20 Spanish-speaking individuals and renters
3 Salinas, CA 10.7% $69,100 $550,000
experienced greater housing challenges, with 86.8 percent of Spanish-speaking individuals
4 Anaheim-Santa Ana-Irvine, CA 11.9% $93,000 $720,000
spending more than one-third of their income on housing costs (57.1 percent spending over half)
and 76.4 percent of renters (versus 47.9 percent of home owners). 5 Santa Cruz-Watsonville, CA 12.2% $81,400 $710,000
6 San Luis Obispo-Paso Robles-Arroyo 15.4% $80,600 $558,000
In 2015, 2-1-1 San Luis Obispo County, a local information line which links people to safety net Grande, CA
services, received 3,473 total calls for assistance. The single greatest request, with 33 percent of 7 Napa, CA 15.7% $88,500 $635,000
call volume, was for housing and utilities. 8 San Jose-Sunnyvale-Santa Clara, CA 16.6% $125,200
Among 225 communities in the U.S., San Luis Obispo County ranked as the 6th least affordable 9 San Diego-Carlsbad, CA 18.6% $81,800 $530,000
10 San Rafael, CA 22.5% $139,000 $975,000
15 U.S. Census Bureau. (2017). 2012-2016 American Community Survey, 5-year estimates. https://www.census.gov/quickfacts/fact/table/ 11 Oakland-Hayward-Berkeley, CA 23.5% $103,000 $670,000
sanluisobispocountycalifornia,CA,US/IPE120216#viewtop.
16 Ibid.
12 Oxnard-Thousand Oaks-Ventura, CA 24.8% $96,000 $562,000
17 California Department of Education. (2015). Cohort Outcome Data for the Class of 2014-2015, SLO County. https://dq.cde.ca.gov/dataquest. 13 Santa Maria-Santa Barbara, CA 25.8% $79,600 $549,000
18 California Department of Education. (2015). High School Exit Exam Office; Taken from ACTION for Healthy Communities Vital Signs – Understanding 14 Merced, CA 26.6% $48,200 $270,000
San Luis Obispo County. http://actionslo.org.
19 Robert Wood Johnson Foundation. (2011). Housing and Health. https://www.rwjf.org/content/dam/farm/reports/issue_briefs/2011/rwjf70451. 15 Stockton-Lodi, CA 28.5% $63,700 $365,000
20 ACTION for Healthy Communities. (2016). Vital Signs – Understanding San Luis Obispo County. http://actionslo.org.
Source: National Association of Home Builders, Housing Opportunity Index, 2018 First Quarter Report.
16 Community Health Assessment | July 2018 San Luis Obispo County 17SOCIAL DETERMINANTS OF HEALTH SOCIAL DETERMINANTS OF HEALTH
area for housing in the first quarter of 2018, a slight improvement from the third least affordable Number of Housing Units by Type, San Luis Obispo County
in 2009.21
Total Single Single Two to Mobile
Five+
This lack of affordable housing options is compounded by a similarly low number of income- Units Detached Attached Four Homes
restricted affordable housing units. The county currently has 3,275 income-restricted affordable 2012 118,075 80,025 6,455 9,039 11,880 10,676
rental housing units for low- to moderate-income households.22 These units are dispersed 2017 121,049 82,168 6,597 9,179 12,371 10,734
throughout the county and are managed by a network of nonprofit and private entities. The
Source: California Department of Finance. (2017). E-5 Population and Housing Estimates for Cities, Counties, and the State,
nonprofit housing developers in San Luis Obispo County include the San Luis Obispo Housing January 2011-2017. http://www.dof.ca.gov/Forecasting/Demographics/Estimates/E-5.
Trust Fund, Peoples’ Self-Help Housing, Housing Authority of San Luis Obispo, Paso Robles
Housing Authority, and Transitions-Mental Health Association (TMHA). Currently, none of these
agencies have affordable housing available.
Income-Restricted Affordable Housing Units by Region, San Luis Obispo County
Affordable housing scarcity, alongside a variety of other issues, can lead individuals to become
homeless. The 2017 San Luis Obispo County Homeless Point-in-Time Count found 1,125 Region City # of units by bedroom size
individuals in San Luis Obispo County who met the HUD definition of homelessness.23 This Studio 1 Bdrm 2 Bdrm 3 Bdrm 4 Bdrm Total Units
represents a decrease of 26 percent from 2015.24 Of those counted, 780 (69 percent) were Central San Luis Obispo 46 268 176 106 18 614
unsheltered (sleeping outdoors, on the street, in parks, in vehicles, etc.) and 345 (31 percent) were North Coast Cambria 7 14 21
considered sheltered (i.e. emergency shelter or transitional housing).25 Eight percent were under Los Osos 113 9 122
the age of 25. Twenty-six percent were between the ages of 25 and 40, 54 percent were between Morro Bay 9 73 19 8 109
the ages of 41 and 60, and 12 percent were 61 years or older.26 North County Atascadero 1 145 442 14 602
Paso Robles 34 323 665 133 9 1164
Income and Poverty Templeton 32 58 34 124
South County Avila 8 17 3 28
Why this Matters Arroyo Grande 171 37 27 235
Economic insecurity is often associated with poor health. Poverty increases the risk of many Nipomo 67 101 38 206
conditions, including poor nutrition, low birth weight, cognitive and developmental delays,
Oceano 5 14 6 1 26
decreased mental well-being, poor academic achievement, unemployment, lack of access to
Pismo Beach 2 17 5 24
health care, and inadequate housing. Low socioeconomic status is also associated with differences
in life expectancy of 15-20 years in many California cities, according to the California Endowment.27 County Totals 98 1149 1514 448 66 3275
Source: Community Action Partnership of San Luis Obispo County. CAPSLO, 2017. Comprehensive Community Needs Assessment.
In San Luis Obispo County
From 2011-2015, 14,375 households in San Luis Obispo County were living in poverty, 14.8 percent
of all households.28 San Luis Obispo County saw a slight increase in the percentage of children Total Homeless Census Population by Region, San Luis Obispo County
living below the federal poverty level from 13 percent in 2010 to 15 percent in 2015, while adults
San Luis
North County North Coast South County Total County
21 National Association of Home Builders. (2018). Housing Opportunity Index, 2018 1st Quarter report. www.nahb.org/en/research/housing-economics/ Obispo
housing-indexes/housing-opportunity-index.aspx.
22 Community Action Partnership of San Luis Obispo County (CAPSLO). (2017). Comprehensive Community Needs Assessment. https://www.capslo.org/ 2015 2017 2015 2017 2015 2017 2015 2017 2015 2017
images/pdf/events/cap2016-2017.pdf.
23 Applied Survey Research. (2017). San Luis Obispo County Homeless Census & Survey 2017 Comprehensive Report. http://www.slocounty.ca.gov/ Unsheltered 452 139 141 102 324 222 206 317 1123 780
getdoc/97678e2e-81b9-44e4-86d5-5d16a0f5e261/2017-Homeless-Census-and-Survey.aspx
24 Ibid.
Sheltered 177 114 5 0 158 189 52 42 392 345
25 Ibid.
Total 629 253 146 102 482 411 258 359 1515 1125
26 Ibid.
27 The California Endowment. http://www.calendow.org/news/your-zip-code-lifetime.
Source: Applied Survey Research, 2015-2017. San Luis Obispo County Homeless Census.
28 U.S. Census Bureau. (2016). 2010-2015 American Community Survey, 1-year estimates.
18 Community Health Assessment | July 2018 San Luis Obispo County 19SOCIAL DETERMINANTS OF HEALTH SOCIAL DETERMINANTS OF HEALTH
and seniors had a smaller increase during the same time period.29 Self-Sufficiency Standards, San Luis Obispo County, 2014
While the Federal Poverty Level, a metric developed in the 1960s, bases its formula solely on
Expense Type Single Adult + 2 Adults +
the cost of food, it does not consider other factors such as child care, transportation, medical Single Adult
(Monthly) 2 Children 2 Children
needs, and housing costs, which can vary considerably across the country. For this reason, the
Housing $941 $1,215 $1,215
state of California uses another measure to estimate poverty: the Self-Sufficiency Standard. The
Child Care $0 $514 $1,600
Self-Sufficiency Standard provides a threshold income needed for families to meet their basic
Food $244 $646 $765
needs without public or private assistance. It provides a more comprehensive measure of income
Transportation $278 $287 $543
adequacy by taking into account housing, child care, health care, transportation, food, taxes,
Health Care $137 $452 $482
and economic differences between counties. It also better assesses changing costs over time
Miscellaneous $160 $311 $461
compared to federal poverty estimates.
Taxes $348 $536 $914
In 2014, 24,781 households (35.3 percent of all households) in San Luis Obispo County were living Earned Income Tax $0 $0 $0
below the Self-Sufficiency Standard.30 A single adult in San Luis Obispo County would need to Credit
earn $11.98 per hour and work 40 hours a week in 2014 to be self-sufficient, whereas a single Child Care Tax Credit $0 -$50 -$100
adult with a teenager and a school-aged child would need to earn $21.28 per hour.31 Child Tax Credit $0 -$167 -$167
Self-perception of health status and well-being is also a powerful indicator of the health status of a Self-Sufficiency Wage
community. When ACTION telephone survey respondents were asked to rate their overall health, Hourly Per Adult $11.98 $21.28 $16.23
those who had less than $300 in a savings account were far more likely to rate their health as “Fair”
Monthly $2,109 $3,745 $5,713
or “Poor” (48.95 percent) as compared to their counterparts with more savings (22.35 percent).
Annually $25,305 $44,935 $68,560
ACTION telephone survey respondents were asked if they went without any basic needs in the
last year. Overall, 5.6 percent reported going without health care and 3.8 percent went without Source: Insight Center for Community Economic Development. (2016).The Self-Sufficiency Standard for Individuals and
Families in San Luis Obispo County, CA, 2014. https://insightcced.org/tools-metrics/self-sufficiency-standard-tool-for-
food. Spanish-speaking respondents had much higher levels of difficulty: nearly 17 percent went
california
without health care in the last year, followed by nearly 16 percent who went without housing,
and 11.2 percent without food. When Spanish-speaking respondents were asked why they went
without these basic needs, the majority responded they had “no money to pay for it.”
Responses to: “In any given month during the past year, did you go without ... ?”
Spanish-
Employment Basic Need Overall Homeless
Speaking
Health care 5.6 % 31.6 % 16.9 %
Why this Matters
A well-paying job with income stability makes it easier for workers to live in healthier Food 3.8 % 42.1 % 11.2 %
neighborhoods, provide quality education for their children, secure child care services, and buy Child Care 1.3 % 5.3 % 9.0 %
more nutritious food—all of which have substantial impacts on health. This includes not only base Utilities 0.9 % 29.8 % 4.5 %
salary, but also the benefits that come with stable employment, including insurance, vacation Housing 1.9 % 70.2 %* 15.7 %
and sick time, and family leave. Higher earning translates to a longer lifespan—since 1977, the Other 0.2 % 5.3 % 1.1 %
life expectancy of male workers retiring at age 65 has risen 5.8 years for top earners, but only 1.3 Did Not Go Without Basic Needs 88.7 % 15.8 % 69.7 %
years for their lower-earning counterparts.32
Source: ACTION for Healthy Communities Telephone Survey, 2016.
29 U.S. Census Bureau. (2016). 2010-2015 American Community Survey, 1-year estimates. * The 2017 San Luis Obispo County Homeless Point-in-Time Count found 1,125 individuals in San Luis Obispo County who
met the HUD definition of homelessness. Of those counted, approximately 70 percent were unsheltered (sleeping outdoors,
30 Insight Center for Community Economic Development. (2016).The Self-Sufficiency Standard for Individuals and Families in San Luis Obispo County, CA,
2014. https://insightcced.org/tools-metrics/self-sufficiency-standard-tool-for-california. on the street, in parks, in vehicles, etc.) and approximately 30 percent were sheltered (such as in an emergency shelter or
transitional housing). These survey results reflect a similar pattern.
31 Ibid.
32 Social Security Administration. Office of Policy. Trends in Mortality Differentials and Life Expectancy for Male Social Security–Covered Workers, by
Average Relative Earnings; (2007) https://www.ssa.gov/policy/docs/workingpapers/wp108.html.
20 Community Health Assessment | July 2018 San Luis Obispo County 21SOCIAL DETERMINANTS OF HEALTH SOCIAL DETERMINANTS OF HEALTH
Employment by Sector, San Luis Leisure and Hospitality-Related
In San Luis Obispo County Obispo County, 2017 Industry Estimates of Wages, San Luis
Compared to the state of California, San Luis Obispo County had a lower percentage of Obispo County, 2016
unemployment during the past decade. In December 2017, the unemployment rate in San Luis Job Sector # of Jobs
Obispo County was 3.1 percent, compared to a statewide average of 4.2 percent and a nationwide Service Industry (retail, food) 102,000 Mean
average of 3.9 percent.33 The highest unemployment rate in the county was 6.5 percent in San Occupation Annual
Local, State & Federal Government 25,100
Miguel, while the lowest unemployment rate was 1.7 percent in Cayucos during this same period.34 Wage
Trade, Transportation, and Utilities 21,200
However, many jobs are in low-paying industries, many without benefits such as health insurance Leisure and Hospitality Services 18,500 Food Preparation and Serving-Related $26,554
—and these are the sectors that are growing. The leisure and hospitality industries have been Education and Health Services 15,400 Maids and Housekeeping Cleaners $22,903
the largest contributors to the county’s overall growth from 2016 to 2017, increasing payrolls Mining and Construction 7,500 Landscaping and Grounds Keeping $28,736
by 4.5 percent (800 jobs).35 This is because the county is a prime destination for visitors. Other Manufacturing 6,800 San Luis Obispo County average/mean $46,030
industries leading employment gains include information services, construction, education, and Farm 4,800 National average/mean $48,308
health. Health services employment will continue to play an important role as the county’s aging Finance, Insurance, Real Estate 4,100 Source: U.S. Department of Labor, Bureau of Labor Statistics.
population drives the demand for health-related services.36 (2017). Occupational Employment and Wages in San Luis
Information Services 1, 400
Obispo-Paso Robles-Arroyo Grande – May 2016.
Surveyed residents were asked if they were concerned about employment opportunities in their Total All Industries 121,100
community. Rates were quite high across the county: 67.8 percent of respondents in North Coast
reported being “very concerned” or “somewhat concerned,” as did 68.5 percent in North County, Source: California Employment Development Department.
74 percent in San Luis Obispo, and 74.3 percent in South County.37 Industry Employment and Labor Force, March 2017.
Food Security Percentage of School-Aged Children Enrolled in Free and Reduced-Price Meal
Why this Matters Program, San Luis Obispo County, 2016
Access to affordable, healthy food is a critical component for health and well-being. Food
insecurity is associated with malnutrition, particularly as it relates to inadequate consumption of Jurisdiction Population
nutritious foods such as fresh fruit and vegetables. Individuals living in food insecure households Shandon Joint Unified 75.8 %
face more health challenges and are more likely to suffer from chronic diseases such as obesity, County Office of Education 74.4 %
type 2 diabetes, and pulmonary disease. Coast Unified 63.1 %
California Average 58.9 %
National Context San Miguel Joint Union 54.2 %
Forty-two million people face hunger in the U.S., including 13 million children and 5.4 million
Lucia Mar Unified 51.6 %
seniors.38
Paso Robles Joint Unified 51.1 %
In San Luis Obispo County Pleasant Valley Joint Union Elementary 45.5 %
Twenty-seven percent of San Luis Obispo County residents whose income is less than 200 percent SLO County Average 44.2 %
of the Federal Poverty Level reported they were not able to afford enough food in 2014.39 San Luis Coastal Unified 36.6 %
Atascadero Unified 35.0 %
33 State of California Employment Development Department. (2017). Unemployment Rate and Labor Force Summary for San Luis Obispo County. http://
www.labormarketinfo.edd.ca.gov/data/unemployment-and-labor-force.html. Cayucos Elementary 34.3 %
34 Ibid. Templeton Unified 16.9 %
35 Ibid.
36 Beacon Economics. (2016). 2016 Central Coast Economic Forecast.
Source: California Department of Education, Data Reporting Office, Free and Reduced Price Meals, San Luis Obispo
37 ACTION for Healthy Communities. (2016). Vital Signs – Understanding San Luis Obispo County. http://actionslo.org. County (2016); Taken from ACTION for Healthy Communities report, 2016.
38 Feeding America. http://www.feedingamerica.org/hunger-in-america/hunger-and-poverty-facts.html.
39 UCLA Center for Health Policy Research. AskCHIS. 2014. Food security (ability to afford enough food): Adults. (San Luis Obispo County). http://ask.chis.
ucla.edu.
22 Community Health Assessment | July 2018 San Luis Obispo County 23SOCIAL DETERMINANTS OF HEALTH SOCIAL DETERMINANTS OF HEALTH
Many of these residents turn to programs like CalFresh (food stamps) and school meal programs. likely to be victims of violence and crime, including adolescents, who face higher rates of robbery,
In 2013, 43,893 individuals were eligible to receive CalFresh based on their income, but only assault, rape and other sexual assault than do adults.49
18,524 did so.40 This is one of the lowest utilization rates in the state, with San Luis Obispo County
ranking 51 out of 58 counties.41 School meal program participation varied across the county, with Violence (both physical and emotional) can also occur within homes and schools. Nationally, the
an average of 44.2 percent of students participating from 2015-2016.42 This was lower than the rate of substantiated child abuse was 9.2 cases per 1,000 population. This type of abuse can
state overall, which remained at 58.5 percent during the same time period.43 lead to cognitive, emotional, and behavioral problems, like anxiety, depression, substance abuse,
delinquency, difficulty in school, and early sexual activity.50 New research shows that 38 percent
In 2016, approximately 46,000 San Luis Obispo County residents faced hunger, a 4.5 percent or more of children nationwide have had at least one Adverse Childhood Experience (ACE), such
increase from 2013 (44,000).44 Of those facing hunger, 40 percent are youth, age 18 or younger, as the death or incarceration of a parent, witnessing or being a victim of violence, or living with
and 20 percent are seniors, often on a fixed income.45 someone who has been suicidal or had a drug or alcohol problem.51
Even with rates lower than the state, food security remains a problem in the county. Twenty-three Nationally, bullying in the school and cyber settings has also received significant attention, with
of 53 census tracts (122,873 people) in the county still live within USDA-defined food deserts. Food 20.2 percent of eleventh grade students reporting harassment or bullying on school property
deserts are defined as parts of the country with limited access to fresh fruit, vegetables, and other within the past 12 months and 15.5 percent reporting cyber bullying (including by e-mail, chat
healthy foods, a significant share of residents are more than 1 mile (urban) or 10 miles (rural) rooms, instant messaging, websites, or texting) in the past 12 months.52
from the nearest supermarket.46 The prevalence of guns in a community can also have an effect on crime. Each year, 33,000 people
in the U.S. die as a result of gun violence, and almost 85,000 more suffer non-fatal gun injuries.53
Violence In San Luis Obispo County
The top three public safety concerns for residents surveyed in 2016 included crime (72
Why this Matters
percent), child abuse (71 percent), and family violence (66 percent). The majority (81 percent) of
Violence affects people in all stages of life. Violence includes physical acts such as rape, robbery,
respondents felt “very safe” in their neighborhood in 2016. Among Spanish-speaking respondents,
aggravated assault and homicide, as well as emotional and psychological violence that can
only 39 percent felt “very safe” in their neighborhood.
occur within homes, schools and neighborhoods. In addition to serious effects on individuals
and families, violence negatively impacts communities by diverting valuable resources, reducing The rate of violent crime in San Luis Obispo County rose from 251.9 crimes per 100,000 residents
productivity, decreasing property values, and disrupting social services. in 2011 to 409.6 crimes per 100,000 residents in 2015.54 This violent crime rate is greater than the
national average of 383.2 per 100,000 population, but lower than California’s rate of 426.5 per
Studies have shown that violence contributes to poor physical and mental health. Victims of
100,000 population.55 Among reported violent crimes, homicide and robbery have both decreased
violence are at increased risk of depression, substance abuse, anxiety, reproductive health
in San Luis Obispo County since 2010, while aggravated assault and rape have increased. The rate
problems, and suicidal behavior.47 Additionally, exposure to violent crime in neighborhoods has
of homicide in San Luis Obispo County was 1.75 deaths per 100,000 population. The highest rate
been linked with higher rates of hypertension and other negative health outcomes.48
or violent crime by area in 2014 in San Luis Obispo County was Pismo Beach, at 51.5 per 1,000
National Context residents, with the lowest in Atascadero at 17.5 per 1,000 residents.
Violence and crime have been persistent problems nationally, but the U.S. saw major reductions
There were 642 domestic violence calls to law enforcement in the county in 2015, up from 551
in most types of violent crime between 1994 and 2014. Nonetheless, certain groups are more
40 County of San Luis Obispo Department of Social Services. (2017). Request for Proposal #1411, CalFresh Outreach.
41 California Food Policy Advocates. (2016). San Luis Obispo County Nutrition and Food Insecurity Profile. https://cfpa.net/county-profiles.
49 Baum, K. (2005). Juvenile victimization and offending, 1993-2003 (NCJ 209468): U.S. Bureau of Justice Statistics. http://bjs.ojp.usdoj.gov/content/pub/
42 California Department of Education, Data Reporting Office, Free and Reduced Price Meals, San Luis Obispo County (2016); Taken from ACTION for pdf/jvo03.pdf.
Healthy Communities report, 2016.
50 National Center for Injury Prevention and Control. (2016). Child abuse and neglect: Consequences. Centers for Disease Control and Prevention.
43 Ibid. Retrieved from: http://www.cdc.gov/ViolencePrevention/childmaltreatment/consequences.html.
44 Community Action Partnership of San Luis Obispo County (CAPSLO). (2017). Comprehensive Community Needs Assessment. https://www.capslo.org/ 51 RWJF. Traumatic Experiences Widespread Among U.S. Youth, New Data Show (2017). https://www.rwjf.org/en/library/articles-and-news/2017/10/
images/pdf/events/cap2016-2017.pdf. traumatic-experiences-widespread-among-u-s--youth--new-data-show.html.
45 Ibid. 52 Centers for Disease Control and Prevention. Youth Risk Behavior Surveillance System (2015). https://nccd.cdc.gov/youthonline/App/Default.aspx.
46 U.S. Department of Agriculture. Food Access Research Atlas. https://www.ers.usda.gov/data/fooddesert. 53 American Public Health Association (APHA). Preventing Gun Violence Fact Sheet (2016). https://www.apha.org/~/media/files/pdf/factsheets/160317_
gunviolencefs.ashx.
47 Krug, E.G., Dalhberg, L.L., Mercy, J.A., Zwi, A.B., & Lozano, R. (Eds.). (2002). World report on violence and health. World Health Organization, Geneva,
Switzerland. From http://www.who.int/violence_injury_prevention/violence/world_report/en/summary_en.pdf. 54 California Department of Justice. (2016). OpenJustic Data Portal. Crime Statistics. https://openjustice.doj.ca.gov/crime-statistics.
48 McClure, et al. (2015). Violent Crime Exposure and Pediatric Cardiovascular Health: A Spatial and Hierarchical Analysis for Low Income Children Living 55 Ibid.
in Boston. http://paa2015.princeton.edu/abstracts/150497.
24 Community Health Assessment | July 2018 San Luis Obispo County 25SOCIAL DETERMINANTS OF HEALTH SOCIAL DETERMINANTS OF HEALTH
calls in 2014.56 Of those calls, 368 involved a weapon, an increase from 339 calls involving a
weapon in 2014. Domestic violence is typically underreported so these numbers are likely an 11th-Grade Students Who Report They Have ...
underrepresentation. RISE, a service provider for survivors of domestic violence in San Luis
Obispo County, served 966 individuals (882 women; 84 men) in 2015–2016. This is a 69 percent
increase from 301 individuals served in 2012–2013.
Been bullied at school because of their sexual orientation 7%
6%
Sexual assault, especially on college campuses, has also been of concern in the county and
Been victims of cyber bullying in the past 12 months 19%
nationally. In 2016, California Polytechnic State University (Cal Poly) reported 17 cases of sexual 19% CA
assault, including rape, statutory rape, and fondling.57 At least five of those occurred off campus.
Been bullied at school in the past 12 months 31% SLO
This is an increase from the previous year, when a total of 9 cases (on- and off-campus) were 32%
reported. According to the FBI’s Uniform Crime Reporting (UCR) program, 284 rapes were Seriously considered suicide in the last year
Source: California Healthy Kids Survey, 2013-2014, 2015-2016. 19%
reported in the county from 2014 to 2016.58 Almost half of those were reported in the city of 18%
San Luis Obispo.59 In 2016, the San Luis Obispo Police Department reported a total of 38 rapes, Felt persistent sad or hopeless feelings 34%
higher than the total number of rapes (21) reported that year by the SLO County Sheriff’s Office, 33%
which serves unincorporated areas, and nearly five times higher than Paso Robles, the next most
populous city.60
The rate of substantiated child abuse cases in San Luis Obispo County, 11.4 per 1,000, is higher
than both the state (8.0 per 1,000) and the nation (9.2 cases per 1,000).61 The vast majority of cases
were classified as “general neglect.”
Within schools in San Luis Obispo County, 32 percent of eleventh graders had been bullied in the
past year, higher than the national average of 20.2 percent. During the same year, 19 percent
reported they had been victims of cyber bullying, higher than the national average of 15.5
percent.62
56 California Department of Justice, Criminal Justice Statistics Center. (2010–2015). Domestic Violence-Related Calls for Assistance.
57 Cal Poly University. (2017). 2017 Annual Security Report. Jeanne Clery Disclosure of Campus Security Policies & Campus Crime. https://afd.calpoly.
edu/police/safety/reports/cleryreport.pdf.
58 FBI. (2016). Uniform Crime Reporting (UCR) program. https://ucr.fbi.gov/crime-in-the-u.s/2017/preliminary-report/tables/table-4/state-cuts/alabama-
through-california.xls.
59 Ibid.
60 Ibid.
61 Webster, D., et al. Child Welfare Services Reports for California, U.C. Berkeley Center for Social Services Research (Jun. 2016); Annie E. Casey
Foundation, KIDS COUNT (Jul. 2016). http://cssr.berkeley.edu/ucb_childwelfare.
62 WestEd. (2015-2016). California Healthy Kids Survey Main Report. http://chks.wested.org/reports.
26 Community Health Assessment | July 2018 San Luis Obispo County 27You can also read